Original Article
Prediction of care after surgery using surgical Apgar score during surgery by surgeons and anesthesiologists
Ibrahim M.Al-Gwairy MD, FACS* Sadeq M.Dameh MD, Khaled S.El-Share MD, Ali M.Al-Oun MD, Ramadan I.Hassanat MD
*Corresponding author: Department of general surgery, RMS, KHMC, Amman, Jordan. E mail: ibrahemmogeer@ yahoo.com.
Abstract
Background: Medical providers continue to maintain a decreased frequency of major hazards after surgery for patients undergoing any surgery. Variable postoperative outcomes can be due to differences in patients’ preoperative risks. The intraoperative surgical Apgar score may predict postoperative one month hazards.
Objective: To show the influence of applying the surgical Apgar score by surgeons and anesthesiologists together on clinical outcome after surgery.
Methods: Our prospective, double blind and randomized included 166 patients, of both sexes, aged 35-62 years, classed I-IV physical status by the American society of anesthesiologists and scheduled for different elective or emergency general surgical procedures with routine outpatient or inpatient follow up after surgery at Prince Hashim(Zarqa) and King Hussein(Amman) hospitals, Jordan, during the period June 2015-June 2016, after obtaining written informed consent from all participants . Patients were divided into a group I (n=83) with standard outcome after surgery and a group II (n=83) with outcome affected by the surgical Apgar score. In the second group, the surgical Apgar score was calculated by grouping patients into three classes (0-3,4-7 and 8-10). The ten-point surgical Apgar score is recorded at the end of any surgery from the average blood loss, least mean arterial pressure and least heart rate during the surgery. The score is the sum of the points (0, 1, 2, 3 and 4) from each category. The primary outcome included a one month hazards after surgery. Secondary outcome included immediate admissions to the
intensive care unit during one month of the primary surgery. Continuous variables were analyzed using Mann–Whitney U test. Categorical variables were analysed
using chi-squared test. Univariate logistic regression was used to compare outcomes in the two groups. Results: Frequency of hazards was comparable in both groups (GI: 24/83 (28.9%), GII: 27/83 (32.5%), although it was more in the second group, P>0.05). Immediate admissions to the intensive care unit was more but not significant in the second group (22/83(26.5%) than in the first group (16/83(19.3%), (P>0.05).
Conclusions: The surgical apgar score may show a discrepancy in postoperative outcome, especially if differences in clinical outcome are to be implemented, using a quality enhancement method.
Keywords: hazards after surgery; intensive care unit admission; surgical Apgar score.
Introduction
Medical providers continue to maintain a decreased frequency of major hazards for patients undergoing any surgery. Variable outcomes can be due to differences in patients’ preoperative risks. Surgical quality evaluation, such as the American College of Surgeons’ National Surgical Quality Improvement Program assesses surgical performance indirectly. In the theatre, surgeons have depended mainly on “gut-feeling” clinical evaluation of the surgery course for prediction after surgery. Management during surgery participates mainly to overall outcomes. Intraoperative factors include changes of patient status
such as hypotension,
hypertension, hypothermia,
bradycardia, tachycardia and blood loss which were related indirectly adverse outcomes.
Prediction investigations are achieved in medicine to control management for patient advantage. In surgery, there are different clinical risk scoring systems to expect outcomes postoperatively. The American Society of Anesthesiologists scoring system has a small use in expecting patient outcome after surgery (positive expecting value for complications: 57%, negative expecting value: 80% (1)).Physiological and Operative Severity Score for the enUmeration of Mortality and morbidity) is more accurate but in the same time more complex with no role in routine clinical practice.
The surgical Apgar score is a simple and objective ten-point prediction scoring system recorded after surgery (but not
before surgery) and based on three parameters during surgery: least heart rate, least mean arterial pressure and average blood loss. Gawande et al in 2007(2) demonstrated a strong relation with major hazards, during general or vascular surgery, one month postoperatively: a decreased score on a scale of 0 - 10 point expects a poorer prognosis. Surgical apgar score was tested in patients scheduled for general, vascular, urological, gynaecological, orthopaedic, pancreatic and neurosurgery (3,4) and in surgical subspecialties (5). The surgical apgar score predicted hazards after uncomplicated discharge of colorectal resection (6).Other investigations failed to show the prognostic value of the surgical apgar score (7). The score measures only the relative success of care. It cannot by itself evaluate the quality of care because its three parameters are affected not only by the performance of surgical teams, but also by the patients’ pre- status and the magnitude of the surgery.
Recognizing high risk patients scheduled for surgery and decreasing their perioperative risk is crucial. Plans to decrease a one month hazards after surgery are vital to remarkably increase long-term life expectancy. The surgical apgar score may ease communication between care providers in order to direct the management after surgery (8). The surgical apgar score was used to direct and advantage outcome after surgery.
The objective of our investigation was to show the influence of the surgical
apgar score on clinical outcome after surgery.
Methods
Our prospective, double blind and randomized included 166 patients, of both sexes, aged 35-62 years, classed I-IV physical status by the American society of anaesthesiologists and scheduled for different elective or emergency general surgical procedures with routine outpatient and inpatient follow up after surgery at Prince Hashim(Zarqa) and King Hussein(Amman) hospitals, Jordan, during the period June 2015-June 2016,after obtaining written informed consent from all participants and approval from our local ethical and research board review committee of the royal medical services . Patients were divided into a group I (n=83) with standard outcome after surgery and a group II (n=83) with outcome affected by the surgical Apgar score.Type of surgery was graded as emergency or elective. Patient demographics were recorded, including age, gender and surgery class (minor, intermediate or major).
In the second group, the surgical Apgar score was calculated using Table I, grouping patients into three classes (0-3,4-7 and 8-10). The ten-point surgical Apgar score is recorded at the end of any surgery from the average blood loss, least mean arterial pressure and least heart rate during the surgery. The score is the sum of the points from each category. In patients with scores of 8–10, no action is needed; with scores of 4–7, antibiotic is administered with stress ulcer and venous thromboembolism prevention , review the patient in eight hours
and then twice daily for the next two days; with scores of 0–3, consider admission to intensive care unit and review in four hours. In group I, the surgical Apgar score was not calculated and management was as local standard clinical care.
Outcome was recorded after one month in an outpatient or inpatient conditions. The primary outcome was major hazards during one month of operation. Major hazards included pneumonia, wound disruption, surgical site infection and sepsis. Secondary outcome included immediate admissions to the intensive care unit during one month of the primary surgery.
Statistics
Continuous variables were analysed using Mann–Whitney U test. Categorical variables were analysed using chi-squared test. Univariate logistic regression was used to compare outcomes in the two groups.
Results
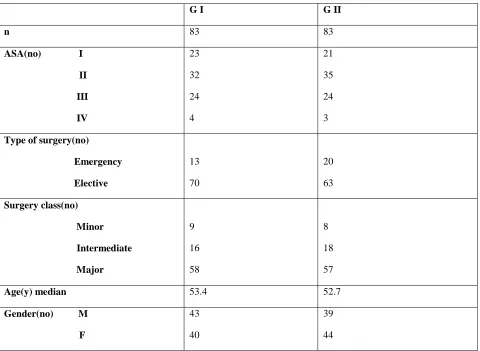
There were no significant differences regarding the demographics of the participants between the two groups (Table II).
Regarding the distribution of patients in both groups according to the surgical Apgar score, it was found that in the first group:9 patients(10.8%) were in the 0-3 score ,57 patients (68.7%)were in the 4-7 score and 17 patients(20.6%) were in the 8-10 score; while in the second group:7 patients (8.4%)were in the 0-3 score,50 patients (60.2%)were in the 4-7 score and 26 patients(31.3%) were in the 8-10 score. Median average blood loss was 380 ml and 360 ml in the first and second groups
respectively. Median least arterial blood pressure was 58.5 and 59.1 mmHg in groups I and II, respectively. Median least heart rate was 53.2 and 56.6 bpm in the above groups
respectively. There was no difference regarding hazards
between the groups (I: 24/83 (28.9%), II: 27/83 (32.5%); P>0.05).
There were no significant differences in terms of outcome using surgical Apgar score.The most frequent major hazards were in the 0-3 surgical Apgar score in both groups, 55.6% and 85.7% in groups I and II, respectively. The least incidence of hazards was 24.6% in the 4-7 surgical Apgar score in group I,while it was 23.1% in the 8-10 surgical Apgar score in group II. The most frequent major hazards were sepsis (12(14.5%)) and pneumonia (8(9.6%)) in the first group while the most frequent major hazards were wound disruption (9(10.8%)), pneumonia(8(9.6%)) and surgical site infection(8(9.6%)) in the second group
(Table III).
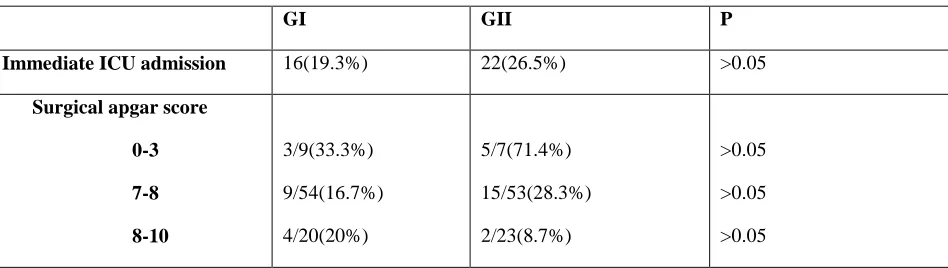
Immediate admissions to the intensive care unit were more in the second group compared to the first group (22, 16; respectively), mainly in the surgical apgar score of 0–3 where 5/7 patients (71.4%) were admitted compared with 3/9 (33.3%) in the first group (P>0.05). hazards (Table IV).
Discussion
Our investigation evaluated the effect of surgical apgar score on clinical outcome after surgery. In terms of care after surgery, in the second group with surgical apgar score of 0–3 , there was an increased but not significant immediate admissions to the intensive care unit (5/7 [71.4%] compared to
3/9 [33.3%] in the first group). Regarding clinical outcome (major hazards), there was no difference between the groups (GI: 24/83 (28.9%), GII: 27/83 (32.5%), P>0.05). The percentage of reduced scores might be increased by optimizing the inclusion and exclusion criterion to choose an increased risk group. Examiner bias and the Hawthorne effect (9) and the contamination effect, with application of the interventions in the control group due to high recall are other factors of bias.
The effect of our interventions could be enhanced if applied mandatorily rather than decisively (all patients with surgical apgar score of 0–3 are admitted to the intensive care unit).Our investigation had to be larger and the care should be based on the surgical apgar score and quality enhancement method with large postoperative interventions and enhancement in care such as checking arterial blood gases, goal directed fluid therapy, muscle relaxants reversed with a nerve stimulator and hypothermia corrected(10). Other techniques include enhanced glycaemic control, early nutritional evaluation and early mobilization. Major hazards after the surgery have had a minor effect on clinical outcome. Enhanced recovery decrease morbidity after surgery (11). Most interventions after surgery are administered pre- and intra-operatively. Decreased morbidity is caused by a reduced stress response after surgery. Regarding the surgical apgar score, there is no expectation of prognosis postoperatively to act efficiently after surgery. The surgical apgar score may be more important as an indicator of surgery and anesthesia quality rather than
as a predictor of patient outcome after surgery.
The surgical apgar score was easy to calculate. Our findings were in accordance with previous investigations from various countries and patient groups (3-4). Intensive care admission after surgery is correlated with enhanced expectancy of life (12).Increased risk patients scheduled for major general surgery might take advantage from routine admission to the intensive care unit after surgery (13). After adjustment for co-diseases and method risk factors, the blood loss, least heart rate and least blood pressure were still strong predictors of the risk of major hazards. The Surgical Apgar Score is a useful predictor, alone or with evaluation of the patient’s risks.Surgical providers could cut a patient’s risk of major hazards in half with a score of 8–10 nearly triple the risk with scores of less than 3.Hemodynamic stability and intraoperative blood loss were independent factors in patient outcomes, but the collective importance of these variables was not known.
The score may decide unplanned admission after outpatient surgery, admission to the intensive care unit or percentage of examinations after operation to avoid poor outcomes within low-scoring patients. The Surgical Apgar Score assesses the efficiency and safety of interventions in the theatre as more than 66% of surgical adverse events are complications in the theatre (2).Low scores might direct medical providers to concentrate on patients at highest risk of major complications after surgery. Low surgical scores (of 3 or less), even with no complications, could early
recognize latent safety problems, to enhance outcomes, decreasing the percentage of patients with low scores and increasing the proportion with the highest scores.
Surgery with a score of 7 - 8 has no changed predicted risk; surgery with a score of 9 - 10 has decreased risk by 50%; surgery with a score of 5–6 has increased complications by 60%; and surgery with a score of 4 or less has increased risk by 200% (14).Poor scoring patients (surgical apgar score 0–4) are 16 times more likely to have a major complication than patients with the highest scores (9–10) (2).Risks of major complications were estimated as 60%, 15% and 5% respectively (4).
Conclusions
The surgical apgar score may show a discrepancy in care after surgery (admission to the intensive care unit) easily. A large intervention after surgery classed by the surgical Apgar score must be addressed using a quality enhancement method. The surgical apgar score was approved as a prognostic of major.
References
1. Barnett S, Moonesinghe SR. Clinical risk scores to guide perioperative management. Postgrad Med J2011; 87: 535– 541.
2. Gawande AA, Kwaan MR, Regenbogen
SE et al An Apgar score for surgery. J Am
Coll Surg 2007; 204: 201–208.
3. Assifi MM, Lindenmeyer J, Leiby BE et al Surgical Apgar score predicts perioperative morbidity in patients undergoing pancreaticoduodenectomy at a
high-volume center. J Gastrointest Surg 2012; 16: 275–281
4. Ziewacz JE, Davis MC, Lau D et al Validation of the surgical Apgar score in a neurosurgical patient population. J Neurosurg 2013; 118: 270–279.
5. Reynolds PQ, Sanders NW, Schildcrout
JS et al Expansion of the surgical Apgar
score across all surgical subspecialties as a means to predict postoperative mortality. Anesthesiology 2011; 114: 1,305– 1,312.
6. Regenbogen SE, Bordeianou L, Hutter MM, Gawande AA. The intraoperative Surgical Apgar Score predicts postdischarge complications after colon and rectal resection. Surgery 2010; 148: 559–566.
7. Levi E, Nasis L, Chiu D et al Is an Apgar score for surgical patients useful? ANZ J Surg 2009; 79: A32.
8. Thorn CC, Chan M, Sinha N, Harrison RA. Utility of the Surgical Apgar Score in a district general hospital. World J Surg 2012; 36: 1,066–1,073.
9. A New Vision. Harvard Business School. http://www.library.hbs.edu/hc/hawt horne/anewvision.html(cited April 2014).
10. Royal College of Surgeons of England, Department of Health. The Higher Risk General Surgical Patient. London: RCS; 2011.
11. Grocott MP, Martin DS, Mythen MG. Enhanced recovery pathways as a way to reduce surgical morbidity. Curr Opin Crit Care 2012; 18: 385–392.
12. Rhodes A, Moreno RP, Metnitz B et al Epidemiology and outcome following post-surgical admission to critical care. Intensive Care Med 2011; 37: 1,466– 1,472.
13. Pearse RM, Holt PJ, Grocott MP. Managing perioperative risk in patients undergoing elective non-cardiac surgery. BMJ 2011; 343: d5759.
14. Haddow JB, Adwan H, Clark SE, Tayeh S, et al . Use of the surgical Apgar score to guide postoperative care.Ann R Coll Surg Engl. 2014 Jul; 96(5):352-8.
Table I. The surgical Apgar score.
Points
0 1 2 3 4
Average blood loss (ml) >1000 601-1000 101-600 <100
Least mean arterial pressure(mmHg) <40 40-54 55-69 >70
Least heart rate(bpm) >85 76-85 66-75 56-65 <55
Table II. Patient’s demographics.
G I G II
n 83 83
ASA(no) I
II
III
IV
23 32 24 4
21 35 24 3
Type of surgery(no)
Emergency
Elective
13 70
20 63
Surgery class(no)
Minor
Intermediate
Major
9 16 58
8 18 57
Age(y) median 53.4 52.7
Gender(no) M
F
43 40
39 44
Table III. Study outcomes.
GI GII P
Major hazards 24(28.9%) 27(32.5%) >0.05
Surgical apgar score
0-3
4-7
8-10
5/9(55.6%) 14/57(24.6%) 5/17(29.4%)
6/7(85.7%) 15/50(30%) 6/26(23.1%)
>0.05 >0.05 >0.05
Frequency
Sepsis 12(14.5%) 6(7.2%) >0.05
Wound disruption 7(8.4%) 9(10.8%) >0.05
Pneumonia 8(9.6%) 8(9.6%) >0.05
Surgical site infection 7(8.4%) 8(9.6%) >0.05
Table IV. Intensive care unit admission.
GI GII P
Immediate ICU admission 16(19.3%) 22(26.5%) >0.05
Surgical apgar score 0-3
7-8
8-10
3/9(33.3%) 9/54(16.7%) 4/20(20%)
5/7(71.4%) 15/53(28.3%) 2/23(8.7%)
>0.05 >0.05 >0.05