A Guide to Using Asynchronous Remote
Communities (ARC) for Researching Distributed
Populations
Haley MacLeod
1,∗, Ben Jelen
1, Annu Prabhakar
1, Lora Oehlberg
2, Katie Siek
1, Kay Connelly
1 1School of Informatics and Computing, Indiana University, Bloomington, Indiana, USA2Department of Computer Science, University of Calgary, Calgary, Alberta, Canada
Abstract
Existing research methods are largely intended to be conducted co-located and synchronously with a study population, but this approach is not feasible with remote or distributed populations. We describe a needs assessment study we conducted on Facebook. We report on our use of adapted versions of commonly used HCI research methods and lessons learned from this approach.
Receivedon 01 July 2016;acceptedon 02 February 2017;publishedon 18 July 2017
Keywords: class file, LATEX 2ε, EAIEndorsedTransactions
Copyright© 2017 Haley MacLeod etal.,licensedto EAI. Thisisanopenaccessarticledistributedunderthetermsof theCreativeCommonsAttributionlicense(http://creativecommons.org/licenses/by/3.0/),whichpermitsunlimited use,distributionandreproductioninanymediumsolongastheoriginalworkisproperlycited.
doi:10.4108/eai.18-7-2017.152898
1. Introduction
Human-centered research methods, including inter-views, focus groups, diary/elicitation studies, design workshops, and role-playing are largely intended to be conducted co-located and synchronously with study populations to make significant contributions and impact the designs of future systems. Co-located stud-ies are not always possible for group-based methods when participants have limited travel access or when social, political, or economic climates inhibit a poten-tial participant’s ability to assemble. In some cases, researchers may not have access to enough participants in their local areas. Finally, participants may not feel comfortable in a physical study setting, whether being physically present or allowing researchers into their environments.
Researchers need ways of conducting group-based studies online to (1) ensure perspectives from under-served populations are considered when designing new systems, and (2) improve the scientific merit of our research by expanding sample sizes to reach theoretical saturation or statistical power. Although previous work proposed remote strategies via instant messaging [40], email and phone [14], and video chat approach [22],
∗
Corresponding author. Email:[email protected]
there has been little discussion on remote group-based methods. Specifically: (1) What are the challenges of conducting group-based research at a distance? (2) How do the technologies we use to mediate this technique matter?
In this work, we describe our approach to conducting group-based needs assessment research using Asyn-chronous Remote Communities (“the ARC method"). We liken this approach to a to web-based focus group, augmented with additional activities often used in design research (diaries, scenarios, personas, etc.).
We piloted the ARC method with people with rare diseases. Rare diseases, by definition, impact a small number of people (less than 0.05% of a population). Thus, local access to participants is unrealistic as the small population is geographically dispersed. We found in our previous work [30] that people with rare diseases are highly active on Facebook, so we used a private Facebook group to facilitate study activities. Over the course of 22 weeks, 13 participants completed a variety of activities to contribute to a deeper understanding of their needs and challenges.
Here, we report not on the results of the study, but on the ARC method itself, and the activities we used to collect information about the needs of this distributed and remote population. We see this ARC
1
on
Pervasive Health and Technology
Research Article
method as a first step towards conducting group-based needs assessments remotely. We provided some initial discussion of this work in [28,29]. Our primary contribution here is a detailed, in depth description of the ARC method such that other researchers may replicate, modify, and improve upon this method; we encourage researchers to report on their own experiences and results with different populations.
2. Related Work
Here, we discuss existing approaches to conducting HCI research remotely, and provide a brief overview of some commonly used research methods that inspired or influenced our own methodological choices.
2.1. RemoteHCIResearchMethods
Some discussion has occurred on best practices for conducting research with participants remotely. In particular, researchers proposed strategies for remote interviews, since they are considered to be valuable but challenging methods. Voida et al. [40] employed instant messaging for conducting interviews remotely and noted that attention expectations, timing, context, and persistence are all impacted as a result of the text-based method. Dimond et al. [14] extend this work to include email and phone as additional methods of qualitative data collection, noting that synchronous interviews (by phone) tended to produce much longer transcripts than semi-synchronous (instant message) or asynchronous (email) methods, but that they do not necessarily produce more unique ideas. Hillman et al. [22] provided an in-depth discussion of their approach to conducting interviews over video chat, and the challenges they faced.
Focus groups, although often used for needs assess-ments, have not seen the same level of discussion within Pervasive Health or Human Computer Interaction com-munities about their adaptability for remote popula-tions. Researchers in social science and market research suggested real-time virtual focus group with people participating through online bulletin boards [37], as well as online communities [35]. These discussions do not necessarily take into account the specific goals of needs assessments in HCI, or the types of activities conducted in design research. In our work, we rely on Sweet’s [37] guidelines for online focus groups, but augment their method by introducing some additional HCI research methods, translated to an online format.
2.2. Overviewof HCIResearchMethods
Group-based methods add value by allowing researchers to obtain a range of viewpoints in less time. They may mitigate the shortcomings of one-on-one methods (e.g., empowering shier participants to
contribute as they are comfortable) and can engender interaction between participants, enabling them to raise ideas they might not have thought of on their own [26]. Here we provide a brief overview of methods that informed or inspired our own methodological choices. Many of these are group-based methods, however we also leveraged some one-on-one methods and adapted them for a group setting.
Focus Groups have the benefit of receiving many perspectives at once and allow participants to build on each other’s contributions. Focus group participants, however may be unwilling to discuss sensitive topics in a group setting and talkative/opinionated participants can monopolize conversations [6]. These challenges are overcome by skillful facilitation and careful moderation; a trained focus group moderator and an HCI researcher might work side by side [26].
Surveys are powerful tools for getting data from larger samples and are often used to describe populations or explain behaviors [3]. Surveys are often used alongside other HCI methods, as a way of validating findings across a larger population, confirming the results of qualitative analysis with the existing study population, or obtaining baseline information about an understudied population [15].
Diaries are useful when asking people to reflect on things that change over time, like mood or opinion [2]. They may provide more accurate information, since people are expected to document events as they go, instead of recalling past events [26]. Participants may not adhere to the study expectations (e.g., retroactively filling in data shortly before a study session, known as “parking lot compliance” [23]) which can impact the reliability of the data.. There is room for a variety of media in diary studies, such as text, photos, audio, and video (e.g., [1,5,8,12]) captured using a range of tools like paper, online forms, mobile phones, or cameras (e.g., [1,12, 16, 34]). In our ARC method, we use the data collection phase of the diary study as an individual activity, but have participants share their logs with each other and discuss them.
Personas & Scenariosgive designers a specific person or context to design for, without relying too much on an actual person’s idea of how to address the problem. Cooper [13] argues that “merely being the victim of a particular problem doesn’t automatically bestow on one the power to see its solution."These can be developed with participants to discover these use cases or personas [4], or can allow existing findings to be reframed in a way useful to design [41]. In our ARC method, we use personas as a way of getting feedback towards the end of the study about our understanding of participants’ contributions. Additionally, we have participants create scenarios as part of the group in a few of the activities (discussed in greater detail below).
2 EAI Endorsed Transactions Health and TechnologyonPervasive
3. The ARC Method
In this section, we provide a detailed description of our approach from recruitment and informed consent, to our procedure and analysis methods, and follow up after the study.
3.1. Recruitment
We recruited adults (18+) with a rare disease from Facebook support groups. We joined most of these groups to recruit for previous studies ([30,31]). In those cases one of the researchers had been a member of those groups for over a year at the time we began recruiting for this study. We also joined several additional groups for recruitment. We posted a link to our IRB approved study information sheet to each group along with a brief recruitment message. Group members who were interested were instructed to contact the researchers by Facebook message or email.
Because we would be conducting the study on Facebook, we recruited only from Facebook. We did not want to create additional privacy risks by encouraging people to share their data on Facebook who were not already doing so.
3.2. InformedConsent
We used email or private Facebook messages to send the informed consent document to anyone expressing interest in the study. Potential participants were instructed to review the document, print it, sign it, scan or photograph the signature page, and return it to the research team by email or private Facebook message. We required a physical signature, instead of a typed response or digital signature, to ensure participants took the informed consent process seriously, particularly in the absence of a physically present researcher to walk through the document with them. We also saw this task as a way of screening out participants who would be unable to complete activities during the study which required at least a moderate level of technological competency and access.
3.3. Participants
Participants ranged in age from 32–68 (µ= 48.9, σ = 14.4). Eleven participants identified as female (N = 13). All participants were from the US, except one, who was from Australia. Two participants were employed full time, while the rest were either unemployed, receiving disability payments, or retired at the time of the study. They each received a $50 honorarium sent as a check by mail for their participation in the study, regardless of their level of activity.
3.4. ProcedureOverview
We created a private Facebook group for this study and invited people who completed the informed consent process to join. We chose Facebook as the platform on which we conducted this research because it is actively used by people with rare diseases as a way of connecting with each other (more than online platforms specifically for rare diseases) [30].
We conducted the study over the course of 22 weeks, beginning with a 5 day period of introductions to help participants get to know each other and become comfortable in the group environment. We then introduced 11 activities (summarized as A1–A11 in Table1) over the course of the remaining 21 weeks.
We also sometimes posted research updates and participants frequently started new conversations on their own. At the request of one participant, we tagged activity posts (starting from the second activity) with [ACTIVITY] so participants could tell the difference between posts that were “official” research tasks and “less important” posts from researchers or other participants.
3.5. Activities
Here we review the inspiration for each of the 11 activities and what the activity entailed. We categorize each activity by:
• Shared. Was the activity response shared with other study participants directly, anonymized first by the researcher, or not shared at all?
• Duration of Activity.Was this a one time activity or did it take place over time?
• Generative vs. Recall. Did the activity involve recalling past experiences or generating new artifacts or opinions?
• Tool. What tools were used to complete each activity?
• Media type.Was the activity text, drawing, photo, or voice based?
A1 - Diary
Kientz et al.’s study [25] of visually impaired people locating lost items is a good diary method example. Participants recorded a diary entry each time they lost an object. They were given the option of using a mobile application, calling a phone number to leave a voice mail, or sending the entry by email.
Inspired by this method, we asked participants to keep a diary for 24 hours of everyone they interacted with about their condition. The instructions were,
3 EAI Endorsed Transactions Health and TechnologyonPervasive
# Name Activity Sh. Duration G/R Tool Med.
A1 Diary
Participants tracked interactions they had with other people about their disease. They documented who they talked to, how they communicated, what they discussed, and how they felt about it.
D 24 hrs R C T
A2 Circles
Participants used household objects to illustrate how comfortable they were sharing information with different people by drawing circles with themselves at the center and placing people at different distances from the center.
D Once G O O
A3 Questions
Participants made a list of questions they wished their friends/family would ask them about their
disease. D Once R G T
A4 Problems
Participants ranked a list of problems (provided by
the researchers) by the relevance to them personally. D Once R G T
A5 Photo
Elicitation
Participants took photos representing two main themes from A4 and commented on each others’
photos. A 3 days R P P
A6 Solutions
From the problems in A4, participants discussed strategies or solutions they had used to address these
problems. D Once G G T
A7 Mad Lib
Participants created a mad lib, detailing the more humorous aspects of conversations they have
surrounding their conditions. D Once G G T
A8 MovieScript
Participants wrote a script for a movie about their life, taking place between them and a friend or family
member. D Once G G T
A9 Rant Line
We set up a “Rant Line”, a Google Voice number that participants could call, text, or send photos to anytime they needed or wanted to rant about something.
N 3 days R P O
A10 Personas
We created and posted two personas and asked participants to critique them and discuss how
representative they were of their own lives. D Once G G T
A11 Survey Participants completed a survey to debrief their
experiences in the study. N Once R W T
Table 1. Activitiesused in the study.
Shared (Sh.):D=Responses were sharedDirectly to the group. A=Responses were collectedby researchersandAnonymizedbefore
being shared withthe group. N=Responses wereNot shared withthe group.
Generative/Recall (G/R): R=Activity involvedRecalling or describing some past experience. G=Activity involvedGenerating
newmaterialin a creativeor abstracted way, based on their experiences.
Tool:C=Participant’s choice.G=FacebookGroup. P=Phone. W=Website. O=Other.
Media (Med.):T=Text. P=Photograph. O=Other.
4 EAI Endorsed Transactions Health and TechnologyonPervasive
For 24 hours, I’d like you to keep track of interactions you have with other people about your disease. Make a note of:
• who you talked to (could be people on Facebook, your friends or family, medical providers, etc.),
• how you talked to them (online, on the phone, in person, etc.)
• a brief description of what you talked about and how you felt about it.
After 24 hours is up, post your notes as a comment on this post (as much as you are comfortable).
Shared:Directly to the group. Duration:24 hours.
Generative/Recall:Recall.
Tool:Participant’s choice (not specified). Media:Text.
A2 - Circles
Moncur et al. [32] conducted a focus group with mothers where they asked participants to use Post-it notes to write down different types of information they gave out when their baby was in the hospital. They had participants organize these Post-it notes on a wall grouped by social network hierarchy layers [21].
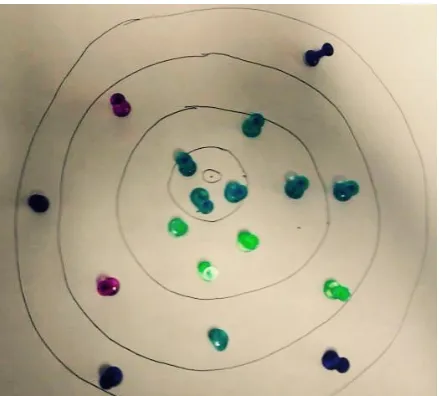
We adapted this method by asking participants to draw circles representing this social network hierarchy and use household objects to represent the information distance of various people from themselves (at the center of the circles). The instructions were,
Figure 1. Sample of A2 (CirclesActivity)
[ACTIVITY] For today’s activity, you’re going to need a paper and pen, and some small colourful objects - these could be buttons, paper clips, candies, whatever you’ve got lying around.
What I’d like you to do is draw some circles inside of some other circles. Imagine that you are in the center circle and that the people you know are represented by the small objects. Place these small objects in different layers of the circle based on how much information you think it would appropriate for them to receive about your condition or your health. You can use the small object to represent a specific individual or a type of individual.
I’m including an example here of one I did, imagining more of a social scenario than a health one since I don’t actually have a rare disease. Basically blue is friends, green is family, pink is professors or bosses, and purple is more distance acquaintances. Closest to the center are my three closest friends. The three closes green pins represent my three immediate family members. After that the pins start to represent groups of people (e.g. friends from Indiana, friends from back home, extended family in general, etc.).
Please post a picture of what you come up with to the group. You can label it or describe it in the comments.
Thanks!
The example we provided to participants is included here as Figure1.
Shared:Directly to the group. Duration:One time.
Generative/Recall:Generative.
Tool:Paper, pen/pencil, household objects. Media:Drawing, arranged objects.
A3 - Questions
Again building offwork by Moncur et al. [33], we asked participants to come up with questions they wished people would ask about their condition.
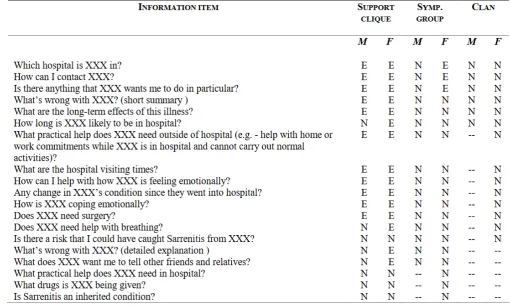
In [33], Moncur et al. were interested in under-standing the types of information people wanted to know about members of their social network hierarchy if they were hospitalized. The researchers distributed an online questionnaire asking participants to select a member of each level of their social network heirarchy. They provided participants with a scenario about that network member being hospitalized or falling ill. They also provided a list of information items (Figure 2)
5 EAI Endorsed Transactions Health and TechnologyonPervasive
and asked participants to rate how much they would or would not want/need this information within that scenario.
In our study, we were interested in the perspective of the person with the rare disease so we reframed this activity to ask about the information a participant would want someone else to know, rather than informa-tion they would want to know about someone else.
[ACTIVITY] Thanks to everyone who did the last activity! It sounds like there’s a difference between what you want people to know and what they want to know. I was reading a paper (you can find it here if you’re curious [copy of [33] provided]) where they tried to figure out how much information people wanted to know about someone else’s health. There’s a list of questions/scenarios that they use (picture below), but these are in a bit of a different context. I’m hoping that you can help me come up with a list of questions that would more relevant to having a rare disease. Essentially, what are things that you wish your friends/family would ask you? Post any questions you come up with in the comments.
The list of questions/scenarios (taken from [33]) that inspired this activity and were provided as an example to participants can be found in Figure 2. Additional explanation of this figure can be found in Moncur et al.’s original work [33].
Shared:Directly to the group. Duration:One time.
Generative/Recall:Recall. Tool:Facebook group. Media:Text.
A4 - Problems
In this activity, we synthesized our findings so far from posts and comments in this study as well as from our previous work [30]. We conducted preliminary analysis and synthesized findings into a list of 15 issues raised by participants and asked them to rank order these by importance as well as discuss the accuracy of the list. The instructions were,
[ACTIVITY] I’ve put together a list of all the problems I’ve seen in your comments. Please rank them in order of how much you agree that they are problems for you personally (most problematic at the top, not at all problematic at the bottom). And if there’s anything missing from the list, you can add it in too. Here’s the list in no particular order:
1. Practical, routine tasks
2. People not understanding 3. People not caring
4. People not believing me
5. People not following through with promises
6. People not remembering
7. Not being able to keep up with friends
8. People being negative towards me 9. Feeling isolated
10. Feeling abnormal
11. Doctors not knowing what the disease is 12. Doctors not believing me
13. Not enough research taking place
14. Ruining relationships 15. Financial support
Shared:Directly to the group. Duration:One time.
Generative/Recall:Recall. Tool:Facebook group. Media:Text.
A5 - Photo Elicitation
Le Dantec et al.’s [27] study made use of photo elicitation to capture perceptions of homeless people on technology. They met with participants three times over three weeks. In the first meeting, they provided participants with a disposable camera and instructions on what to document with the camera. These instructions were things like, “Take photos of places or situations where you needed help”or“Take photos of of [sic] the things you use: telephones, buses, radios, televisions.” In the second meeting, they collected the cameras. In the third and final meeting, they conducted an interview about the resulting images.
In our study, we asked participants to use their phone cameras to document certain themes (emerging from results of A4) and submit these photos to the researcher. We intended to post these to the group in one batch to avoid identifying who took which picture and preserve privacy. The instructions were,
[ACTIVITY] We went through your answers to the ranking question from a couple weeks ago, and I’m including the chart below so you can see what’s up. Each of the bars is one of the items from the list, and you can see that the 2nd and 3rd items (people not caring and people not understanding) are pretty consistently ranked as being important (they are more compact and have lower numbers).
6 EAI Endorsed Transactions Health and TechnologyonPervasive
Figure 2. Examplequestions/scenarios(A3)from[33]
Figure 3. Results of A4 providedas part of A5
7 EAI Endorsed Transactions Health and TechnologyonPervasive
For the next three days, I’d like you to take pictures that represent these ideas of caring and understanding. What do you want people to care about? what do you want people to understand? how do you try to accomplish this? what are the barriers? Save these pictures until the end of the three days, and then send them to me privately all at once (either via Facebook message or by email). Afterwards, I will put an album together for the group and there will be a follow up activity, so if there is anything sensitive that you don’t want the rest of the group to see, please let me know.
The chart we provided to participants showing the results of A4 is provided in Figure 3. Instead of follow up interviews, we asked participants to tag and comment on the photos. The instructions were,
Hi all, I’ve added the photos below that you submitted - if you didn’t submit any photos but are feeling inspired after seeing these, you can still send me some and I will add them !
Some of these have explanations of why they were submitted right on them, and others are less obvious. For each, photo I’d like you to come up with a few (say 3-5) keywords that you think describe how these relate to the theme (people not caring and people not understanding). You can add additional comments if you’d like.
Thanks!
Shared: Anonymized before being shared with the group.
Duration:3 days.
Generative/Recall:Recall. Tool:Camera phone. Media:Photograph.
A6 - Solutions
In A6, we asked participants to discuss possible solutions to the challenges outlined in A4.
[ACTIVITY] Think about your top two or three answers to my last post (the list of challenges) - what strategies do you use or try to use to address these? Which strategies have been the most successful or helpful?
Shared:Directly to the group. Duration:One time.
Generative/Recall:Generative. Tool:Facebook group.
Media:Text.
A7 - Mad Lib
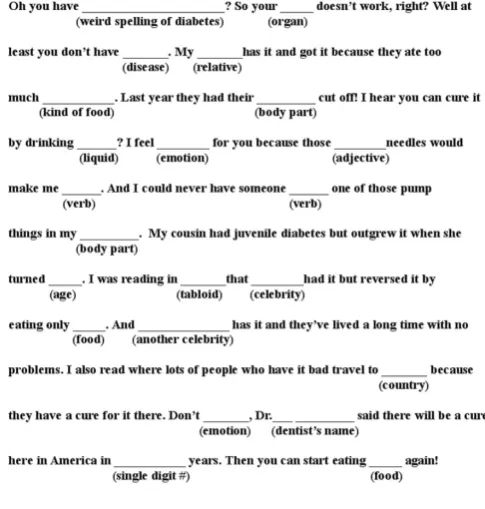
Inspired by Bauer et al.’s [4] use of “DesignLibs” (mad libs for design), we wanted to work with participants to construct scenarios (as in [11]) that described their experiences. We came across [39], which contained an amusing mad lib for people with diabetes that is "Written by People You’ve Met Who Don’t Understand Diabetes". Given that people not understanding was a recurring theme in the first part of this study, we asked participants to adapt this diabetes example to their own experiences with a rare disease. The instructions were,
[ACTIVITY] Someone sent me this link and I thought it was pretty funny. What would the mad lib for your condition look like?
The example madlib is provided in Figure4.
Shared:Directly to the group. Duration:One time.
Generative/Recall:Generative. Tool:Facebook group.
Media:Text.
Figure 4. Sample Mad Lib providedin A7
8 EAI Endorsed Transactions Health and TechnologyonPervasive
A8 - MovieScript
As an alternative approach to generate scenarios with participants, we framed this activity as the creation of a movie script. We asked participants to write a script from a scene from a movie about their life. The instructions were,
[ACTIVITY] Instead of photos, let’s try a writing exercise. Imagine you are a writing the script for a movie about your life. Write out a scene that takes place between you and a friend or family member (you can choose which one), keeping in mind the themes of caring/understanding. You have two options 1) Write a scene of how things ACTUALLY are, or 2) Write a scene of how you WISH things were, (or if you’re feeling ambitious, one of each!)
Shared:Directly to the group. Duration:One time.
Generative/Recall:Generative. Tool:Facebook group.
Media:Text.
A9 - Rant Line
Grimes et al. [19] introduced EatWell, a system allowing people to leave voice memories about their attempts at healthy eating, as well as listen to voice memories that others created. Palen et al. [34] similarly leverage voicemail as a way of conducing diary studies, discussing the advantages of this technique over other diary collection methods including time intensiveness, mobility, and richer descriptions.
In our study, we set up a Google Voice account to which participants could call in and leave messages like in [19,34]. We also gave participants the option of sending in text messages or photo messages. Our hope was that this would help them share their thoughts with us as they were happening or were relevant, rather than having to remember them later. The instructions were,
[ACTIVITY] For the next activity, I’ve set up a “Rant Line” - the number for it is [omitted] You can call it or send texts or photos anytime you feel like you need/want to rant about something. Keep that in mind for the rest of the week and over the weekend.
Shared:Not shared with the group. Duration:3 days.
Generative/Recall:Recall. Tool:Mobile phone. Media:Text, photo, voice.
A10 - Personas
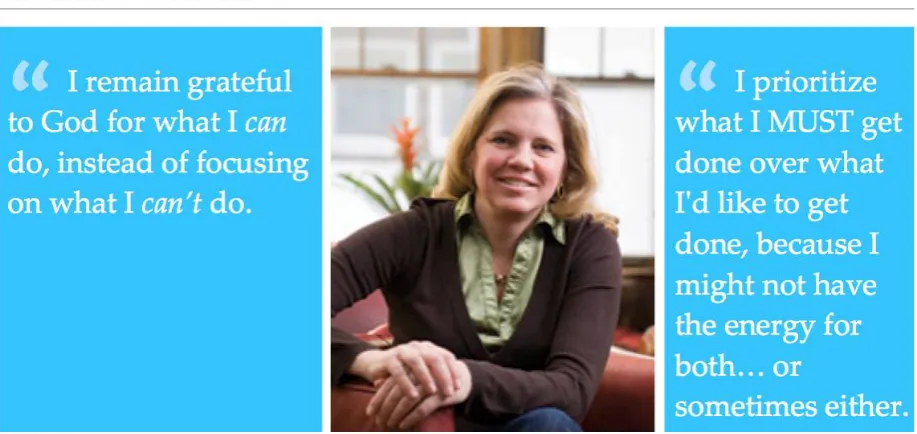
Cooper [13] advocated for personas as a tool to guide designers. Here, we use personas as a way of verifying and adjusting our understanding of the participants in our study. We prepared two personas, representing synthesized and abstracted versions of the participants in our studies. We presented these personas to the group for feedback. The instructions were,
[ACTIVITY] Second last activity! I’m adding pictures below of some personas, loosely based on your contributions to the group. Personas are tools designers use to help guide their ideas. Your job is to critique them: do these apply to you? what’s missing? what’s wrong? Bonus points if you want to submit or describer your own! (Blurb here on personas if interested: https://en.wikipedia.org/
wiki/Persona_%28user_experience%29)
(Also, the diseases below are completely fictional, just for the record)
Copies of these personas are provided in Figure5.
Shared:Directly to the group. Duration:One time.
Generative/Recall:Generative. Tool:Facebook group.
Media:Text.
A11 - Survey
Finally we asked participants to complete a survey. In our case, this was done to evaluate our methodological approach and understand participants’ experiences in the study. We include it in our discussion here because using a survey as part of an ARC study could also be done to gain different types or insights during a study, or to confirm findings with participants. The instructions were,
[ACTIVITY] Last activity! This one is pretty important, so I’m going to tag you all in it to be sure you see it :)
I need feedback from you about your experience in this group. Has it been fun or miserable? Easy or hard? Totally ridiculous? I want to hear about it!
Here’s a link quick survey with some specific questions I’d like you to answer: [omitted] The survey will be completely anonymous - I won’t be able to tell who said what unless you tell me. You can also comment here with your feedback if you want to discuss it with the group as a whole. I would also love it if as many
9 EAI Endorsed Transactions Health and TechnologyonPervasive
10 EAI Endorsed Transactions Health and TechnologyonPervasive
Figure 5. Personas providedin A10
11 EAI Endorsed Transactions Health and TechnologyonPervasive
of you as possible would be willing to do a short follow up interview, by phone or Skype/GoogleHangout/Facetime - whatever is easiest for you. If you’re willing to do this, please comment below or send me a message directly and we can set up a time.
Once the survey is done, I will post a message explaining what happens next on my end, what you can expect from me going forward, and what will happen to the group.
Shared:Not shared with the group. Duration:One time.
Generative/Recall:Recall. Tool:External website. Media:Text.
3.6. Analysisof ResearchMethod
We used data from a variety of sources to evaluate the effectiveness of our approach. Generally, we were looking for useful and honest responses, participation over time by different people, and that the activities be comfortable for participants. We collected,
• comments and posts from the study group,
• metadata such as timestamps, likes, and informa-tion about who had seen a comment or post,
• private Facebook messages and email threads we received from participants,
• survey responses (A11) from Typeform1,
• Material submitted by voicemail, text message, or photo message (A9) from Google Voice2, and
• summaries of relevant discussions that took place in Facebook groups we had used for recruitment.
Two researchers reviewed all qualitative data and iterated on codes until converging on an inter-rater reliability (Cohen’s Kappa) score of 0.78. We examined,
• conversational flow(relevance of each comment to the main post or where two versions of similar conversations co-occurred in multiple threads),
• comments about activities (positive or negative feedback about an activity or comments contex-tualizing participation, such as apologizing for delayed responses or expressing confusion), and
• life events influencing participation (such as a relative passing away, being hospitalized, having a job interview).
1http://www.typeform.com/ 2http://voice.google.com/
Throughout this paper, any quotes used were copied exactly from text posted by participants and researchers and are reproduced exactly as written.
We used Tableau3to visualize the Facebook metadata and responses to the closed-ended survey questions, as well as simple analytics to compare what participants actually did and what they said they did.
We conducted social network analysis to understand the strength of the relationships between participants and identify emerging sub-communities [20]. We counted interactions between participants (either a participant’s comment in response to another’s post/comment or a participant liking another’s post/comment). These counts determined the weights of the edges connecting the participant nodes. We used Gephi4to calculate the modularity (used for detecting clusters or communities in networks) and to visualize these relationships.
3.7. Analysisof Results
To analyze the results of this study (rather than analyzing the method itself) we used the comments and posts (texts and images) and voicemail, text messages, and photo messages submitted through Google Voice. In this case, three researchers reviewed all data and iterated on codes until converging on an inter-rater reliability (Cohen’s Kappa) score of 0.72. The study data is out of scope for this paper, which emphasizes the use of the ARC method.
3.8. Post-Study
At the end of the study, we left the Facebook group intact so participants could continue to connect with each other. We told them we would post updates about the research, but no further research would take place inside of the group. We informed participants that they could receive updates about the research by email if they opted to leave the group after the conclusion of the study. We continue to inform participants, as well as the Facebook groups we recruited from, about the status of our rare disease research. After the last official study activity, many participants remained in the group, although activity was extremely limited.
We provide participants with a draft copy of each paper we write emerging from research they partici-pated in to ensure they are comfortable with the con-tent. This mitigates misinterpreting or misrepresent-ing comments and ensures participants have final say over how their data is used. Rare disease communities present unique challenges from a privacy perspective because the diseases in question are extremely rare,
3http://www.tableau.com/ 4http://gephi.github.io/
thus it is easy to re-identify an individual using only a few pieces of demographic and contextual information. We provide only the minimum amount of information required to contextualize and understand our findings; we refer to participants with gender neutral pronouns and omit participant ID’s (P1, P2, etc.) from quotes because of the privacy risk this presents in a rare disease population. We acknowledge that this may not be necessary in most other populations.
4. Limitations
Our findings and reflections are influenced by our decision to conduct this study on Facebook. In a few activities, participants missed notifications or were not aware we had posted an activity. The mechanics of Facebook’s algorithms are unclear, so we are not confident in our assessment of why this happens or how to prevent it. Additionally, “seen by” tracks whether someone acknowledged a notification but not necessarily that they actually read the post. We use counts of how many participants have “seen” a notification as an extra measure but acknowledge that this cannot be fully relied upon to determine whether someone actually read the post.
Additionally, our lessons below are derived from our work with a population with unique characteristics. The topics discussed in the group were of critical importance to participants, and there are greater risks involved in studying this population than one might find in other contexts. However, we believe many of these lessons can be extended and applied in these other contexts.
5. Study Experience
Here we report on participant engagement in the group and how they interacted with each other and researchers. Specifically, we discuss lessons learned through our recruitment and informed consent process, the types of activities we used and participant responses to them, engagement and activity levels throughout the study, and our own reflections on conducting this study. We conclude with a discussion of the researchers’ perspectives on the experience.
5.1. Pre-Study Interactions
Recruitment. Most groups from which we recruited
were groups we had been a part of for over a year. One researcher initially joined these groups to recruit for past research and found members of these communities to be enthusiastic about our presence and eager to be involved in research. This researcher was known to group members and had built rapport by sharing results of previous research and contributing to the community in other ways (e.g., by helping to access
academic articles of interest located behind paywalls). In these groups, questions about the study were easily satisfied. If a group member had a question about the study, a different group member (usually a participant from a previous study) would jump to the researcher’s defense, vouching for the researcher’s legitimacy and expressing gratitude for ensuring their condition was represented in research projects.
Although we followed recommended practices for recruiting from online communities [7], we encoun-tered a few individuals with concerns, asking ques-tions about the goals of the research. In groups where the researcher was new, there was a lot of discussion about credentials, IRB approval, study procedures, and benefits/risks of participation. Some group members were disappointed to learn that the research would not lead to outcomes directly used by physicians to improve the treatment of their health condition; they viewed our presence in the group as an attempt to profit without providing anything in return. HCI research can be viewed by group members as less of a priority than medical research and as taking too long to produce meaningful and directly applicable results.
Lesson #1:We recommend taking the time to build a strong rapport with members of groups used for recruiting before, dur-ing, and after the study, following not only best practices for recruiting [7], but also good practices for maintaining those rela-tionships at the conclusion of the study [38].
Informed Consent. We distributed 53 consent documents
and 14 were returned. Many people who did not return the informed consent document (as well as some that did) struggled with the process of completing this document via printing, signing, and digitally sending it to the research team, despite not having communicated any concerns about the study itself to the research team. Some of these difficulties were technical (“I might need to do a screen shot if I can’t get the scanner to work, but is [tomorrow] okay?") and some were physical (“I will have to wait for my dad to get offof work so he can print is and scan it for me. Sorry for the inconvenience, but if you can bare with me, I am in! I need something to do and I want to help...can I just email you that I give you my permission?"). We were able to enroll an appropriate number of participants to ensure there were enough people to actively engage in discussions without being so large that participants could not reasonably get to know each other. However, we recognize that requiring a physical signature may have limited participants by physical and technological ability.
For in-person studies, participants are not always interested in taking time to read the informed consent sheet and would be happy to sign without reading.
13 EAI Endorsed Transactions Health and TechnologyonPervasive
As ethical researchers, it is our responsibility to talk through the information with participants to ensure they understand what they are consenting to. When conducting studies remotely, we do not have the same opportunity to make in-the-moment assessments of how much attention the participant has given to the document and how much s/he understood, but this does not makeinformedconsent any less critical [9].
Lesson #2: We recommend investigating alternative methods of consenting electroni-cally. One idea would be to seek consent via Facebook chat, mimicking how a researcher might walk through a paper consent form with a participant in person, pausing after each section for questions. Alternatively, require participants to pass a short quiz on the highlights of the consent document. Participants who do not pass the quiz should be contacted by a researcher to discuss the contents of the document and ensure their understanding.
5.2. Activities
Categories of Activities. We categorized activities by
how responses wereshared. For many of the activities, participants were instructed to post their contributions directly to the group. In A5, the submissions were sent to the researcher privately and then anonymized before being shared with the group. In A9 and A11 the submissions were made anonymously and directly to the researcher and were not shared with the group at all. We saw more likes and comments when participants posted directly to the group (µ= 11.13 comments/posts) than when they responded in an anonymous or semi-anonymous way (µ= 5.75 comments/posts). We speculate that seeing others contributions may help to remind participants to submit their own (by showing up in their news feed more often) or inspire participants who are unsure of what to submit.
We categorized activities by duration (completed in one sitting or over the course of several hours/days). There was more engagement in activities that took place over time (µ= 17 comments/posts) than for one-time activities (µ= 15.6 comments/posts). Comments on one-time activities were often confined to a single thread, whereas discussions on longer term activities took place over several threads, with participants adding their own new material as they came up with it. In both cases, participants continued to respond to each other even after the activity ended.
We also categorized activities by whether they required recalling personal information or generating new material. We saw more comments when partici-pants recalled information (µ= 18.2 comments/posts)
than when they had to be creative (µ= 10.2 com-ments/posts). When asked to recall information, they distributed their responses over several comments, and built off each others’ experiences. There was very lit-tle of this when activities were generative; they typ-ically only posted the results of their efforts and did not discuss each others’ contributions. One participant found this discouraging and stated (in reference to A8), “Iwanted to know what others thought of my script and was a bit hurt when I didn’t get any feedback”. In A5, part of the activity was to comment and discuss each others’ submissions, which did lead to more feedback.
Lesson #3: We recommend encouraging participants to build on each other’s creative contributions. This can be challenging on Facebook if participants are not observing each other as the work is being created, and may need to be encouraged explicitly.
Additionally, we reflect on the differences in tools used to complete activities. We saw that activities that only required the Facebook group to complete received more comments and likes (µ= 11.57 com-ments/posts) than activities requiring some other tool, such as a phone, website, or physical objects (µ= 6.50 comments/posts). In the case of A1, where participants had the choice of how they kept track of data, the results were somewhere in between (µ= 10.00 com-ments/posts).
Finally, we compare differences inmedia. We saw that activities requiring only textual responses had more activity (µ= 10.88 comments/posts) than activities requiring other media (µ= 6.67 comments/posts).
Activity Preferences. Participants eagerly volunteered
feedback about each activity, both throughout the study and in the debrief survey (A11). They looked favorably on most activities; almost all activities had a median rating of 6 on a 7-point scale (1 = “Hated it!”, 7 =
“Loved it!”). Participants really enjoyed the creative
aspect of certain activities (“It was fun to be able to engage my creative side" (A2)).
A1 (median= 5, modes= 4,5,6) and A8 (median=
5, mode= 5) were not as popular. Some participants described being confused by the creative activities:“I just couldn’t understand what was wanted, despite the examples”. They also seemed uninspired sometimes:“I really don’t understand what to do here, [Researcher’s Name]. I’m big on taking photos but I don’t get how I can take a photo of someone not caring or understanding” (A5). We posted abstract examples (as in Figure1) or sample responses from other domains (as in Figure 4) to help provide a sense of what a response could be without leading too much. We also provided clarification and answered a number of questions. Especially for A5 and A7, these examples and clarifications were insufficient,
14 EAI Endorsed Transactions Health and TechnologyonPervasive
as there was still a lot of questions. Instead, participants seemed to do better when they were following the lead of a fellow participant; in the case of A7, once one or two participants had posted mad libs, many others followed. In A5, participants submitted photos to the researcher rather than to the group, so participants did not get to see each other’s contributions until much later.
Lesson #4: We recommend having partici-pants post directly to the group, even work in progress. Seeing other participant’s con-tributions can give inspiration to people who are hesitant to contribute creatively.
Participants discussed how activities made them feel. After completing A1, one participant remarked,“Never spoke to a soul in person...Right now being homebound because of the illness, my life is pathetically limited.” Survey responses (A11) confirmed this sentiment:“I am homebound and have very few interactions with others. The activity pointed that out to me yet again."and “Just hit home how often I have to talk to the doctors and how often I don’t talk to other people in a day.” and “kind of overwhelms or can depress me as I rarely see actual people.”. This activity drew attention to negative aspects of life that were uncomfortable to reflect on.
Lesson #5: We advise exercising caution when selecting activities; conducting research asynchronously and online means researchers do not have the same chance to assess how a method is going as it is happening. By the time researchers are aware of discomfort, it may be too late to adjust the method.
5.3. Overall Engagement
Levels of Engagement. We observed four different levels
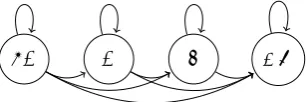
of engagement which we labeled Super Active (SA), Active (A), Lurking (L), and Dropped Out (DO) (Figure 6). Super Active meant commenting, liking, and posting frequently. Active participation meant contributing steadily, but not to the same volume as Super Active participants. Participants in a state of Active participation contributed mostly by commenting
SA A L DO
Figure 6. Transitionsthroughdi˙erentparticipationlevels..
rather than liking posts; they responded to posts by researchers but were less likely to initiate new discussions or engage in conversations with each other. Lurking meant seeing posts but not engaging with them in any way. Finally, Dropped Out meant the participant had actually left the group. Participants transitioned between these states. No participant became more active; some participants maintained a steady level of activity, while others became less active over the course of the study (examples provided in Figure7).
Engagement Over Time. We observed a burst of activity
in the first 3 weeks as participants got to know each other. There were an average of 16.1 comments per day during the first 3 weeks (σ = 14.0) but only 1.3 comments per day for the remainder of the study (σ = 3.4). Participation peaked on Saturdays and slowly decreased throughout the week until Friday (even though many participants were unemployed).
Lesson #6: We recommend taking time to understand potential participants’ Facebook behaviour to inform decisions about when and how often to post, as well as the overall study duration.
Participants typically responded within 24 hours of an activity being posted (Figure 8), unless the activity took place over several days (e.g. A9). When participants did not respond within 24 hours, this was a sign that something was wrong; sometimes they missed notifications about new activities (“sorry I didn’t see this pop up!"), had to take a break from the study (“I’m just back in [city] today after 10 days in [another city] I am catching up."), or forgot to do an activity they had seen (“I completely forgot about the rant line. But I sure could have used it this morning."). We tried four approaches to encouraging participation:
1. Reminding participants of activities. When posting a new activity, we reminded participants about the last activity. We saw a brief increase in responses after reminders.
2. Pinning the current activity.For the second part of A5 (sharing photos with the group and asking participants to comment), participants could not find the photos within the group. We pinned the album to the top of the group, and communicated this to participants. Pinning was an ineffective strategy because participants were still confused. 3. Tagging participants in posts. After seeing a
reminder, some participants asked for clarifica-tion on which activity the reminder referred to. We tagged participants who expressed confusion in the comment section of the relevant post. This was more effective than pinning posts to the top of the group because participants could easily click the notification.
15 EAI Endorsed Transactions Health and TechnologyonPervasive
Figure 7. Commenttimesthroughoutthe study withfourexamplesof levels of engagements.
Figure 8. Days until each participant’s firs commenton a post.
P1 and P4 are omittedbecause they spent the entire study Lurking or DroppedOut very early in the study (and never posted).
4. Commenting on posts. For activities where participants were uncharacteristically quiet, we commented on the post to provide clarification (in case of confusion) and to increase the likelihood the post would show up in their newsfeed (in case they had missed a notification). This strategy was effective; there was an increase in participation following the comment.
Despite these attempts to encourage participation, participants still mentioned in A11 that they were unaware of activities. It is challenging to work within the restrictions of Facebook to ensure posts are brought to a participant’s attention.
Lesson #7:Researchers should be prepared to adopt multiple approaches to ensure activities are seen.
We observed that several people revisited posts long after they had been posted initially or would do several activities at once (Figure 8). This is similar to findings from other diary studies showing that people will complete several tasks at once, often shortly before a meeting with a research team [36].
Lesson #8: We discourage having activities that build on one another where the sequence is important.
5.4. RelationshipsbetweenParticipants
Social vs. Activity Posts. Participants had mixed views
on posts by other participants not directly related to research. We allowed social conversations outside of research activities because we felt that socially connected participants would be more comfortable being honest and sharing their activity responses with the group. However, it was confusing to some participants when social threads were mixed in with specific research activities. Especially in the beginning of the study, this caused people to wonder if responses were “required” or not. One participant commented, “...it’s mostly been socializing at this point. I was going
16 EAI Endorsed Transactions Health and TechnologyonPervasive
to chime in when it got more research-oriented.”Another requested, “when you post a question in the group, can you do it as an admin or something? it is confusing ... and I don’t want to miss a serious question.”
Most participants enjoyed this aspect of the study; participants rated the social aspect of the study higher than any other activity (scale1−7,median= 7,mode=
7): “It was good getting to know others in the group. I really liked that most were so open and friendly.”. We note that the A11 survey would not have been completed by participants who Dropped Out; we suspect that the overwhelming amount of social activity by people of a different demographic may have been a factor contributing to their decision to leave the study.
A few participants expressed concerns about nega-tivity and found it depressing to hear others’ stories: “...I also found a lot of negativity and some members being trapped and/or defined by their disease so that put me off.” Yet they saw value in having a place to express them-selves:“...if others are like me, they don’t have unfettered ability to do that in our family...”. This social support is an opportunity we have to provide a real benefit to participants [18]. This is especially valuable in this particular population, for whom social support is not otherwise readily available [30].
Lesson #9:We recommend providing oppor-tunities for socialization between partici-pants that are separate from formal study activites. Although this may not appeal to everyone, it can help weed out participants who are not interested in this aspect of the study and would likely become frus-trated later if social conversations continue throughout the study.
Sub-Communities. Our modularity analysis showed
that, aside from two participants who were Lurking or Dropped Out for the entire study, there were two sub-communities in this study; one with two rare diseases and one with three rare diseases (Figure9). Participants with the same conditions were recruited from the same Facebook groups, so it is likely they had an existing familiarity with each other before beginning the study. This was especially true in the case of Super Active participants who, we observed, tend to be prominent figures in their other Facebook groups as well. It is also likely that participants related to people with the same disease better.
We did not observe clusters by other demographics, however age and gender appeared to be factors in determining activity levels. Both men enrolled in the study ultimately Dropped Out, and almost all of the younger women in our study (under 40) were Lurkers.
Figure 9. Participant sub-communitiesin the Facebookgroup.
We observedtwo clusters; one withthree diseases and one with twodiseases.
5.5. ResearcherPerspective
Moderating. An online group differs from an in-person
group in the weight and permanence of each post. In person, comments may be easily ignored if they are deemed irrelevant, uninteresting, or rude. Some others may simply not hear the comment in the first place. Online, each comment is given equal weight in the conversation. At first, this might indicate that a participant who is normally soft spoken and easily dismissed could contribute more to a conversation happening online than in person. In reality however, we found that conversations became dominated not by the weight of a particular post but by the volume of posts from certain participants (the Super Active participants). It was easy to forget about Lurker participants. Several participants rarely contributed — one participant did not contribute the entire study, despite remaining in the group the whole time.
Inappropriate comments are easily written off in-person, but linger online. Removing a post or deleting a comment is a much more deliberate action than redirecting an in-person conversation. We deleted one post where a participant explicitly asked the group to donate money towards medical and living expenses. We removed the post and contacted the participant to politely explain our concerns. S/he seemed understanding, stating “i understand.Life just sucks right now and I nee all the help I can get. My apologies.", but dropped out of the group shortly after.
Although the majority of the posting in the group was done by one researcher (to make things easier for participants and to build rapport), there were four researchers in the group who could be alert and quickly address a problem should one arise. We considered using a secondary Facebook account to maintain boundaries between research and social uses of Facebook, but ultimately chose to use our personal
17 EAI Endorsed Transactions Health and TechnologyonPervasive
Facebook accounts partly to ensure that we were notified of new posts (and could intervene quickly). We also wanted to engender trust with participants; we felt moderators should be portrayed as themselves [10] and not as a group account for the whole team, as if an occult hand were conducting the study. The researcher who communicated most directly with participants had been using her personal Facebook account for well over a year to build rapport in rare disease groups.
Data Analysis. One of the benefits of conducting this
study on Facebook was the amount of data available at the end of the study. The challenge was the overhead involved in compiling it all, especially as the data came from a number of different sources. We were not aware of any tools that met our needs for exporting all of the data we needed in a form useful for analysis. We resorted to a lot of manual gathering and coding; in a longer study or larger group it would be worth further investigating methods of doing this automatically. The time spent managing this data was substantial. However, in this case, the benefits of using a well-established social networking platform that participants were already familiar with outweighed the time required to collect this data.
Lesson #10: We recommend being mindful of the number of input mechanisms (e.g., Google Voice, email, survey platforms, etc.). Structuring activities to capture data from a range of different sources adds to the richness of the data but means data will be distributed in different locations and need to be collected and organized. More input mechanisms means more overhead.
6. Future Directions
This is a first step in understanding how group-based research can be conducted using a common social platform like Facebook. However, there were several aspects of this method which could not be explored here and warrant follow up. First, the order of activities could impact participation, especially as participation in longer studies tends to decline over time [17, 24]. Using a different order of activities would illustrate how participants react to different types of activities, regardless of when they appear in a study.
The nature of this population made it impossible to perform an person study to compare between in-person and remote methodologies. It is possible that participants would have felt just as distressed when some of the activities made them think about the limitations of their social life in an in-person study, or it is possible that the remote nature gave them more time to reflect and think. Having laid the groundwork for how to conduct a study on Facebook, a future
study could compare local and remote methods within a single population.
Finally, our study focused on needs and design direc-tions. Further work could study other parts of the design cycle, including adapting existing design and evaluation techniques. This can enable our commu-nity to reach populations that are geographically dis-tributed, and thus under-represented in the technology design literature.
Acknowledgement. We gratefully acknowledge CLEAR
Health Information’s support of the RARE project. We also thank Kim Oakes for her help in moderating the study, Prianka Rayamajhi and Shruti Meshram for their help with analysis, and Rion Brattig Correia for his guidance on social network analysis.
References
[1] Adler, A., Gujar, A., Harrison, B.L., O’Hara, K. and Sellen, A.(1998) A diary study of work-related reading: Design implications for digital reading devices. InCHI ’98(ACM): 241–248. doi:10.1145/274644.274679. [2] Alaszewski, A. (2006)Using Diaries for Social Research
(Sage Publications).
[3] Babbie, E. (1990) Survey Research Methods (Wadsworth Publishing).
[4] Bauer, J.S. and Kientz, J.A. (2013) Designlibs: A scenario-based design method for ideation. InCHI ’13: 1955–1958. doi:10.1145/2470654.2466258.
[5] Brown, B.A.,Sellen, A.andO’Hara, K.(2000) A diary study of information capture in working life. InCHI ’00 (ACM): 438–445. doi:10.1145/332040.332472.
[6] Brown, J.B.(1999) The use of focus groups in clinical research. InCrabtree, B.F.andMiller, W.L.[eds.]Doing
Qualitative Research(Sage Publications).
[7] Bruckman, A. (2012) Interviewing members of online communities: a practical guide to recruiting partici-pants. InResearch Methods for Studying Groups and Teams: A Guide to Approaches, Tools, and Technologies(Routlege). [8] Buchwald, D., Schantz-Laursen, B. and Delmar, C. (2009) Video diary data collection in research with children: An alternative method.IJQM8(1): 12–20. [9] Bull, S.(2011) Ethical issues in technology-based health
promotion. InTechnology-Based Health Promotion(Sage Publications), 35–56.
[10] Bull, S. (2011) A primer on technology-based health promotion. InTechnology-Based Health Promotion(Sage Publications), 2–34.
[11] Carroll, J.M. (1995) Scenario-based design: envisioning
work and technology in system development(John Wiley & Sons).
[12] Carter, S.andMankoff, J.(2005) When participants do the capturing: The role of media in diary studies. InCHI ’05(ACM): 899–908. doi:10.1145/1054972.1055098. [13] Cooper, A.(2004)The Inmates are Running the Asylum:
Why High-Tech Products Drive Us Crazy and How to Restore the Sanity(SAMS).
[14] Dimond, J.P., Fiesler, C., DiSalvo, B., Pelc, J. and Bruckman, A.S. (2012) Qualitative data collection
18 EAI Endorsed Transactions Health and TechnologyonPervasive
technologies: A comparison of instant messaging, email, and phone. In GROUP ’12 (ACM): 277–280. doi:10.1145/2389176.2389218.
[15] Feng, J., Lazar, J., Kumin, L. and Ozok, A. (2008) Computer usage and computer-related behavior of young individuals with down syndrom. InAssets ’08: 35– 42. doi:10.1145/1414471.1414480.
[16] Forghani, A. andNeustaeder, C. (2014) The routines and needs of grandparents and parents for grandparent-grandchild conversations over distance. In CHI ’14 (ACM): 4177–4186. doi:10.1145/2556288.2557255. [17] Foss, E., Druin, A. andGuha, M.L. (2013) Recruiting
and retaining young participants: Strategies from five years of field research. In IDC ’13 (ACM): 313–316. doi:10.1145/2485760.2485798.
[18] Giorgio, G. (2013) Trust. listeening. reflection. voice: Healing traumas through qualitative research. In Qualitative Research: A Reader in Philosophy, Core Concepts, and Practice(Peter Lang), 459–475.
[19] Grimes, A.,Bednar, M.,Bolter, J.D.andGrinter, R.E. (2008) Eatwell: sharing nutrition-related memories in a low-income community. In CHI ’08 (ACM): 87–96. doi:10.1145/1460563.1460579.
[20] Hansen, D.L. and Smith, M.A. (2014) Social network analysis in hci. InKellog, W.A.andOlson, J.A.[eds.]
Ways of Knowing in HCI(Springer), 421–448.
[21] Hill, R. and Dunbar, R. (2002) Social network size in humans. Human Nature 14(1): 53–72. doi:10.1007/s12110-003-1016-y.
[22] Hillman, S.,Forghani, A.,Pang, C.,Neustaeder, C.and Judge, T.K. (2015) Conducting interviews with remote participants. In Studying and Designing Technology for
Domestic Life(Morgan Kaufmann), 11–53.
[23] Hufford, M., Stone, A., Shiffman, S., Schwartz, J. and Broderick, J. (2002) Paper vs. electronic diaries: Compliance and subject evaluations. Applied Clinical Trials: 38–43.
[24] Jay, T.andFraser, D.S.(2008) The role of a cohort in the design and evaluation of pervasive systems. InDIS ’08 (ACM): 31–39.
[25] Kientz, J.A.,Patel, S.,Tyebkhan, A.Z.,Gane, B.,Wiley, J.andAbowd, G.D.(2006) Where’s my stuff? design and evaluation of a mobile system for locating lost items for the visually impaired. InAssets ’06(ACM): 103–110. doi:10.1145/1168987.1169006.
[26] Lazar, J.,Feng, J.H.andHochheiser, H.(2010)Research
Methods in HCI(Wiley).
[27] Le Dantec, C.A. and Edwards, W.K. (2008) Designs on dignity: perceptions of technology among the homeless. In CHI ’08 (ACM): 627–636. doi:10.1145/1357054.1357155.
[28] MacLeod, H., Jelen, B., Prabhakar, A., Oehlberg, L., Siek, K. and Connelly, K. (2016) Asynchronous remote communities (arc) for researching distributed populations. InProceedings of the Conference on Pervasive Computing Technologies for Healthcare (PervasiveHealth
2016).
[29] MacLeod, H., Jelen, B., Prabhakar, A., Oehlberg, L., Siek, K.andConnelly, K.(2016) Lessons learned from conducting group-based research on facebook. In CHI EA ’16.
[30] MacLeod, H., Oakes, K., Geisler, D., Connelly, K. and Siek, K. (2015) Rare world: Towards technology for rare diseases. In CHI ’15 (ACM): 1145–1154. doi:10.1145/2702123.2702494.
[31] MacLeod, H., Yang, S., Oakes, K., Connelly, K. and Natarajan, S. (2016) Identifying rare diseases from behavioural data: A machine learning approach. In First IEEE Conference on Connected Health: Applications, Systems and Engineering Technologies (CHASE 2016). [32] Moncur, W., Masthoff, J., Reiter, E., Freer,
Y. and Nguyen, H. (2014) Providing adaptive health updates across the personal social network.
Human-Computer Interaction 29(3): 256–309.
doi:10.1080/07370024.2013.819218.
[33] Moncur, W., Reiter, E.,Masthoff, J.andCarmichael, A.(2010) Modelling the socially intelligent communica-tion of health informacommunica-tion to a patient’s personal social network. IEEE Trans. Inf. Technol. Biomed. 14(2): 319– 325. doi:10.1109/TITB.2009.2035361.
[34] Palen, L. and Salzman, M. (2002) Voice-mail diary studies for naturalistic data capture under mobile conditions. In CSCW ’02 (ACM): 87–95. doi:10.1145/587078.587092.
[35] Stewart, K. and Williams, M. (2005) Researching online populations: the use of online focus groups for social research. Qualitative Research 5(4): 395–416. doi:10.1177/1468794105056916.
[36] Stone, A.A., Shiffman, S., Schwartz, J.E., Broderick, J.E.andHufford, M.R.(2003) Patient compliance with paper and electronic diaries.Control. Clin. Trials24(2): 182–199.
[37] Sweet, C. (2001) Designing and conducting virtual focus groups. Qual. Market Res. Int. J. 4(3): 130–135. doi:10.1108/13522750110393035.
[38] Unerti, K.M., Schaefbauer, C.L., Campbell, T.R., Senteio, C., Siek, K.A., Bakken, S. and Veinot, T.C.(2015) Integrating community-based participatory research and informatics approahces to improve the engagement and health of underserved populations.
JAMIAdoi:http://dx.doi.org/10.1093/jamia/ocv094.
[39] Vieira, G. (2013) Diabetes mad lib. URL http://www.diabetesdaily.com/blog/2013/05/ diabetes-mad-lib/.
[40] Voida, A.,Mynatt, E.D.,Erickson, T.andKellog, W.A. (2004) Interviewing over instant messaging. InCHI ’04 EA(ACM): 1344–1347. doi:10.1145/985921.986060. [41] Young, R.M.andBarnard, P.(1987) The use of scenarios
in human-computer interaction research: turbocharging the tortoise of cumulative science. In CHI ’87(ACM): 291–296. doi:10.1145/29933.275645.
19 EAI Endorsed Transactions Health and TechnologyonPervasive