A Trace-Driven Analysis of Wireless Group
Communication Mechanisms
Surendar Chandra
1,∗, Xuwen Yu
21FX Palo Alto Laboratory, Palo Alto, CA 94304, USA,[email protected] 2VMware Inc., Palo Alto, CA 94304, USA,[email protected]
Abstract
Wireless access is increasingly ubiquitous while mobile devices that use them are resource rich. These trends allow wireless users to collaborate with each other. We investigate various group communication paradigms that underly collaboration applications. We synthesize durations when members collaborate using wireless device availability traces. Wireless users operate from a variety of locations. Hence, we analyzed the behavior of wireless users in universities, corporations, conference venues, and city-wide hotspots. We show that the availability durations are longer in corporations followed by university and then in hotspots. The number of simultaneously available wireless users is small in all the scenarios. The session lengths are becoming smaller while the durations between sessions are becoming larger. We observed user churn in all the scenarios. We show that synchronous mechanisms require less effort to maintain update synchronicity among the group members. However, distributed mechanisms require a large number of replicas in order to propagate updates among the users. For asynchronous mechanisms, we show that pull-based mechanisms naturally randomize the times when updates are propagated and thus achieve better performance than push based mechanisms. We develop an adaptive approach that customizes the update frequency using the last session duration and show that this mechanism exhibits good performance when the required update frequency intervals are large. We also show that for a given number of gossips, it is preferable to propagate updates to all available nodes rather than increasing the frequency while correspondingly reducing the number of nodes to propagate updates. We develop a middleware to illustrate the practicality of our approach.
Keywords: Wireless LAN, group communication mechanisms
Received on 07 October 2011; accepted on 16 February 2012; published on 03 August 2012
Copyright © 2012 Surendar Chandra and Xuwen Yu, licensed to ICST. This is an open access article distributed under the terms of the Creative Commons Attribution license (http://creativecommons.org/licenses/by/3.0/), which permits unlimited use, distribution and reproduction in any medium so long as the original work is properly cited.
doi:10.4108/mca.2012.07-09.e5
1. Introduction
Wireless laptops are replacing desktops as the primary computing platform for many users. In an article published in 2006, USA today [1] described the emergence of about 30 million nomadic users in the US. Gartner Dataquest predicted a yearly growth of 10% of these users. Recently, global sales of laptops exceeded that of desktops [2]. On our university campus, between 2005 and 2008, the number of active wireless devices rose from 5,027 to 13,051 while the number of wired student desktops dropped from 7,035 to 1,323. Similar trends were observed at other universities [3].
∗
Corresponding author. Email:[email protected]
Contemporary laptops are resource rich while high speed cellular and wireless LAN networks are ubiqui-tous. BuddeComm [4] estimated a global deployment of over 200,000 wireless hotspots. These hardware and network trends allow laptops to support collabora-tions in which groups of users modify shared objects. Synchronous approaches support simultaneous modi-fications by the group members, while asynchronous approaches eventually propagate updates to all partic-ipants. Each of these approaches can be implemented using a centralized or a distributed approach.
behavior of wireless users from wired users could necessitate a redesign of existing collaboration systems. Capturing such an update trace is difficult; collabora-tion applicacollabora-tions may need to be instrumented in order to collect their usage statistics. A large scale deployment of modified applications is hard. Hence, we synthesize the duration when group members collaborate using information about when the users were online.
There are further complications in deciding when group members were online. Typical wireless LAN users exchange security credentials and associate with an access point (AP), acquire a DHCP address and other network resources and finally authenticate themselves with the system. Also, the collaboration system might be implemented as an application. Hence, users cannot be considered to be available until the user explicitly starts the necessary programs. Finally, these applications might allow the user to control when collaboration functionality was desirable. The trace collection mechanism should reflect the durations when the user is actually able to run and interested in the collaboration mechanisms.
Also, unlike desktop users [5], wireless users are mobile and work from many different locations [1,6]: home, office and public venues. Ideally, we need to simultaneously monitor all wireless locations (schools, offices, hotspots etc.) in a geographic locale (city) in order to evaluate the system from the perspective of a mobile user who operates in these locales. However, such an analysis requires monitoring multiple administrative domains; currently unavailable to us and many researchers. An intrusive alternative is to install loggers in each monitored laptop.
In this paper, we analyzed the behavior of wireless users in different communities: university, corporate lab, conference venue and in a city-wide hotspot federation at different times and locations (spanning 2001 through 2008 at several locations in North America). We used publicly available traces from the CRAWDAD [7] archive. We also collected application level traces at a university. We compare the different traces from the perspective of group communication systems that might be utilized by these wireless users.
In all these traces, wireless LAN access was free. Hence, we assume that users exclusively used wireless LAN networks for collaboration (and did not also use a cellular network). Prior work [3,8,9] observed significant local wireless traffic within an university. An article in the Economist [10] highlighted attempts to encourage more interaction among hotspot users and suggests that the nomadic users themselves are supportive of such efforts because of common purpose, lending further credence to our assumption.
We show that the durations that users were online decreased while the durations between sessions increased. The unavailable durations were longer for
hotspots as compared to the university users. The system was dynamic with constant churn.
The observed availability behavior leads to poor per-formance regardless of the update propagation policy. Synchronous mechanisms encounter few group mem-bers who will simultaneously modify the shared con-tents. Distributed approaches require as many as 150 replicas in order to achieve acceptable update availabil-ity in the hotspot scenario. In general, asynchronous approaches are preferable for disconnected access. For small group sizes, server mediated approaches achieve better performance although for large groups, a distributed approach out-performed a server based approach. In general, a pull based approach leverages the randomness of group availability to achieve better performance than push based schemes. We showed that the immediate past session duration of an user was suf-ficient to predict the current session duration. However, systems that required frequent update propagations did not benefit from history based prediction as much as systems that propagated updates less frequently. Our approach is practical; we used the policies developed to propagate updates in our moderated collaboration system calledflockfs[11,12]. We incorporate the lessons learnt into our Yenta middleware.
Section 2 analyzes the various availability traces. We investigate several synchronous and asynchronous group communications using these traces in Sections3
and4, respectively. We describe related work in Section
5with concluding remarks in Section6.
2. Wireless user availability analysis
Analysis of group communications depends on know-ing when users create updates. One way to collect this information is to instrument and widely deploy several applications that follow the different group communication paradigms. Instead, we synthesize the durations when users update contents by extrapolating from durations when users were available.
2.1. Wireless traces analyzed
We used publicly available access traces collected from a corporate research lab, a conference and a city-wide hotspot federation. We also collected application level wireless user availability traces from an university.
were recorded using unreliable UDP datagrams; many of the trace datagrams were apparently lost (confirmed through private email correspondence). Our analysis of the syslog entries from the Dartmouth Aruba routers [14] (after removing extraneous association messages -we modified the syslog_parser script [15] to consider ’update station bssid to’ records for AP associations) showed that there were 428,703 events with matching associationanddisassociationrecords. We also observed 5,966,261associationevents without the corresponding
disassociation records (from the same access point)
as well as 428,703 disassociation records without the correspondingassociation records. Hence, these syslog traces were not suitable for our study. Older SNMP logs were analyzed in [3,16]. We collected newer application level user availability information from our university.
On our campus, wireless networks are ubiquitous and deployed throughout the campus and the dormitories. The system used over 1,300 access points. We collected user availability traces using the Zeroconf protocol [17]. Users running Apple Mac OSX and Linux (with Avahi) reported when they became online (after successful association with an AP, acquiring an IP address and user authentication) and offline using the Zeroconf _workstation._tcp service. However, Zeroconf does not capture handover events across multiple access points within the same subnet. Users running the Apple iTunes client (on Microsoft Windows and Apple Mac OSX) report their availability using the _dacp._tcp service. Also, users who ran iTunes used the_daap._tcp service to advertise when the user explicitly consented to sharing their contents with other iTunes users. iTunes did not impose a tit-for-tat mechanism to fairly share contents; users are allowed to consume shared objects from other users while not sharing any objects on their own. Voida et al. [18] suggested that users share contents to express their individuality. Overall, the workstation reflects the user availability for asynchronous group communication systems, dacp highlights the potential availability for collaboration applications and daap shows the time that the user actually participated in iTunes like collaboration. iTunes only allows read-only sharing of objects and does not represent our target group collaboration systems. Regardless, these traces allow us to investigate the complexity of user availability.
Logistically, Zeroconf pushed the service availability information to the monitoring client using link local multicast. Since these packets are not routed, we required the service collection station to be co-located inside the monitored VLAN. We reconfigured the entire campus wireless network to use a single VLAN and placed our monitoring station on this wired distribution network of the wireless infrastructure. We used appropriate firewalls on the APs to prevent other types of network traffic from overwhelming the wireless
networks. Without these filters, all broadcast packets will be sent to all the 1,300 APs. We collected the data for eleven days from Sep. 19, 2006 through Sep. 29, 2006 (our campus had 800 APs in 2006). We also collected the data from Dec. 3, 2007 through Aug. 25, 2008. This period included the end of Fall ’07 semester, winter break, Spring ’08 semester, spring break and Summer ’08 sessions. We place particular importance on the two weeks starting at 12/04/2007 (when users were likely to be collaboratively working on course projects, though not necessarily using any of the mechanisms explored in this paper) as well as on 60 days starting from 12/04/2007 (includes the busy end of semester season, calm winter break and the beginning of a new semester). Throughout this paper, we refer to these traces as workstation-2006, itunes-2006, share-2006, workstation-2008, itunes-2008
and share-2008. Note that the network administrators
progressively removed groups of access points into their own (unmonitored) VLANs during the beginning of Spring ’08 semester, spring break ’08 and Summer ’08, reducing the number of simultaneously available users. Our analysis of each segment showed that the user behavior was similar across all the time periods; albeit with fewer monitored users. Overall, the total number of users monitored inworkstation-2006,
itunes-2006, share-2006, workstation-2008, itunes-2008 and
share-2008 was 2,036, 4,893, 1,702, 4,063, 3,745 and
2,391, respectively. The number of wireless devices was greater in 2008, although the number of iTunes users decreased from their 2006 levels. On the other hand, as compared to 34.78% of the iTunes users sharing their song collection in 2006, over 63.85% of iTunes users shared their songs in 2008.
Corporation. Balazinska et al. [19] collected user availability traces at IBM Research from Jul. 22, 2002 through Aug. 17, 2002. Although these traces were collected before wireless networks were ubiquitous to the broader community, wireless laptops were already in widespread use among corporate users. These traces also remain the only publicly available trace of wireless users in a corporate setting. During the data collection period, IBM used 177 APs spread across three buildings (one of which was reportedly ten miles from the other buildings). For their traces, they issued SNMP probes ranging from every 5 (55% of the traces) to up to 15 minute intervals. The probe duration affects the resolution of the user availability intervals. During the trace collection, they observed 1,366 wireless devices. They published their analysis of user and access point network load distribution in Mobisys 2003 [20]. We refer to these access traces ascorporate-2002.
Many computer science conferences install their own wireless APs to provide wireless acces in the conference halls. Lately, the trend has been to utilize the wire-less infrastructure available at the conference venue itself and provide free coverage to the participants throughout the conference venue: halls as well as the guest rooms. We have been unsuccessful in convincing these hotels to allow us to monitor the behavior of conference participants. One publicly available trace that contains user availability information was collected by Balachandran et al. [21] at the SIGCOMM 2001 con-ference (hosted at the UCSD campus). The traces were collected over two and a half days. Wireless coverage was provided using four access points in a single hall. The traces contain 195 distinct devices. The authors focused on the wireless traffic created by these users and presented their analysis in Sigmetrics 2002 [22]. We refer to these traces assigcomm-2001.
Note that the wireless trace from the SIGCOMM 2008 conference [23] is not useful for our study due to data corruption, as much of the syslog traces except for 82 minutes on the last day were lost. Those traces did not reliably capture a disassociation event, making it hard to know the session durations. Additionally, the traces only captured users who voluntarily connected to a special IEEE 802.11a AP.
Hotspot. Finally, we analyzed the availability traces from a hotspot federation. ˆile Sans Fil (http://www. ilesansfil.org/welcome/) provides free coverage throughout Montreal, Canada using 206 hotspots; owners of public venues share their wireless networks that are then administered by ˆile Sans Fil. Lenczner et al. [24] released access traces for the three years from Aug. 28, 2004 through Aug. 28, 2007. These traces were collected when users authenticate themselves to any of the hotspots controlled by ˆile Sans Fil. The trace contained records of 69,689 wireless users. We place particular importance on the most recent two weeks (starting from 08/01/2007) for our analysis. We call these access traceshotspot-2007.
2.2. Number of simultaneously available users
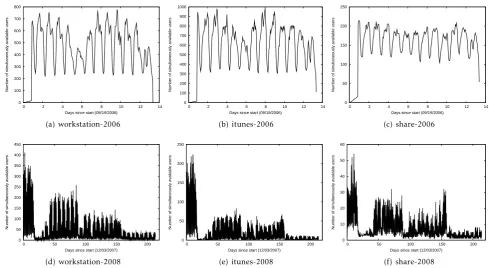
First, we plot the number of simultaneously available users as a function of the time of day for the various traces in Figs. 1 and 2. When the number of simultaneously available users is high, synchronous mechanisms incur high overhead in propagating and maintaining updates from all the online members.
We note that users in all the traces exhibit a diurnal variation. Even corporate desktops which are stationary [5] exhibited some diurnal variations.
First we consider the behavior of users in academia. Fig.1(d)and1(a)plots the analysis ofworkstation-2008 andworkstation-2006traces, respectively. The first two weeks starting on 12/04/2007 ofworkstation-2008were
the weeks before final exams of the Fall 2007 semester. Many users were likely to be available working on their final projects. Hence, we pay particular attention to the first fifteen days of workstation-2008. Overall, we observed 2,036 new devices inworkstation-2006, while in the first fifteen days ofworkstation-2008, we observed 2,729 new devices. In December 2007, we observed that the number of simultaneously available users reached a high of 410 users (15% of users) with a diurnal low of two users late on a Sunday night. Note that wireless access is ubiquitous on our campus and many of our students live in the dormitories that were monitored in this study. By comparison, fromworkstation-2006we detected as many as 775 users during the day times (38% of the population). Even during late night hours, we observed over 200 simultaneously available users. Note that we do not know whether a wireless device was a laptop or a desktop (desktops are likely to be left online even when the user is not actively using them).
Similarly, we analyzed the application level avail-ability ofitunes-2008anditunes-2006in Figs.1(b)and
1(e), respectively. Overall, we observed 2,617 users in the first fifteen days ofitunes-2006and 4,893 users in itunes-2008. The number of simultaneously available iTunes users reached 224 (8.5%) in itunes-2008 and 989 (20.1%) in itunes-2006. This drop in popularity is attributable to the drop in the session durations (Section2.3). We also analyzed the scenario where users control the sharing duration forshare-2008and share-2006 in Figs. 1(c) and 1(f), respectively. Of the 1,702 unique users fromshare-2006, we observed between 100 and 250 users (6%-15%) were simultaneously available. For the first fifteen days of share-2008, we observed between 10 and 54 users (from a total of 2,391 users or 0.4%-2.3%). The number of users who were willing to simultaneously share their iTunes collection dropped significantly between 2006 and 2008 even though the number of unique users sharing their contents had increased. User availability is complex and depends on the mechanism used for collecting the traces. Lower level mechanisms over-estimate the number of users that were willing to share their contents through iTunes. We expand on this observation in Section2.3.
0 100 200 300 400 500 600 700 800
0 2 4 6 8 10 12 14
Number of simultaneously available users
Days since start (09/19/2006)
(a) workstation-2006
0 100 200 300 400 500 600 700 800 900 1000
0 2 4 6 8 10 12 14
Number of simultaneously available users
Days since start (09/19/2006)
(b) itunes-2006
0 50 100 150 200 250
0 2 4 6 8 10 12 14
Number of simultaneously available users
Days since start (09/19/2006)
(c) share-2006
0 50 100 150 200 250 300 350 400 450
0 50 100 150 200
Number of simultaneously available users
Days since start (12/03/2007)
(d) workstation-2008
0 50 100 150 200 250
0 50 100 150 200
Number of simultaneously available users
Days since start (12/03/2007)
(e) itunes-2008
0 10 20 30 40 50 60
0 50 100 150 200
Number of simultaneously available users
Days since start (12/03/2007)
(f) share-2008
Figure 1. Number of simultaneously available campus users (academia)
during night times when the conference participants were likely to be unavailable, we still observed over 20 devices that were associated with the AP. Perhaps, these conference attendees were collaborating with colleagues in their home institutions located in a different time zone.
Hotspot-2007traces span over three years with 70,000 users observed during the entire duration. In Fig.
2(c), we observed a steady increase in the number of simultaneously available users. During a two week duration starting in 8/1/2007 (Fig. 2(d)), we observed 2,725 unique devices; about 120 of them (4.4%) were simultaneously available during the day.
2.3. Session duration
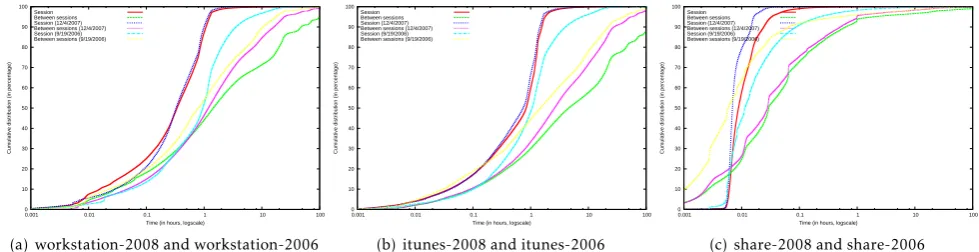
We analyzed the session characteristics and plot the amount of time that a user was available and the time between sessions for the various traces in Figs.3and4.
First, we plot the session behavior for the
workstation-2008 and workstation-2006 traces in Fig. 3(a). We
also plot the values for the two weeks starting in 12/04/2007. We note that the session durations in workstation-2008traces were short; 50% of the sessions were under 20 minutes and 95% of the sessions were less than 75 minutes. Focusing our attention on the two weeks after 12/04/2007, we note that 50% of the sessions were under 20 minutes and 95% of the sessions were less than 70 minutes. Sessions from workstation-2006 were longer; 50% of the sessions were under
one hour with 95% of the sessions were under 6.7 hours. The durations between sessions had increased
from workstation-2006 to workstation-2008. For the
workstation-2008 trace, 50% of the durations between
user sessions were less than 1.4 hours while 29% were longer than ten hours. Specifically focusing on the first two weeks in December 2007, these values were 1.2 hours for the median and 15% of the durations were longer than ten hours. On the other hand, workstation-2006 showed that 50% of the durations between sessions was less than 47 minutes while 10.5% of the durations between sessions was larger than ten hours.
0 100 200 300 400 500 600
0 5 10 15 20 25 30
Number of simultaneously available users
Days since start (07/20/2002)
(a) corporate-2002
0 20 40 60 80 100 120
0 0.5 1 1.5 2 2.5 3
Number of simultaneously available users
Days since start (08/29/2001)
(b) sigcomm-2001
0 20 40 60 80 100 120 140
0 200 400 600 800 1000
Number of simultaneously available users
Days since start (08/28/2004)
(c) hotspot-2007
0 20 40 60 80 100 120
0 2 4 6 8 10 12 14
Number of simultaneously available users
Days since start (08/01/2007)
(d) hotspot-2007 (two weeks from 08/01/2007)
Figure 2. Number of simultaneously available users
0 10 20 30 40 50 60 70 80 90 100
0.001 0.01 0.1 1 10 100
Cumulative distribution (in percentage)
Time (in hours, logscale) Session
Between sessions Session (12/4/2007) Between sessions (12/4/2007) Session (9/19/2006) Between sessions (9/19/2006)
(a) workstation-2008 and workstation-2006
0 10 20 30 40 50 60 70 80 90 100
0.001 0.01 0.1 1 10 100
Cumulative distribution (in percentage)
Time (in hours, logscale) Session
Between sessions Session (12/4/2007) Between sessions (12/4/2007) Session (9/19/2006) Between sessions (9/19/2006)
(b) itunes-2008 and itunes-2006
0 10 20 30 40 50 60 70 80 90 100
0.001 0.01 0.1 1 10 100
Cumulative distribution (in percentage)
Time (in hours, logscale) Session
Between sessions Session (12/4/2007) Between sessions (12/4/2007) Session (9/19/2006) Between sessions (9/19/2006)
(c) share-2008 and share-2006
Figure 3. Online availability behavior of campus users (academia)
shortening session durations equaled the increase in duration between sessions. For the first two weeks in December 2007, median values were 1.78 hours while 75% of users online every 5.5 hours. In 2006, the median values were 2.52 hours with 75% of users online every 6.9 hours. The users whom came online often remained online for shorter durations. We will later
show the performance reduction caused by this session duration change.
0 10 20 30 40 50 60 70 80 90 100
0.001 0.01 0.1 1 10 100
Cumulative distribution (in percentage)
Time (in hours, logscale) Session
Between sessions
(a) corporate-2002
0 10 20 30 40 50 60 70 80 90 100
0.001 0.01 0.1 1 10 100
Cumulative distribution (in percentage)
Time (in hours, logscale) Session
Between sessions
(b) sigcomm-2001
0 20 40 60 80 100
0.001 0.01 0.1 1 10 100
Cumulative distribution (in percentage)
Time (in hours, logscale) Session Between sessions Session (08/01/2007) Between sessions (08/01/2007) Session (09/01/2004) Between sessions (09/01/2004)
(c) hotspot-2007
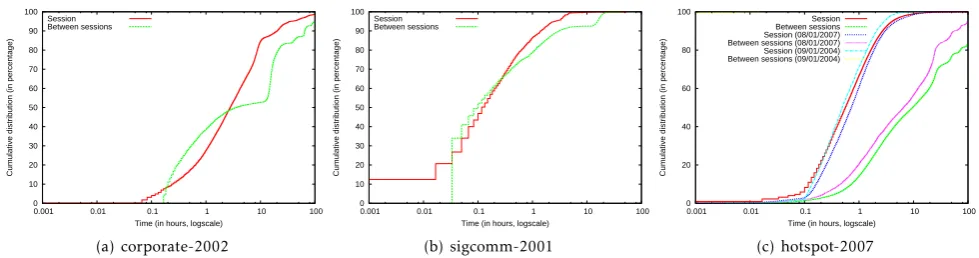
Figure 4. Online availability behavior
minutes, while 95% of the sessions were less than 1.75 hours. Specifically focusing on the two periods since 12/04/2007, we note that 50% of the sessions were less than 45 minutes, while 95% of the sessions were less than 100 minutes. However, for the itunes-2006traces we note that 50% of the sessions were larger than one hour with 95% of the sessions being larger than 7.7 hours. The duration between sessions was even larger;
itunes-2008 showed that 50% of the duration between
iTunes sessions was less than 4.5 hours with 95% of the durations over ten hours. However, analysis of the
itunes-2006 traces showed that 50% of the duration
between iTunes sessions lasted for less than 1.5 hours with 22% over ten hours. These trends are similar to theworkstationtraces.
We plot the session characteristics for theshare-2008 and share-2006 traces in Fig. 3(c). Session durations when users shared their iTunes collection were small. For theshare-2008traces, over 96% of the sessions were under 0.01 hours while 50% of the sessions were under 0.01 hours for the share-2006traces. Over 90% of the durations between sessions for the share-2008 traces were under an hour while the corresponding measures for the share-2006 traces were under 0.1 hours. The users exert control over when they shared their songs.
For thecorporate-2002traces (Fig.4(a)), we note that 50% of the sessions were longer than 2.8 hours with 95% of the sessions less than 36 hours. Analyzing the duration between sessions, we note that 50% of them were over 3.5 hours with 48% over 10 hours. Similarly, for the sigcomm-2001 traces (Fig. 4(b)), we note that most sessions and duration between sessions were small; 86% of the sessions were less than one hour long with only 22% of the duration between sessions longer than one hour. It is likely that conference attendees were paying attention to the conference and were using wireless networks for brief intervals. On the other hand, analyzing thehotspot-2007traces (Fig.4(c)), we note that 50% of the sessions were smaller than 35 minutes with 95% of the sessions less than four hours. Similarly, analyzing the Verizon hot spot network in
Manhattan, Blinn et al. [26] observed that 45.74% of the sessions lasted more than one hour. The duration between sessions for our hotspot traces was over 9.6 hours for 50% of the cases with 49% of the duration between sessions longer than ten hours.
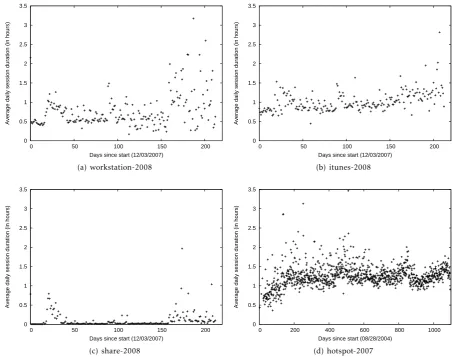
We also analyzed the long term daily average session duration for workstation-2008,itunes-2008,share-2008 and hotspot-2007 and plot the results in Fig. 5. For workstation-2008 (Fig. 5(a)), we note that the session lengths are longer during breaks (weekend, winter, spring and summer breaks) than when classes were in session. At the application level, these variations were less pronounced for itunes-2008 (Fig. 5(b)) where we saw a slight trend towards longer session durations. The session lengths for share-2008 remained small during the semester and increased during the breaks. For the hotspot-2007traces (Fig.5(d)), we note a slight increase in the session duration with less variability, especially when compared to the first six months.
By contrast, the Farsite study [5] used ping messages on a corporate desktop environment and reported that most machines were always available with unavailable intervals occurring during weekends. They reported that the median number of machines were available for more than 95% of the time. The Farsite study observed that the unavailable durations occurred during late nights and on the weekends.
Variations based on the capture mechanism. The session analysis (Section2.3) showed the differences in session
0 0.5 1 1.5 2 2.5 3 3.5
0 50 100 150 200
Average daily session duration (in hours)
Days since start (12/03/2007)
(a) workstation-2008
0 0.5 1 1.5 2 2.5 3 3.5
0 50 100 150 200
Average daily session duration (in hours)
Days since start (12/03/2007)
(b) itunes-2008
0 0.5 1 1.5 2 2.5 3 3.5
0 50 100 150 200
Average daily session duration (in hours)
Days since start (12/03/2007)
(c) share-2008
0 0.5 1 1.5 2 2.5 3 3.5
0 200 400 600 800 1000
Average daily session duration (in hours)
Days since start (08/28/2004)
(d) hotspot-2007
Figure 5. Evolution of session duration
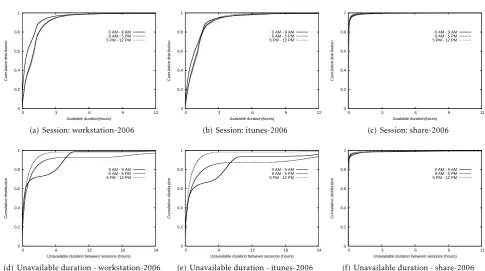
share-2006 and plotted the cumulative distributions. For sessions that spanned multiple time ranges, we attributed the durations to the starting time range. Most sessions were short and so this choice did not have an significant impact.
Analyzing the session durations for the workstation-2006(Fig.6(a)), we noted that the system behavior was similar for the duration of 9 AM - 5 PM and 5 PM - 12 PM. The session durations were shorter during late night hours. For example, the median durations were about twenty minutes as compared to an hour for the rest of the day. 20% of the day time and evening users were available for more than 1.5 hours. Also, an analysis of unavailable durations from Fig. 6(d)
showed that late night users were either available for two hours or available for long durations; 70% were available for less than two hours while the remaining 30% were available for over 6 hours. This behavior was consistent with users who either turn off their laptops before they go to sleep or leave them ON throughout the night. We observed no such behavior
during the other durations. Over 90% of the evening users returned after less than three hours, while 10% of the morning users were unavailable for over eighteen hours. One likely explanation was that the work day users included staff who returned the following day while evening users included dormitory students who became available after dinner.
itunes-2006 traces were similar to the workstation-2006traces (Figs.6(b)and6(e)). 60% of the users were unavailable for less than an hour or for the entire eight hours. The session duration did not show significant difference across the various time ranges. However, share-2006traces exhibited oscillatory behavior where users became available and unavailable for short periods of time (both for the session durations (Fig.6(c)) as well for the unavailable durations (Fig.6(f))).
0 0.2 0.4 0.6 0.8 1
0 3 6 9 12
Cumulative distribution
Available duration(hours) 0 AM - 9 AM 9 AM - 5 PM 5 PM - 12 PM
(a) Session: workstation-2006
0 0.2 0.4 0.6 0.8 1
0 3 6 9 12
Cumulative distribution
Available duration(hours) 0 AM - 9 AM 9 AM - 5 PM 5 PM - 12 PM
(b) Session: itunes-2006
0 0.2 0.4 0.6 0.8 1
0 3 6 9 12
Cumulative distribution
Available duration(hours) 0 AM - 9 AM 9 AM - 5 PM 5 PM - 12 PM
(c) Session: share-2006
0 0.2 0.4 0.6 0.8 1
0 6 12 18 24
Cumulative distribution
Unavailable duration between sessions (hours) 0 AM - 9 AM 9 AM - 5 PM 5 PM - 12 PM
(d) Unavailable duration - workstation-2006
0 0.2 0.4 0.6 0.8 1
0 6 12 18 24
Cumulative distribution
Unavailable duration between sessions (hours) 0 AM - 9 AM 9 AM - 5 PM 5 PM - 12 PM
(e) Unavailable duration - itunes-2006
0 0.2 0.4 0.6 0.8 1
0 3 6 9 12
Cumulative distribution
Unavailable duration between sessions (hours) 0 AM - 9 AM 9 AM - 5 PM 5 PM - 12 PM
(f) Unavailable duration - share-2006
Figure 6. Session durations in different time ranges
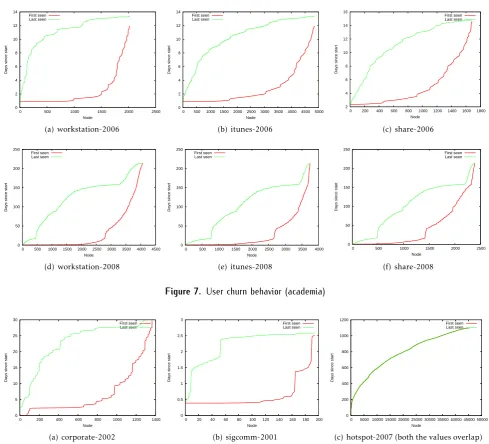
2.4. User churn behavior
Next, we investigate the introduction and attrition of nodes for the various traces in Fig. 8. A new node will need to receive all the updates from prior users. In the academic scenario, we expect new users to arrive at the beginning of a semester while generally remaining stable throughout the semester. Analyzing the workstation-2008 traces in Fig. 7(d), we note that over 2,750 users (of the total 4,000 users) were seen within the first few weeks. However, after the winter break (about 50 days since the start of the trace), new users were steadily added even though the overall number of monitored APs was continuously reduced. On the other hand, about 500 users were never seen after the Fall 2007 semester (first few weeks). During the Spring 2008 semester, users constantly left the system until about 150 days into the trace. Note that APs were removed from our monitoring abruptly in the middle of the spring break (and not gradually as indicated by Fig. 7(d)). Similar results were observed for analyzing the itunes-2008 trace (Fig. 7(e)) and the corporate-2002traces (Fig.8(a)) where about 50% of the users appeared at the beginning of the traces (delayed because some users were likely offline during the start of the trace collection). However, the rest of the users continued to trickle in during the remainder of the trace duration (with a two day jump, likely because of the weekend). We even observed this effect in the sigcomm-2001traces (Fig.8(b)) where the short duration of the
traces made such a behavior seemingly unlikely; we observed that about 35 users joined the system after the first day. Finally, we observed that new users were constantly entering the system and existing users were similarly leaving the system by analyzing the hotspot-2007traces (Fig.8(c)). This is likely typical in hotspots.
2.5. Summary of results
0 2 4 6 8 10 12 14
0 500 1000 1500 2000 2500
Days since start
Node First seen
Last seen
(a) workstation-2006
0 2 4 6 8 10 12 14
0 500 1000 1500 2000 2500 3000 3500 4000 4500 5000
Days since start
Node First seen
Last seen
(b) itunes-2006
2 4 6 8 10 12 14 16
0 200 400 600 800 1000 1200 1400 1600 1800
Days since start
Node
First seen Last seen
(c) share-2006
0 50 100 150 200 250
0 500 1000 1500 2000 2500 3000 3500 4000 4500
Days since start
Node First seen
Last seen
(d) workstation-2008
0 50 100 150 200 250
0 500 1000 1500 2000 2500 3000 3500 4000
Days since start
Node First seen
Last seen
(e) itunes-2008
0 50 100 150 200 250
0 500 1000 1500 2000 2500
Days since start
Node
First seen Last seen
(f) share-2008
Figure 7. User churn behavior (academia)
0 5 10 15 20 25 30
0 200 400 600 800 1000 1200 1400
Days since start
Node
First seen Last seen
(a) corporate-2002
0 0.5 1 1.5 2 2.5 3
0 20 40 60 80 100 120 140 160 180 200
Days since start
Node
First seen Last seen
(b) sigcomm-2001
0 200 400 600 800 1000 1200
0 5000 10000 15000 20000 25000 30000 35000 40000 45000 50000
Days since start
Node
First seen Last seen
(c) hotspot-2007 (both the values overlap)
Figure 8. User churn behavior
investigate the implications of these observations for group communication mechanisms.
Next, we investigate various group communications mechanisms. Collaboration applications use group communication mechanisms to implement their collab-oration functionality. We consider applications which allow any group member to modify shared contents. The system attempts to reflect each update to all the other group members. The group communication mechanism itself does not guarantee any message deliv-ery order; although group collaboration applications may impose application specific ordering constraints. Also, we investigate the average behavior among a ran-dom group of wireless users. This ranran-dom group should represent a lower bound; actual collaborating group
members will exhibit higher correlated availability. We choose representative traces for ease of illustration.
3. Synchronous mechanism
0 0.2 0.4 0.6 0.8 1
0 5 10 15 20 25 30 35 40 45 50 55 60
Availability rate
Days since start (12/03/2007) Replicas = 5 Replicas = 10 Replicas = 25
(a) workstation-2008 (max values in a day)
0 0.2 0.4 0.6 0.8 1
0 5 10 15 20 25 30 35 40 45 50 55 60
Availability rate
Days since start (12/03/2007) Replicas = 5 Replicas = 10 Replicas = 25
(b) itunes-2008 (max values in a day)
0 0.2 0.4 0.6 0.8 1
0 1 2 3 4 5 6 7 8 9 10 11
Availability rate
Days since start (09/29/2006) Replicas = 5 Replicas = 10 Replicas = 25
(c) workstation-2006
0 0.2 0.4 0.6 0.8 1
0 1 2 3 4 5 6 7 8 9 10 11
Availability rate
Days since start (09/29/2006) Replicas = 5 Replicas = 10 Replicas = 25
(d) itunes-2006
0 0.2 0.4 0.6 0.8 1
0 5 10 15 20 25 30
Availability rate
Days since start (07/20/2002) Replicas = 5 Replicas = 10 Replicas = 25
(e) corporate-2002
0 0.2 0.4 0.6 0.8 1
0 1 2 3
Availability rate
Days since start (08/29/2001) Replicas = 5 Replicas = 10 Replicas = 25
(f) sigcomm-2001
0 0.2 0.4 0.6 0.8 1 1.2
0 2 4 6 8 10 12 14
Availability rate
Time since start (08/01/2007) Replicas = 5 Replicas = 10 Replicas = 25 Replicas = 150
(g) hotspot-2007
Figure 9. Improving availability of local updates for other group members by replicating objects among wireless devices
such as AFS [28] and NFS [29] as well as applica-tions such as MoonEdit (moonedit.com) and Google-Docs (docs.google.com). Applications such as UNA (n-brain.net) and SubEthaEdit (codingmonkeys.de/ subethaedit) use a distributed approach.
In Section 2.2, we showed that few users were simultaneously available. For the more recent wireless users in academia, only 15% of the users were simultaneously available during the daytimes. These figures were even lower for the hotspot users where only 4% of the users were simultaneously available.
On the other hand, 38.7% of corporate users were simultaneously available during the daytimes. These figures were far lower during night times. By comparison, Farsite [5] observed high availability among wired corporate desktops. On average, the number of conflicting updates among wireless group members who were simultaneously available is likely to be small. Conflict resolution techniques designed for wired users should be adequate for wireless users.
to other group members as they become available. One way to increase availability is to use a wired server for storage. Another alternative is to use the wireless devices themselves. Since contemporary wireless devices are resource rich, we evaluate the amount of replication required to achieve good availability of specific contents. Such evaluations had been performed using desktop storage [30,31]. Using corporate desktops, Farsite [32] achieved four nines of availability using just three replicas.
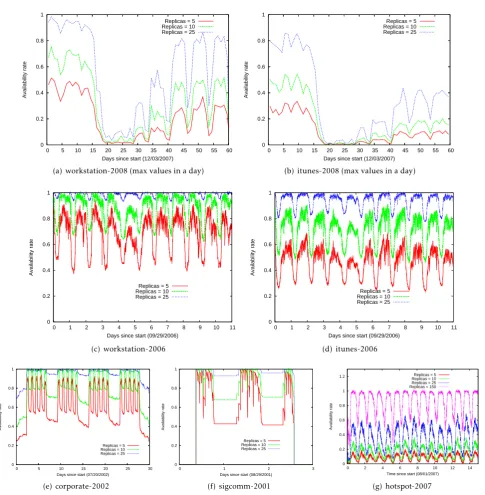
We randomly select five, ten and twenty five replicas. We assume that these nodes were simultaneously available with the originating node and so the updates were directly replicated in all these nodes. Using asynchronous mechanisms [33] to propagate updates to these replicas can itself introduce long delays. We calculate the availability of this particular content to others throughout our trace interval. In effect, this is the best case scenario where the group member that requires the update can be any node from our trace other than the replica nodes. Note that we only need one of these replicas to be online in order to make the contents available. We repeated each experiment 1,000 times and plot the average availability by the time of the day for the various traces in Fig.9.
First we analyzed the system in academia. For the
workstation-2008 and itunes-2008 traces, we improve
readability by plotting the maximum availability values in a particular day. In general, the availability follows a diurnal as well as a seasonal pattern (end of semester, winter break, beginning of new semester). Analyzing theworkstation-2008 traces (Fig.9(a)), note that five replicas only achieved about 50% availability during December 2007. The availability reduced to almost 0% during the winter break before recovering to about 20%-30% in the Spring 2008 semester. Increasing the replication rates to ten replicas improved the availability in December 2007 to 70% while 25 replicas are required to achieve 100% availability (albeit briefly). Comparing these results with the workstation-2006 traces (Fig. 9(c)), we observed that five replicas achieved up to 90% availability while 25 replicas achieved 100% availability consistently during daytimes. Reduced session durations is worsening the prospect for distributed update propagation.
An analysis ofitunes-2008showed that the availabil-ity was worse for iTunes users. Fig. 9(b) shows that itunes-2008 users only achieve about 40% availability for using five replicas in December 2007. Even when we increase this amount to 25 replicas, the availability only reaches 90%. On the other hand, by the beginning of Spring 2008, even with 25 replicas, the maximum availability only reaches around 40%. By contrast, an analysis ofitunes-2006in Fig.9(d), shows that 25 repli-cas was enough to provide 100% availability during
the daytimes. Even five replicas achieved about 60% availability for a targeted contents during the day times. Next we analyzed the behavior in a corporate setting using corporate-2002. We note that (Fig. 9(e)) five replicas provide about 90% availability during the weekday business hours. During the evenings, we achieve availability of about 60% which reduces to about 45% by the weekend. Replications of about 25 copies achieve about 95% availability even during the weekend. Note that Farsite [32] achieved excellent availability using only three desktop replicas.
The sigcomm-2001 traces (Fig. 9(f)) show that
even five replicas achieved good availability during the conference durations. However, 25 replicas are required to achieve good availability during the night hours when the conference was not in session. Finally, we analyzed the behavior for the hotspot-2007 traces. In Fig. 9(g), we note that five replicas only achieve about 10% availability. Even 25 replicas only achieves about 60% availability during daytimes. We required about 150 replicas to achieve 100% availability during the weekdays. Distributed update propagation is not feasible among wireless devices in a hotspot; the hotspot provider should provide the storage infrastructure necessary to make shared contents available to other group members.
To summarize, the number of simultaneously able users and the duration that each user was avail-able is decreasing. Unlike wired scenarios, this trend reduces the effort required to maintain consistency among updates. However, this exacerbates the problem of distributing updates from one group member to all others. Distributed approaches require a large number of replicas to forward updates to other members. Even though laptops are resource rich and capable of provid-ing service to others, the replica requirement makes a distributed approach impractical, especially in hotspots where we require over 150 replicas. Hotspots are also unlikely to provide the necessary storage servers. The performance achieved in a university and corporate scenarios were tolerable, especially during durations when all the users were active (e.g., daytimes). Next, we investigate asynchronous mechanisms.
4. Asynchronous mechanism
Update propagation can be implemented as a daemon process that starts as soon as the users authenticate themselves with the system. Since workstation-2008 traces capture this duration, we illustrate the system performance using this trace.
4.1. Propagation policies
A distributed approach propagates the updates to simultaneously online group members, likely delayed from when the update was created. Each update is subsequently propagated to other nodes through successive gossips in order to eventually reach all group members. Some of these gossip sessions are unnecessary because the corresponding pair of nodes already have all the updates available. Frequent propagation attempts will improve system performance while incurring a high number of unnecessary gossips. For example, Bayou [36] used version vectors to identify updates that needed to be propagated during a pair-wise anti-entropy session. We investigate the impact of various policy parameters for update propagation.
Updates can either be pushed by the originating node or pulled by other nodes. We refer to these policies
as P2P-push and P2P-pull, respectively. Similarly, a
server mediated approach uses a (always online) server. This mediation can either be initiated by the node or the server. In server initiated mechanisms, the server periodically pulls updates from nodes that are online and then pushes them to other online nodes. We refer to this policy as Svr-ServInit. On the other hand, in a node initiated policy, the node that created updates periodically pushes the updates to the server while also retrieving updates from other nodes from the server. We refer to this policy asSvr-NodeInit. When they come online, nodes always initiate a push or pull operation.
The time to perform each push and push operation depends on the size of the update as well as on the available network bandwidth. Given the bandwidth availability on wireless LANs, we do not model this duration (similar assumptions as Demers et al. [37] and Birman et al. [38]). We assume that nodes go offline
without explicitly pushing its updates to other nodes. Depending on the group size, we also need to choose several other propagation parameters. During the initial phases, few nodes contain the updates and hence the system has to aggressively propagate the updates before the nodes that contain them go offline. This is particularly important while the update was only available in the node that created the update.
4.2. Performance metrics
Unlike metrics used by Vahdat et al. [39] that measured the time required to propagate a single update from a random node to every other group member, we use metrics that capture a dynamic system where
t0
U 1
U 2
U 3
t7 t 10 t11
t9
t12
t13 t5 t6
t3 t4 t1 t2
t8
Figure 10. illustration of availability behavior of three users
new updates are continuously created by each group member. Consider a group of three nodes (U1,U2 and
U3) and their availability durations as illustrated in
Fig. 10. U1 is available from t1. . . t2, t3. . . t4, t7. . . t10
andt11. . . t12;U2 is available fromt5. . . t6 andt9. . . t13
andU3 is available fromt0. . . t8. Say att8, our metrics
quantify the amount of updates from U1, U2 and U3
that are unavailable in the other nodes. Rather than choosing arbitrary values for update creation rates, we assume that nodes create updates at a constant rate. Hence, the amount of time that a node was available measures the updates created by the node. Consider a node that was missing updates created by another node that was online for two hours. A target application might create updates at the rate of one update per hour. For this application, this system performance would translate to missing two updates.
We quantify the number of updates using a lag metric and the network overhead by the number of gossips.
• lag metric: We measure the average number of
updates that are unavailable at a node using lagAmount. Consider the illustration in Fig. 10
(ignoring U3 for now). At t5, U2 does not
have updates (t1. . . t2) and (t3. . . t4) from U1;
the lagAmount at U2 is (t2−t1) + (t4−t3). At t6,
the lagAmount of U1 is t6−t5 and for U2 is
(t2−t1) + (t4−t3) for an average lagAmount of (t2−t1)+(t4−t3)+(t6−t5)
2 . The lag values depend on the
propagation policies (further explored in Section
4.4). For example, U3 could help in ferrying
updates betweenU1andU2.
0 0.1 0.2 0.3 0.4 0.5 0.6 0.7 0.8 0.9
0 2 4 6 8 10 12 14
Average time nodes online (in days)
Time since start of trace (in days) corporate-2002
hotspot-2007 workstation-2008
(a) Average time nodes online
0.1 1 10
0 1 2 3 4 5 6 7 8 9 10 11 12 13 14 15
Pairwise overlap time(in hours)
Time since start of trace(in days) corporate-2002 ave.
corporate-2002 max. workstation-2008 ave. workstation-2008 max. hotspot-2007 ave. hotspot-2007 max.
(b) Overlap time among user pairs
Figure 11. Availability parameters that affect the lag metrics
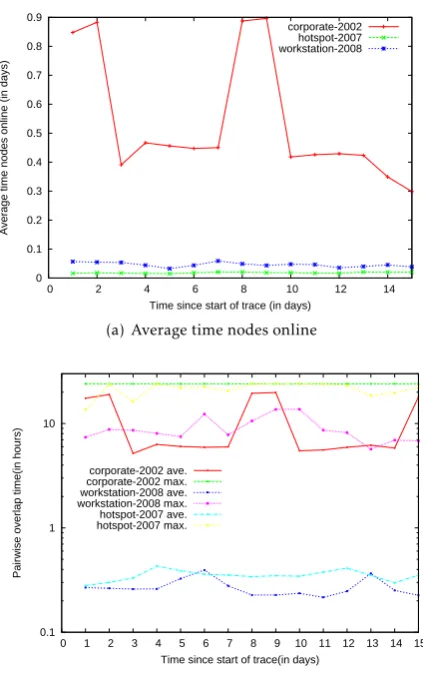
The number of node pairs is O(n2) of the group size, the lag metrics depend on the group size (O(n)). The lag metrics depend on the number of updates created; hence given our assumptions, a locale where users are available for long durations will create large numbers of updates which can potentially lead to higher lagAmounts. We plot the average number of updates created per day of our traces in Fig. 11(a). Corporate-2002users were available for long durations. Hence they were assumed to be creating large number of updates. Users were online for over 0.4 and 0.9 days on weekdays and weekends, respectively. However, the number of users was smaller during the weekends. These values were smaller for the other traces, about 0.02 days for the hotspot-2007trace and 0.04 days for theworkstation-2008traces.
For distributed scenarios, the lag metrics also depend on the periods when nodes overlap. We plot the amount of pair-wise node overlap for the various traces in Fig.
11(b). The average overlap between pairs of nodes was 0.35 hours for both the hotspot-2007and workstation-2008 traces. However, the duration was about six hours during the weekdays and over 11 hours over
the weekend for the corporate-2002 users. Unlike the
corporate-2002trace where some nodes overlapped for
24 hours, the pairs ofuniversityusers never overlapped for more than 10.5 hours. Thus, the number of updates as well as the rate of update propagation are likely to be high in thecorporate-2002scenario.
We randomly created groups of three, fifteen and thirty users and investigate the effects of the update frequency using the lag and gossip metrics. Three is the smallest meaningful group size for asynchronous propagation while thirty is a large group. We repeat the simulations for fifty different groups.
4.3. Limitations of asynchronous propagation
First we analyzed the performance limit. The best performance is achieved in a Svr-ServInit scenario where the update duration is zero seconds; i.e., the server constantly polls all nodes; any updates are immediately pulled by the server and sent to all the other nodes that are also online. Still, updates cannot be sent to nodes that are not online. Thus, the best performance is dependent on the user availability. Also, this policy is not practical because it will incur tremendous network overhead for constantly pulling updates. Practical systems delay this operation and propagate updates at less frequent intervals; we investigate these intervals in Section4.4.
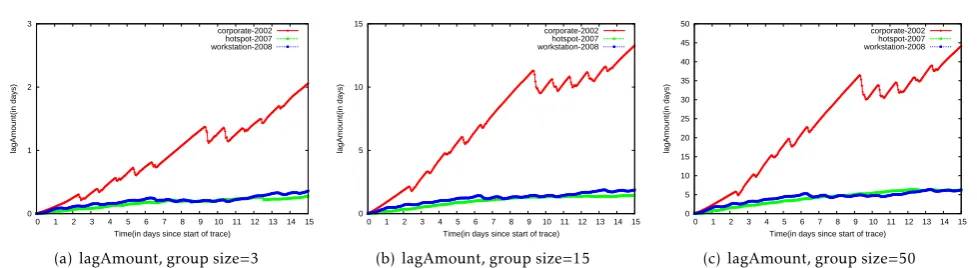
We plot thelagAmountfor groups of size three, fifteen and fifty in Fig. 12. We note that the lag metrics continue to rise throughout the trace duration. This phenomenon is caused by node churn. When a node leaves the system, we continue to compute its lag values for updates created by other nodes. Our propagation policies described in Section 4.4counteract this effect
by reporting the relative difference from the best policy. The lag amounts were high and depend on the group size. From Figs.12(a),12(b)and12(c), we note that the number of updates that are yet to propagate to a node is as high as forty four days by the end of the trace for thecorporate-2002 trace. The session durations for the hotspot-2007andworkstation-2008 traces were smaller (Section2), producing smaller lag amounts.
Each day, nodes did not receive updates that were created in about 15 days from other nodes. The number of updates accumulated depends on the node session duration and churn;corporate-2002users exhibit large amounts of pending updates. Unless efforts to improve the wireless user availability are successful, asynchronous mechanisms are not suitable for applications which require tighter propagation.
4.4. Performance of propagation policies
0 1 2 3
0 1 2 3 4 5 6 7 8 9 10 11 12 13 14 15
lagAmount(in days)
Time(in days since start of trace) corporate-2002
hotspot-2007 workstation-2008
(a) lagAmount, group size=3
0 5 10 15
0 1 2 3 4 5 6 7 8 9 10 11 12 13 14 15
lagAmount(in days)
Time(in days since start of trace) corporate-2002
hotspot-2007 workstation-2008
(b) lagAmount, group size=15
0 5 10 15 20 25 30 35 40 45 50
0 1 2 3 4 5 6 7 8 9 10 11 12 13 14 15
lagAmount(in days)
Time(in days since start of trace) corporate-2002
hotspot-2007 workstation-2008
(c) lagAmount, group size=50
Figure 12. Best performance achievable for the various traces
on a particular day for the P2P-pull policy was four while the corresponding values for the best policy was three, we report a relative lagAmount of one day. Analyzing the relative costs has the added benefit of eliminating the lag values accumulated due to not propagating updates to nodes that have left the system. However, updates which were created on the node that will leave the system and that was not propagated to other nodes will still affect the relative costs. We prefer a policy that minimizes the relative performance.
Investigation of propagation frequency. Nodes propagate updates when they become online with subsequent propagations at regular intervals. This frequency is application driven and depends on the user availability. If the node becomes unavailable before update propagation, then the updates created during this session will be delayed. It is impractical to require nodes to propagate updates before going offline. Hence, we investigate whether we can predict when a node will go offline and correspondingly adapt the update frequency. We investigate history based approaches that use the past session durations to predict the expected session duration. For this analysis, we use various history values of one, two and three. For each of these values, we choose base frequencies of five min., fifteen min., thirty min. or an hour. For each base frequency, if the predicted session duration was less than the predicted duration, we reduce the update frequency to the predicted value. We tabulate the cumulative percentage of times when a node goes offline before subsequent update propagation for our traces in Table
1. The table is read as follows: for the workstation-2008trace, using a base frequency of an hour, 90.1% of the time, the node will go offline before subsequent propagation. Given the average session duration of 20 mins. (Section 2), most of these updates are unduly delayed until the node came back online; average time between sessions was 1.78 hours for this trace (Section
2). The lag values are reduced when the times when no
further updates were propagated was low; using the last session duration can reduce this value to 48.9%.
From Table 1, we note that the percentage of time when nodes did not subsequently propagate updates was higher for workstation-2008. In all the traces, the best performance was achieved when the base update frequency was high; this observation needs to be reconciled with the number of unnecessary gossips. An adaptive policy that used the recent past session duration was also effective. We investigate our propagation policies using the adaptive as well as application specified propagation durations.
P2P-pull. We plot the relative lagAmount and the number of gossips and unnecessary gossips in Fig.
13. As nodes come online, they pull updates from other group members that are also online at frequent intervals that are either fixed or adaptive (Section4.4). The times that nodes come online are unpredictable. Hence the pull operations to propagate updates created at any node to other nodes is also random. Note that the adaptive duration allows the local node to pull updates from other nodes before going offline; it does not affect when the local updates are sent to other nodes. Adaptive policies only made significant improvements in theworkstation-2008scenario.
trace base freq = 5 min base freq = 15 min base freq = 30 min base freq = 60 min
0 1 2 3 0 1 2 3 0 1 2 3 0 1 2 3
corporate-2002 1.4 1.3 1.4 1.4 10.0 8.9 9.7 9.7 17.5 14.6 16.0 16.3 28.5 22.3 24.7 25.2
hotspot-2007 2.5 2.4 2.5 2.5 20.1 16.7 17.4 17.2 38.8 28.7 30.2 30.1 60.6 39.4 41.4 41.1
workstation-2008 18.9 15.7 17.3 17.8 40.0 30.1 33.9 35.5 63.4 41.6 47.1 49.2 90.1 48.9 52.4 53.7
Table 1. Cumulative percentage of times when node went offline before subsequent update propagation
0 0.2 0.4 0.6 0.8 1 1.2
0 2 4 6 8 10 12 14
lagAmount (in days)
Time since start of trace (in days) corporate-2002: g:15, 1 hr hotspot-2007: g:15, 1 hr workstation-2008: g:15, 1 hr, non-adaptive workstation-2008: g:15, 1 hr corporate-2002: g:15, 15 min workstation-2008: g:15, 15 min corporate-2002: g:3, 1 hr hotspot-2007: g:3, 1 hr workstation-2008: g:3, 1 hr
(a) lagAmount
0 10 20 30 40 50 60
0 2 4 6 8 10 12 14
Gossips
Time since start of trace (in days) corporate-2002: g:15, 1 hr
hotspot-2007: g:15, 1 hr workstation-2008: g:15, 1 hr, non-adaptive workstation-2008: g:15, 1 hr corporate-2002: g:15, 15 min
workstation-2008: g:15, 15 min corporate-2002: g:3, 1 hr hotspot-2007: g:3, 1 hr workstation-2008: g:3, 1 hr
(b) numGossips
0 10 20 30 40 50 60
0 2 4 6 8 10 12 14
Unnecessary gossips
Time since start of trace (in days) corporate-2002: g:15, 1 hr
hotspot-2007: g:15, 1 hr workstation-2008: g:15, 1 hr, non-adaptive workstation-2008: g:15, 1 hr corporate-2002: g:15, 15 min
workstation-2008: g:15, 15 min corporate-2002: g:3, 1 hr hotspot-2007: g:3, 1 hr workstation-2008: g:3, 1 hr
(c) numWGossips
Figure 13. P2P-pull (adaptive duration by default)
showed a residual relativelagAmountof 0.7 days vs 0.88 days for a non-adaptive policy.
These updates were spread over long durations, espe-cially in the hotspot-2007scenario. The improvements of the adaptive policy was more modest even for the workstation-2008 setting. Investigating the number of gossips and the number of unnecessary gossips in Figs.
13(b) and 13(c), respectively, we note the high num-ber of gossips as well as unnecessary gossips in the corporate setting. For other scenarios which exhibit poorer user availability, the number of gossips were low; about ten for groups of size fifteen. Later, we show that these parameters are competitive with server mediated approaches.
P2P-push. For theP2P-pushpolicy (Fig.14), the system is far more sensitive to the propagation rate of the local node. Note that forP2P-pull, it is the responsibility of other nodes to pull local updates. For a group of size 15, there are 14 other nodes which are attempting to perform this propagation vs one for theP2P-pushpolicy. An adaptive policy may push its updates to another node before going offline. However, any local update that was not pushed by the source to another node will not propagate to any other nodes; increasing the overall lag metrics. Overall, the system performance is slightly worse than the performance of theP2P-pullpolicy. An adaptive policy forworkstation-2008setting for a group of size 15 with base propagation frequency of one hour experiences an lagAmount of 0.75 days (as compared to 0.7 days for theP2P-pullpolicy). Hence, P2P-pullis preferable toP2P-push.
0 0.2 0.4 0.6 0.8 1 1.2
0 2 4 6 8 10 12 14
lagAmount (in days)
Time since start of trace (in days) corporate-2002: g:15, 1 hr
hotspot-2007: g:15, 1 hr workstation-2008: g:15, 1 hr corporate-2002: g:15, 15 min workstation-2008: g:15, 15 min corporate-2002: g:3, 1 hr hotspot-2007: g:3, 1 hr workstation-2008: g:3, 1 hr
(a) lagAmount
0 10 20 30 40 50 60
0 2 4 6 8 10 12 14
Gossips
Time since start of trace (in days) corporate-2002: g:15, 1 hr
hotspot-2007: g:15, 1 hr workstation-2008: g:15, 1 hr
corporate-2002: g:15, 15 min workstation-2008: g:15, 15 min corporate-2002: g:3, 1 hr
hotspot-2007: g:3, 1 hr workstation-2008: g:3, 1 hr
(b) numGossips
0 0.2 0.4 0.6 0.8 1 1.2
0 2 4 6 8 10 12 14
lagAmount (in days)
Time since start of trace (in days) corporate-2002: g:15, 1 hr hotspot-2007: g:15, 1 hr workstation-2008: g:15, 1 hr, non-adaptive workstation-2008: g:15, 1 hr corporate-2002: g:15, 15 min workstation-2008: g:15, 15 min corporate-2002: g:3, 1 hr hotspot-2007: g:3, 1 hr workstation-2008: g:3, 1 hr
(a) lagAmount
0 10 20 30 40 50 60
0 2 4 6 8 10 12 14
Gossips
Time since start of trace (in days) corporate-2002: g:15, 1 hr
hotspot-2007: g:15, 1 hr workstation-2008: g:15, 1 hr, non-adaptive workstation-2008: g:15, 1 hr corporate-2002: g:15, 15 min
workstation-2008: g:15, 15 min corporate-2002: g:3, 1 hr hotspot-2007: g:3, 1 hr workstation-2008: g:3, 1 hr
(b) numGossips
0 10 20 30 40 50 60
0 2 4 6 8 10 12 14
Unnecessary gossips
Time since start of trace (in days) corporate-2002: g:15, 1 hr
hotspot-2007: g:15, 1 hr workstation-2008: g:15, 1 hr, non-adaptive workstation-2008: g:15, 1 hr corporate-2002: g:15, 15 min
workstation-2008: g:15, 15 min corporate-2002: g:3, 1 hr hotspot-2007: g:3, 1 hr workstation-2008: g:3, 1 hr
(c) numWGossips
Figure 14. P2P-push (adaptive duration by default)
Svr-ServInit. Next, we investigate the relative perfor-mance of server assisted approaches. The server peri-odically pulls new updates from online nodes and sends them to other online nodes. We plot the relative lagAmountand the number of gossips in Fig.15. Note that the server cannot adapt to the session durations of individual nodes; if a particular node came online and went offline between the propagation interval, then its updates are not propagated to other nodes even though the server is continuously available. Each gossip as compromised of two operations; a pull of contents form a particular node and push these contents to other nodes. All the gossips in this scenario are useful.
From Fig. 15(a), we observed that the lagAmount progressively increases with time. Even if the server was continuously available, it is possible for a node to come online and go offline without propagating its updates to other nodes (especially if the session duration was below the propagation rate). For small group sizes, theSvr-ServInitpolicy exhibits better performance than distributed approaches. For example, for groups of size three in a workstation-2008 with base updates every hour, the adaptiveP2P-pullpolicy experienced a relative lagAmount of 0.3 days at the end of the 15th day. However, theSvr-ServInitpolicy for similar settings experienced a lagAmount of 0.15 days. However, the distributed approaches are more competitive for larger groups. For the Svr-ServInitpolicy in the workstation-2008scenario with a group size of 15 and a propagation frequency of an hour, the relative lagAmount is about a day. The corresponding values for an adaptive P2P-pull was only 0.7 days. The improvements were even more pronounced for groups of size 50. Since the distributed approaches allow all the nodes to initiate the propagation operation, P2P schemes achieve better randomization of update propagation.
Svr-NodeInit. Svr-NodeInit policy (Fig. 16) is similar to the P2P-push policy in that nodes periodically sends its updates to the server while simultaneously downloading new updates from other nodes. Thus, this
0 0.2 0.4 0.6 0.8 1 1.2
0 2 4 6 8 10 12 14
lagAmount (in days)
Time since start of trace (in days) corporate-2002: g:15, 1 hr
hotspot-2007: g:15, 1 hr
workstation-2008: g:15, 1 hr, non-adaptive workstation-2008: g:15, 1 hr
corporate-2002: g:15, 15 min workstation-2008: g:15, 15 min corporate-2002: g:3, 1 hr hotspot-2007: g:3, 1 hr workstation-2008: g:3, 1 hr
(a) lagAmount
0 10 20 30 40 50 60
0 2 4 6 8 10 12 14
Gossips
Time since start of trace (in days) corporate: g:15, 1 hr
hotspot: g:15, 1 hr university: g:15, 1 hr, non-adaptive university: g:15, 1 hr corporate: g:15, 15 min
university: g:15, 15 min corporate: g:3, 1 hr hotspot: g:3, 1 hr university: g:3, 1 hr
(b) numGossips
Figure 16. Svr-NodeInit
policy leverages the availability of server nodes and propagates its updates quickly. Fig. 16(a) shows that even after fifteen days, thelagAmountwas a modest 0.2 days (this value can be as high as 1.2 days for the other propagation mechanisms).
the performance of several distributed and server mediated approaches with this policy. The fundamental limitation of these practical policies was the mismatch between the propagation rates and the times when nodes go offline before propagating their updates to other nodes. Frequent propagations correspondingly increase the number of unnecessary gossips; an adaptive policy that tuned the frequencies to the node session duration improved the system performance for distributed approaches. These adaptive policies only required the last session duration of any node. We showed that the Svr-NodeInit policy achieved the best performance with the P2P-pull policy exhibiting competitive performance. Overall, distributed policies are competitive, especially for larger groups.
4.5. Peer selection mechanisms
Increasing the propagation rate improves system performance while also requiring a higher number of gossips. One approach to address this concern is to choose higher propagation rates while proportionately reducing the number of nodes to propagate updates. We investigate this tradeofffor our wireless users.
We plot the relative performance for varying the number of peers used for update propagation using the non-adaptive P2P-pull policy for groups of size 15 in Fig. 17. We reduce the percentage of users from 100% to 50% and 25% while increasing the propagation rates from 1 hour to 30 min. and 15 min. For thecorporate-2002trace, choosing fewer nodes has relatively minor effect on the lagAmounts. At the end of fifteen days, the lagAmount was about 0.1 days for propagating to 100% as well as 50% of the nodes (while doubling the propagation rates). Propagating to 25% of the nodes (while quadrupling the propagation rate) increased the lagAmount to about 0.15 days. The corresponding reduction in unnecessary gossips was from 24 to 16 and 14, respectively. Reducing the percentage of nodes to propagate updates while increasing the update frequency is a viable approach for large corporate-2002 groups. For the hotspot-2007 trace, reducing the frequency increased thelagAmount from 1.3 days to 1.5 days with small differences in the number of unnecessary gossips. On the other hand, for the workstation-2008 trace, reducing the percentage of online nodes to propagate updates from 100% to 50% and 25% (while exponentially increasing the propagation rates) drastically worsened thelagAmountfrom about 0.8 days to 1.3 days and 1.6 days, respectively. The number of unnecessary gossips showed a small improvement.
A similar analysis for groups of size fifty (Fig. 18) showed a worse performance for both thehotspot-2007 and the workstation-2008 traces. For the hotspot-2007 traces, the lagAmounts increased from 2 days to 2.6
and 3.2 days, respectively. For the workstation-2008 traces, the lagAmounts increased from 0.6 days to 1.2 and 1.55 days, respectively. The number of unnecessary gossips also worsened for thecorporate-2002trace; from 50 gossips to 225 and 125 gossips, respectively. For scenarios which exhibit poorer availability, reducing the percentage of nodes while increasing the update propagation rate is not a viable option.
5. Related work
Bolosky et al. [5] analyzed the availability of wired cor-porate desktops. They [32] showed that the availability was sufficient to support up to four nines availability using three replicas in the Farsite [30] storage system.
Prior studies analyzed user mobility, the network traffic and load characteristics of wireless users in various deployment scenarios. We used some of these traces to analyze the behavior of group communications amongst these wireless users. Tang et al. [40] monitored the WLAN network in a university building using
tcpdump traces, AP SNMP and authentication logs
in order to understand the network traffic and load characteristics. Analyzing the authentication logs, they observed that session lengths were longer than twelve hours. Kotz et al. [16] investigated a campus wide WLAN network using packet dumps (tcpdump) as well as access point SNMP and association logs. They note that HTTP protocol and file backups dominated the wireless traffic. They also conducted a follow-up analysis [3] on the evolution of their campus WLAN deployment which showed that the traffic had evolved to include significant amounts of traffic for streaming multimedia, VOIP and P2P traffic. They also observed that on-campus traffic outstripped off-campus traffic, an indication of the importance of group communications among wireless users. Chandra et al. [9] analyzed the popularity and nature of objects shared by iTunes users in a campus setting. Balachandran et al. [22] analyzed the wireless traffic from SIGCOMM 2001
participants and showed that Web and SSH dominated the traffic at over 64% of the traffic. Balazinska et al. [20] analyzed the access point load and user mobility behavior of corporate wireless LAN users by using SNMP probes of the access points. Papadopouli et al. [41] analyzed the wireless user mobility pattern at the UNC campus. On the Verizon hotspot network, Blinn et al. [26] observed that 45.74% of the user sessions lasted more than one hour. Hsu et al. [42] presented a comprehensive analysis of the user mobility behavior across four different university campuses using access point logs. McNett et al. [43] focused their mobility analysis to PDA users in a university setting.