Winter and spring diving behavior of bowhead
whales relative to prey
Heide-Jørgensen
et al.
R E S E A R C H
Open Access
Winter and spring diving behavior of bowhead
whales relative to prey
Mads Peter Heide-Jørgensen
1*, Kristin L Laidre
2, Nynne H Nielsen
1, Rikke G Hansen
1and Anders Røstad
3,4Abstract
Background:Little is known about bowhead whale (Balaena mysticetus) foraging behavior and what
concentrations of prey are required to balance the energetic trade-offs of feeding. We used satellite telemetry, archival depth recorders, and water column echo sounding data to study bowhead whale diving behavior relative to prey depth and concentration in Disko Bay, West Greenland.
Results:Between March and May 2008 to 2011, nine bowhead whales were tagged in Disko Bay, West Greenland with instruments that collected data on location and diving over a period of 1 to 33 days. The frequency of U-dives (presumed to be foraging dives) was low during winter months but more than doubled in spring concurrent with a decrease in diving depth. The mean speed of the horizontal bottom phase of the U-dives was 0.9 ms-1and on average, whales spent 37% of their time at the bottom phase of the dive. In March, bowhead whales presumably fed on copepods (Calanusspp.) close to the seabed (between 100 and 400 m). In April and May, after the copepods ascended to shallower depths, bowhead whales also dove to shallower depths (approximately 30 m) more often. However, echo sounding surveys in the vicinity of feeding whales in early May indicated that patches of copepods could still be found close to the seabed.
Conclusions:There was a marked change in diving behavior from winter through spring and this was likely in response to the changes in sea ice conditions, primary production and potential copepod abundance in the upper part of the water column. Depth and duration of dives changed significantly during this period; however, other dive parameters (for example the proportion of time spent feeding on the bottom of U-dives) remained fairly constant indicating a constant feeding effort. Bowhead whales target copepods at or close to the seabed in winter months in Disko Bay and continue feeding on copepods when they migrate to the surface. However, bowhead whales leave West Greenland before peak abundance of copepods occurs at the surface.
Keywords:Bowhead whale,Calanus, Copepods, Arctic, Greenland, Feeding, FastLoc GPS tags, Diving behavior
Background
Why bowhead whales (Balaena mysticetus), primarily fe-males without calves, spend time in Disko Bay, West Greenland in spring [1-3] is unknown. High vocalization rates suggest the area is a mating ground [4]; however, there are few males suggesting that there may be other explanations for whales spending time there. An alterna-tive explanation is spring feeding because of the prod-uctivity of the area; however, it is unclear why other age and sex classes do not also feed there [5].
Stomach contents from bowhead whales harvested in Disko Bay document that whales feed extensively, if not
exclusively, on calanoid copepods in spring [6]. Thus, the presence and behavior of copepods may be the key to understanding why whales spend time in Disko Bay in spring.
Bowhead whales range over large areas in the Eastern Canadian Arctic, Baffin Bay, and West Greenland. With a spring abundance of 1,410 whales, Disko Bay is cur-rently the only area in West Greenland where bowhead whales congregate in large numbers [5]. The bay’s im-portance may be linked to productivity. The western portion of the bay is located where the northward-flowing warm West Greenland Current meets the south-going Polar Current. This, in concert with early sea ice retreat and complex oceanographic and bathymetric
* Correspondence:[email protected]
1Greenland Institute of Natural Resources, Box 570, Nuuk 3900, Greenland Full list of author information is available at the end of the article
conditions, make Disko Bay particularly productive and attractive to many species [7].
The whales arrive in Disko Bay in January and February and depart in early June [3]. Individual whales use the bay for short periods (weeks to months) and often return in subsequent years [5,7]. Visits to Disko Bay, especially by mature females, must be of substantial importance to the entire population either because the area is a mating ground or because of optimal feeding opportunities. Understanding why some bowhead whales are attracted to Disko Bay may be useful for understanding habitat use.
We used satellite telemetry to track the surface move-ments of individual bowhead whales and high-resolution dive data from archival GPS tags to quantify the three-dimensional subsurface behavior of bowhead whales. In
situ echo soundings were conducted where bowhead whales were diving to determine prey availability.
Results and discussion
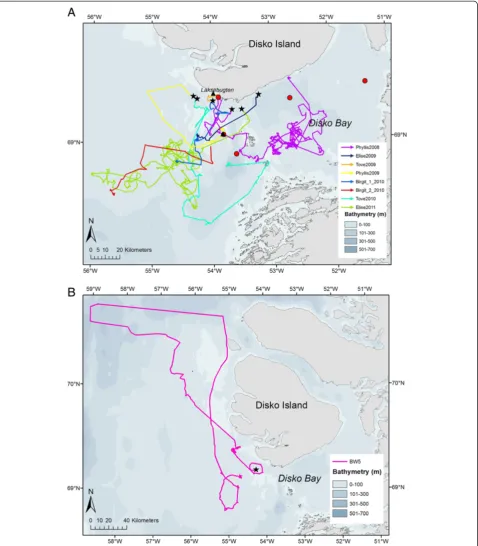
The nine instrumented whales extensively used the west-ern part of Disko Bay (Figure 1A); only one whale made a northbound excursion (31 March) to an area west of Disko Island before returning to Disko Bay on 25 April (Figure 1B).
This study augments a sample of archival dive data from bowhead whales collected in April and May 2003 and 2004 in Disko Bay. In the previous study deploy-ments were shorter (on average 12 hours) compared to an average deployment of 12 days in this study, which also included sampling in the month of March (Table 1) [2]. The long-term deployments enabled quantification of U-shaped feeding dives over periods of days and weeks.
A total of 7,607 dives targeting depths below 20 m were identified. Of those, 5,214 dives lasted longer than 300 s (Table 1). The percentage of V-dives of the U- and V-dives combined ranged between 9 and 55% with an overall average of 24%.
It was not possible to detect any significant differences in dive rate (both V- and U-dives) or differences in the maximum depths of dives for the 24 hr period after tag deployment compared to the entire deployment period for any of the whales. Thus the entire deployment period was used for subsequent analyses.
The V-dives had maximum depths (138 to 582 m) ex-ceeding the maximum depths of U-dives for all whales (Table 1). Few dives exceeded 300 m depth for any of the whales (<0.2%) and six of the whales made no dives below 250 m; only three whales made a few U-dives to depths between 250 and 427 m. U-shaped U-dives targeting depths between 20 and 30 m constituted on average 21% of the dives for all nine whales and 37% when the average was weighted by the number of dives in the samples (Figure 2).
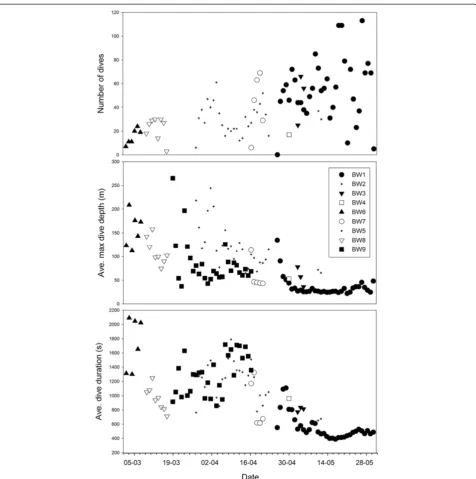
In general, there were changes in the U-shaped dive patterns over the duration of the study (between 7 March and 31 May) including differences in the num-ber of dives day-1, average maximum daily dive depth (m), and the average dive duration (s) for U-dives (Figure 3). However, not all whales followed the same trend and there was little temporal overlap between individuals. When data for all whales were examined there was a significant increase in the number of dives (a = 0.665,P= <0.0001, r2= 0.30) and a significant decline in the average dive duration (s) (a = −14.233, P = 0.0003, r2 = 0.14) be-tween 1 March and 30 May. The changes were strongly influenced by one whale (BW1) that provided the most data (number of dives) for the longest time period (through May).
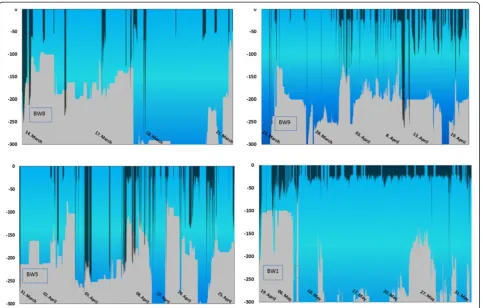
The four whales with deployments longer than 6 days were used to depict the target depths of U-dives relative to the seabed or bottom topography (Figure 4). BW8 had the shortest duration (7 days) but provided data in mid-winter. A major proportion of BW8’s U-dives (68%) occurred at depths near the seabed and few U-dives at depths <60 m indicated no specific shallow depths were targeted (Figure 5). Two whales (BW5 and BW9) pro-vided data from late March through mid-April that indi-cated that a mean dive depth of 20 to 30 m was most frequent among the U-dives <60 m. BW5 focused equal number of its U-dives to depths >60 m and <60 m (Figure 5). Another whale (BW9) provided data from 23 March through 19 April and only 38% of the dives from this individual reached depths at or close to the seabed. One whale in May (BW1) focused >90% of its U-dives to the 20 to 60 m depth range (Figures 3, 4, 5).
The sample of dive data from the nine whales provide data on diving activity between March and May, a period where significant changes in both primary production and copepod abundance at the top 50 m of the water column occur [8]. A natural split between the winter and spring situation occurs in late April, when approxi-mately 50% of the winter sea ice has retreated [7]. Five and four whales provided data during the winter (March and April) and spring period (May), respectively, and could be used for a comparison of dive parameters (Table 2). The rate of U-dives in winter was low indicat-ing long-lastindicat-ing deep dives with long bottom time, whereas in spring the dive rate more than doubled and the maximum depth of U-dives decreased significantly. Similarly the maximum depth of V-dives decreased sig-nificantly from winter to spring. The vertical speeds (ascent and descent rates) did not change for V-dives but the descent rate of U-dives increased significantly. During spring, when the whales were feeding at shallower depths, the distance from the deepest part of the U-dives to the seabed was significantly lower than winter. An earlier study [2] sampled the diving behavior
Heide-Jørgensenet al. Animal Biotelemetry2013,1:15 Page 2 of 13
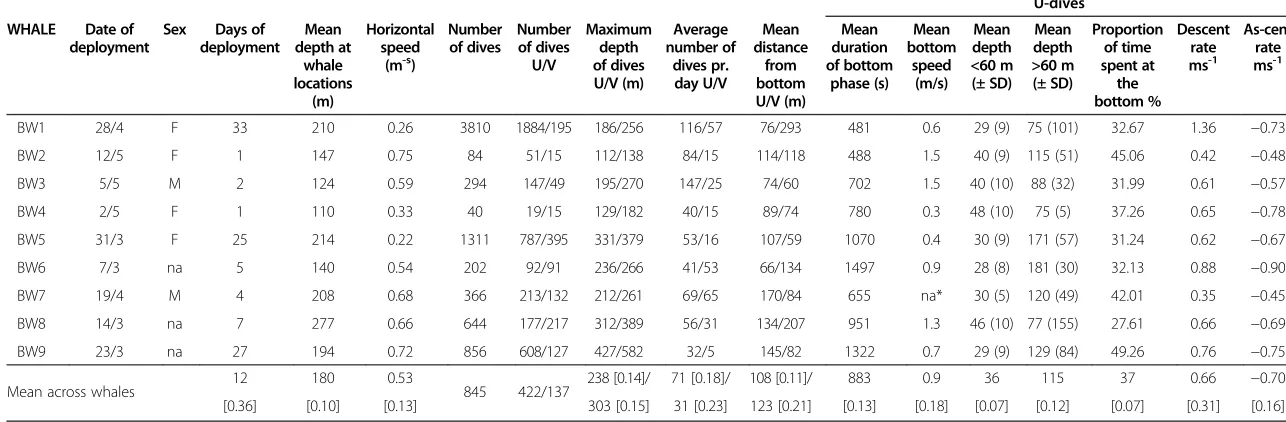
Table 1 Data on instrumented bowhead whales in Disko Bay
U-dives
WHALE Date of deployment
Sex Days of deployment Mean depth at whale locations (m) Horizontal speed
(m-s)
Number of dives Number of dives U/V Maximum depth of dives U/V (m) Average number of dives pr. day U/V Mean distance from bottom U/V (m) Mean duration of bottom phase (s) Mean bottom speed (m/s) Mean depth <60 m (± SD) Mean depth >60 m (± SD) Proportion of time spent at the bottom % Descent rate ms-1 As-cent rate ms-1
BW1 28/4 F 33 210 0.26 3810 1884/195 186/256 116/57 76/293 481 0.6 29 (9) 75 (101) 32.67 1.36 −0.73
BW2 12/5 F 1 147 0.75 84 51/15 112/138 84/15 114/118 488 1.5 40 (9) 115 (51) 45.06 0.42 −0.48
BW3 5/5 M 2 124 0.59 294 147/49 195/270 147/25 74/60 702 1.5 40 (10) 88 (32) 31.99 0.61 −0.57
BW4 2/5 F 1 110 0.33 40 19/15 129/182 40/15 89/74 780 0.3 48 (10) 75 (5) 37.26 0.65 −0.78
BW5 31/3 F 25 214 0.22 1311 787/395 331/379 53/16 107/59 1070 0.4 30 (9) 171 (57) 31.24 0.62 −0.67
BW6 7/3 na 5 140 0.54 202 92/91 236/266 41/53 66/134 1497 0.9 28 (8) 181 (30) 32.13 0.88 −0.90
BW7 19/4 M 4 208 0.68 366 213/132 212/261 69/65 170/84 655 na* 30 (5) 120 (49) 42.01 0.35 −0.45
BW8 14/3 na 7 277 0.66 644 177/217 312/389 56/31 134/207 951 1.3 46 (10) 77 (155) 27.61 0.66 −0.69
BW9 23/3 na 27 194 0.72 856 608/127 427/582 32/5 145/82 1322 0.7 29 (9) 129 (84) 49.26 0.76 −0.75
Mean across whales 12 180 0.53 845 422/137 238 [0.14]/ 71 [0.18]/ 108 [0.11]/ 883 0.9 36 115 37 0.66 −0.70
[0.36] [0.10] [0.13] 303 [0.15] 31 [0.23] 123 [0.21] [0.13] [0.18] [0.07] [0.12] [0.07] [0.31] [0.16]
Only dives lasting longer than 5 min and targeting depths below 20 m are included. BW1 to BW4 were assumed to represent spring samples and the rest assumed to be winter samples. Standard deviations in parenthesis and coefficients of variation in square brackets. *No positions matched the surface periods.
in April and May and it confirmed a significant trend toward shorter dive durations in May (Table 2).
The mean duration of the bottom phase of U-dives for all whales was 883 s (standard deviation (SD) = 15) or approximately 15 min and the whales traveled at a mean
speed of 0.9 ms-1during the bottom phase, correspond-ing to a linear distance of approximately 800 m.
There was little variability in the proportion of time spent at the bottom of the U-dives between individuals (average 37%, cv = 0.07) or in the mean depth of U-dives shallower than 60 m (36 m, cv = 0.07, Table 1). There was intermediate variability (cv's ranging between 0.1 and 0.2) for the duration of the bottom phase (883 s) and distance to the seabed (108 m) for U-dives. The percentage of the entire dive duration that was spent on descent and ascent to the bottom of the U-dives (>75% of the maximum depth of the dive) was remarkably consistent between in-dividuals with an overall average of 9% (cv = 0.08, range 5 to 12%) for descent time and 7% (cv = 0.09, range 4 to 11%) for ascent time, indicating that allocation of transit time remained constant independent of target depth. The whales also spent considerably less time (16%) on transit than what is used to identify the U-dives (that is transit assumed to be <34% of the dive duration). Thus the ac-tual observed U-dives were steeper than the criteria established for a U-dive in this study. The largest vari-ability between individuals was found in the number of V-dives (cv = 0.23) and the mean distance from the bottom of V-dives to the seabed also showed large vari-ability (cv = 0.21) between individuals.
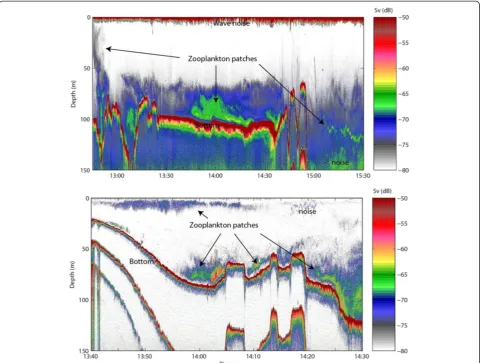
Echo sounding data indicated that zooplankton were distributed in patches, with most patches detected near the seabed (depths >100 m). No net sampling was conducted because it was not possible to sample these locations with available techniques. A comparison with the surface backscatter indicated that the density of co-pepods was considerably lower at the surface compared to the bottom at the time of the acoustic surveys (Figure 6, lower panel).
Apparently bowhead whales shifted their foraging in Disko Bay from deep water in winter (where they were presumably feeding on pre-ascension or hibernating cope-pods) to shallower water later in the spring (where they were presumably feeding on copepods ascending to the surface). No specific localities were targeted by the whales and the whales used much of Disko Bay, including off-shore areas north and west of the bay, for their foraging activities. Also there was considerable variability between individuals in their preference of depth habitat. Depths at whale locations ranged between 110 and 277 m, with maximum depths between 111 and 582 m. The depth at whale locations are estimates, because depth can only be determined when whales are at the surface. In addition, the bathymetry of Disko Bay and adjacent waters is com-plex and poorly described, especially at the level of detail needed for locating the dives of the whales in relation to the sea floor. Some dives appear to go below the seabed (Figure 4), which is a function of poor bathymetry data and complex bottom topography.
Regardless of the uncertainty about the exact bottom depth, the whales operated in two different modes during presumed foraging dives (U-dives). Some of the U-dives targeted the upper water column at depths from 20 m (the upper threshold used to extract the U-dives) down to about 50 m with a remarkably consistent mean of 30 m as was the case for most of the dives during April and May. The maximum depth of U-dives reached depths closer to the seabed in spring than in winter but part of this may be due to the uncertain bottom contours.
Biological studies of the marine ecosystem in Disko Bay have documented the seasonal cycle in the ascent and descent pattern of copepods. In Disko Bay,Calanus spp. hibernate at depth probably close to the seabed and ascend to depths of 0 to 50 m in April to June during and after primary production begins in April to June, when bowhead whales feed [8]. The echo sounding data were limited, but showed a patchy vertical distribution of zooplankton with considerably higher densities near the seabed (depths >100 m) than near the surface.
Figure 3Temporal changes in the daily number of U-dives (upper panel), average of maximum depths of U-dives (middle panel), and duration of U-dives (lower panel).
Heide-Jørgensenet al. Animal Biotelemetry2013,1:15 Page 6 of 13
Ascending Calanus spp., however, may be advected onto shallow shelf areas where they can be found both close to the seabed and in the water column. For ex-ample, in late spring, BW1 mainly dove over deep water with mean depths of 210 m. The main diving depth, however, was <30 m and the whale did not dive close to the seabed.
In contrast, the winter samples from whales BW5 and BW8 showed that they concentrated a large proportion of their dive activity near the seabed. They were both lo-cated in areas that averaged >200 m in depth and their U-dives likely targeted copepods at or near the seabed.
The number of U-dives per hour increased signifi-cantly from March and April to May confirming that the whales were submerged for longer periods (>18 min dive-1) when feeding at greater depths during winter. Similarly, the average duration of the bottom phase of the U-dives declined significantly between winter and spring. However, the overall proportion of time spent at the bottom of U-dives was similar for both periods confirming that the higher dive rate in spring compen-sated for the lower average duration of the bottom phase of dives. The speed during the bottom phase of U-dives was 0.9 ms-1 or similar to values collected from
right whales, Eubalaena glacialis, [9] but both studies rely on the assumption of a straight-line path between the diving and surfacing positions of the U-dives, thus actual speed during feeding may be higher.
Despite the apparent seasonal changes in dive pat-terns, there was a remarkable consistency among indi-vidual whales, evident in the low coefficients of variation of the means of several dive parameters, indicating a uniform choice of target depth, dive duration, and rates of vertical displacement. The most consistent was the proportion of time spent at the bottom phase of feeding or U-dives (presumable feeding dives). This suggests that whales allocate a fixed proportion of dive time (approxi-mately 37%) in Disko Bay in winter and spring, inde-pendent of other activities (horizontal displacement and deep or shallow V-dives) to the feeding portion of a feeding dive. In comparison, North Atlantic right whales, which also feed on copepods, spend about 40% of their time on feeding at the bottom of U-shaped dives [9].
The whales moved at a low horizontal speed of <2 km hr-1 while traveling between feeding sites and the com-bination of the number of dives hr-1 and the speed of horizontal displacement could possibly be used as an in-dicator of potential feeding areas. However, no data are
available from other areas that can be compared to Disko Bay, therefore the relative importance of this area as a feeding ground cannot be assessed.
In winter, the depths of U-dives, presumed to be for-aging dives, ranged between 50 and 250 m and were close to the seabed. These dives could be explained by whales feeding on a dense layer of copepods in diapause near the seabed. In spring, the dives targeted depths shallower than 50 m, presumably in search of concentra-tions of ascending copepods. The switch between the two target depths of U-dives is likely a response to in-creased availability of prey nearer the surface but there could be other synergistic explanations, such as whales reducing the energetic costs associated with long dives to greater depths. However, the cost of diving deeper should
be balanced by the benefit of feeding on higher densities of copepods than can be found at the surface [10].
About 1,400 bowhead whales spend approximately 2 months in Disko Bay each year. Using data from the tagged whales, each whale spent on average about 500 hrs in the bottom phase of U-dives, presumably filtering water while moving at 0.9 ms-1with an open-mouth area of 4.23 m2[11]. The estimated amount of water filtered during the 2 months would equal 8 million m3water per whale. Laidreet al. [2] estimated that the copepod density in waters <60 m deep to be 0.001 kg m-3, which is inad-equate for maintaining the estimated field metabolic rate of bowhead whales unless more than 800,000 m3of water is filtered daily. This daily filtration volume would not be possible at the horizontal speeds of the bottom phase of
Figure 5U-dives for bowhead whales below 60 m focused on depths at or close to the seabed.Zero indicates that the dive reached the seabed at the position of the whale. Negative values indicate the depth difference or distance from the maximum depth of the dive to the seabed at the position of the whale. Positive values indicate dives deeper than the seabed and are due to coarse data on the bottom contours in Disko Bay.
Heide-Jørgensenet al. Animal Biotelemetry2013,1:15 Page 8 of 13
U-dives (0.9 ms-1) measured in this study. Thus, the field metabolic rate and any other extra energetic demands of bowhead whales in Disko Bay can only be met if the whales feed on much higher copepod densities located in patches, likely near the seabed. Kenney et al. [12] sug-gested that foraging in North Atlantic right whales must occur on dense and discrete layers of zooplankton to meet the energetic requirements, and generally marine preda-tors rely on local patches or clusters of patches of prey rather than on areal average prey densities [13]. This study suggests that bowhead whales spend a consider-able amount of time feeding close to the seabed where copepod densities are higher than densities closer to the surface. Later in the season, when the copepods have been advected onto the shelf, the whales can feed on copepod concentrations in shallower water where they may be less dense but less energy is required to feed on them.
In Disko Bay, some copepods move toward the sur-face in spring to feed on phytoplankton during the bloom [11,14], but many are still available for the bow-head whales at the seabed. Bowbow-heads leave Disko Bay
before peak numbers of copepod appear near the sur-face [3] and while it seems odd that bowhead whales do not take advantage of this surface feeding oppor-tunity, the reasons may include 1) the density of cope-pods at the surface may be too low, 2) the quality of the copepods may be too low, or 3) the energetic needs of the bowheads may have been secured during their winter foraging on copepods in diapause.
Conclusion
This study provides information on the seasonal variabil-ity of the diving behavior of a baleen whale presumably in response to changes in vertical distribution of prey. The feeding behavior of bowhead whales in winter (March and April) was characterized by few long-lasting deep dives targeting depths at or close to the seabed. This shifted to more frequent and shorter dives targeting shallower depths in spring (May). In both winter and spring about one-third of the whales’ time was spent on the bottom phase of U-dives, which is assumed to represent feeding. The mean of the maximum depth of U-dives declined significantly from 342 m in winter to
Table 2 Comparison of mean dive parameters from two periods winter (March and April, whales BW1 to BW4) and spring (May, whales BW5 to BW9) from this study and from earlier data collected from bowhead whales in Disko Bay between 2001-2006, also reported in [2]
Dive parameter Weight Winter Spring Significance
Data from this study:
Mean depth of U-dives >60 m (m) Number of U-dives 143 77 **
Mean depth U-dives <60 m (m) Number of U-dives 31 30
Max depth of U-dives (m) Number of U-dives 342 184 **
Max depth of V-dives (m) Number of V-dives 381 248 *
Vertical speed of U-dives; descent rate (ms-1) Number of U-dives 0.65 1.28 *
Vertical speed of U-dives; ascent rate (ms-1) Number of U-dives −0.68 −0.72
Vertical speed of V-dives; descent rate (ms-1) Number of V-dives 0.45 0.30
Vertical speed of V-dives; ascent rate (ms-1) Number of V-dives −0.41 −0.27
Distance to seabed of V-dives (m) Number of V-dives 106 230
Distance to seabed of U-dives (m) Number of U-dives 127 77 *
Overall dive rate (dives hr-1) Deployment duration 2.07 4.76 ***
Dive rate of V-dives (dives hr-1) Deployment duration 1.15 0.95
Dive rate of U-dives (dives hr-1) Deployment duration 1.86 4.75 ***
Bottom time of U-dives (dives hr-1) Number of U-dives 1092 499 ***
Proportion of time spent in the bottom of U-dives (%) Number of U-dives 38 33
Duration of all dives below 20 m (min) Number of U-dives 19.7 9.5 ***
Data from [2], n = 6 in winter (April) and 8 in spring (May): April May
Mean depth of all dives below 12 m (m) Deployment duration 81 68
Max depth of all dives below 12 m (m) Deployment duration 238 233
Maximum duration of all dives below 12 m (min) Deployment duration 39.0 21.6 ***
Duration of all dives below 12 m (min) Deployment duration 15.1 9.7 **
approximately 184 m in spring and the number of U-dives increased significantly from approximately 2 hr-1 in winter to approximately 5 hr-1 in spring probably reflecting the shallower target depths for U-dives in spring. Calculations of time spent and horizontal speed at the bottom indicate that high copepod densities would be required to support the energetics of such diving activity. Higher copepod densities available during winter, when copepods are inactive and have high caloric content due to the oil stored during diapause, may provide high-quality feeding opportunities for bowheads in winter and although copepods come near the surface in spring both their lower density and their caloric content may provide poor-quality feeding opportunities.
Methods
Nine bowhead whales were instrumented with Fastloc GPS retrievable data and dive loggers (Wildlife Com-puters, Redmond, WA, USA) that monitored their move-ment and diving behavior over periods of 1 to 33 days at
high spatial and temporal resolution in Disko Bay, West Greenland (Table 1, Figure 1), from March to May, 2008 to 2011. The tags combined measuring depths (± 0.5 m) at 1 Hz intervals and facilitated acquisition and storage of Fast GPS signal snapshots (<100 mS, Wildtrack Telemetry Systems Ltd., Leeds, UK) consisting of digitized GPS downlink signals stored in raw form. The tags were also equipped with an Argos UHF transmitter providing posi-tions through the Argos Data Collection and Location System (CLS, Ramonville-Saint-Agne, France) to provide general daily locations and a VHF transmitter (Advanced Telemetry Systems Inc., Isanti, MN, USA) for radio track-ing on a fine scale to locate and retrieve the tag. The elec-tronic package was assembled with flotation that ensured antennas were out of the water when the package was at the surface (Figure 7).
The tag package was attached to a stainless steel an-chor and was deployed on the whales using an 8 m fiber-glass pole from a boat. The anchors cut through and entered the blubber of the whale to a depth of
Figure 6Example of echo sounding data (200 kHz) from two different locations in western Disko Bay, on 6 and 12 May 2009.The zooplankton is distributed in patches (marked with arrows) and the highest densities are located close to the bottom.
Heide-Jørgensenet al. Animal Biotelemetry2013,1:15 Page 10 of 13
approximately 15 cm and the tag package was attached by a 1 m wire. When swimming, the whale towed the tag along (Figure 7). Tags remained attached to the whales for 1 to 33 days depending on how quickly hydrostatic drag pulled the anchor out. Based on Argos positions, the approximate geographic location of the drifting tag was determined and then the final approach and pickup was facilitated by tracking the VHF signal.
Data were downloaded (Fast-GPS signals and sensor data) from retrieved tags before the tags were redeployed. Real positions were achieved by post-processing of‘ ephem-eris’and‘almanac’data from the Fast-GPS snapshots with Wildlife Computers Fast-GPS Solver Program. Dive data were analyzed with MultiTrace-Dive (Jenson Software Systems, Laboe, Germany).
Several criteria were used to determine whether a dive qualified as a potential feeding dive. A 20 m and >300 s duration threshold was used to distinguish surface be-havior from a dive long enough to potentially be a feed-ing dive. Surface feedfeed-ing (>20 m) as described for bowhead whales in Alaska [15] has not been observed in West Greenland where zooplankton is unlikely to be present in large amounts above the pycnocline at ap-proximately 20 m depth [2]. Two classes of dives were analyzed: U-shaped and V-shaped dives. Other less
common (W- and Y-shaped) dives constituted <6% of dives and were not included in the analysis.
A U-shaped dive (hereafter called U-dive) consisted of three phases: 1) a descending phase, 2) a bottom phase, and 3) an ascending phase. U-dives were assumed to be
‘foraging dives’ due to the prolonged duration at a con-sistent depth. Both observation studies and energetic calculations support the notion that U-shaped dives are primarily foraging dives [9,10,16,17]. V-dives were con-sidered exploratory dives due to the short time spent at the deepest part of the dive. U- and V-dives were defined by their depth and duration. A dive was classified as a U-dive if >66% of the dive duration was spent at >75% of maximum dive depth. A dive was classified as a V-dive if <66% of the V-dive duration was spent at >75% of the maximum dive depth. The relationship between bot-tom and surface time was conservative to avoid overesti-mates of the number of U-dives. More U-shaped dives would have been obtained if the threshold depth or the relationship between bottom and surface time had been set at lower values. The bottom phase of a U-dive was initiated when the vertical speed of the whale was less than 0.35 ms-1. Tuning of threshold parameters was based on visual inspection of the dives after examining multiple runs of different classification scenarios. The
A
B
C
tuning allowed a more critical assignment of the U-dives and reduced the risk of including non-foraging dives with an almost U-shaped appearance. Changes of threshold parameter combinations of ±10% gave, however, only small variations in the number of identified U-dives and results were therefore considered insensitive to the classification.
The following dive parameters were extracted from the time-depth recorder time series for each individual: number and duration of U- and V-dives, dive rate (that is number of dives hr-1), maximum depth of dives, dur-ation and proportion of time spent at the bottom phase of U-dives, percentage of the U-dive duration spent on vertical displacement (descent and ascent time), descent and ascent rates, and duration of U and V-dives.
Horizontal speed on the bottom of U-dives was deter-mined using the pre- and post-dive GPS positions of the whale at the surface. Only positions achieved shortly before and after the dive (a tolerance of ± 1 min) were included in the calculations, and the duration of the bottom phase was estimated from the initiation and completion of the bottom phase of the U-dive. The cal-culations were made under the assumption that the des-cent and asdes-cent to and from the bottom part of the dive was performed in an almost vertical manner with limited horizontal displacement from the surface GPS positions, assuming negligible current, and a close to linear swim-ming path during the bottom phase.
Dive behavior observed shortly after deployment (<24 hr) was compared to the entire deployment period and the differences in number of dives and dive depth (for both U- and V-dive events) were tested.
The maximum bathymetric depth at each GPS pos-ition was extracted from the International Bathymetric Chart of the Arctic Ocean (IBCAO) bathymetric data [18] and matched to the median depth of the bottom phase of U-dives. The maximum dive depth of U-dives of four whales with deployment periods >6 days were plotted in relation to the depths of the seabed at the time and position of the initiation of the dives.
Sex of the whales was determined from skin biopsies collected simultaneously with the instrumentation fol-lowing genetic methods described in [1].
Two seasons were contrasted: winter (March and April) and spring (May). Linear regression, ANOVAs, andttests were used for comparing seasons and testing trends over time and statistical significance was evaluated on a 5% level. Dive parameters were averaged for each whale and inter-whale averages were weighted by the duration of the data sampling or the number of dives.
Zooplankton detections
Detection of zooplankton patches was conducted using a Simrad EK60 echo sounder (Simrad, Horten, Norway)
with 120 and 200 kHz transducers. These high frequen-cies were selected because they are optimal frequenfrequen-cies to detect zooplankton, however, with a limited detection range (approximately 150 m). The acoustic sampling took place between 5 and 13 May 2009 (Figure 1) within the area used by bowhead whales, using a small vessel moving at approximately 2 ms-1. The echo sounder was calibrated during the same period. Acoustic signals were allocated to zooplankton according to strength and fre-quency response of the acoustic backscatter and appear-ance on the echogram and verified by 29 vertical net (WP2) hauls in Laksebugten (see Figure 1A).
Ethics
This study was conducted under the general permission from the Greenland Government to the Greenland Institute of Natural Resources for tagging of baleen whales.
Competing interests
The authors declare that they have no competing interests.
Authors’contributions
MPHJ and KLL conceived the study. MPHJ developed the instrument package, the instrumentation technique and conducted the field work together with KLL and NHN. AR did the echo sounding surveys. NHN and RGH did the data extraction and analysis and MPHJ, NHN and KLL prepared the manuscript. All authors read and approved the final manuscript.
Acknowledgements
This study was funded by the Commission for Scientific Research in Greenland, the National Ocean Partnership Program (Office of Naval Research and US National Science Foundation), the Vetlesen Foundation, and the Greenland Institute of Natural Resources. We thank Abel Brandt, Ado Isaksen, Johannes Mølgård and Tarfi Mølgård for assistance with deployment and retrieval of tags and Mikkel Villum Jensen for modifying the instruments for use on bowhead whales. The University of Copenhagen kindly provided access to their facilities including R/V Porsild in Qeqertarsuaq.
Author details
1Greenland Institute of Natural Resources, Box 570, Nuuk 3900, Greenland. 2
Polar Science Center, Applied Physics Laboratory, University of Washington, 1013 NE 40th Street, Seattle, WA 98105, USA.3King Abdullah University of Science and Technology, Jeddah 23955-6900, Saudi Arabia.4Department of Biosciences, University of Oslo, PO Box 1066, Blindern N-0316, Oslo, Norway.
Received: 16 April 2013 Accepted: 13 August 2013 Published: 23 October 2013
References
1. Heide-Jørgensen MP, Laidre KL, Wiig Ø, Postma L, Dueck L, Bachmann L: Large scale sexual segregation of bowhead whales.Endang Species Res
2011,13:73–78.
2. Laidre KL, Heide-Jørgensen MP, Nielsen TG:Role of bowhead whale as a predator in West Greenland.Mar Ecol Prog Ser2007,346:285–297. 3. Laidre KL, Heide-Jørgensen MP:Spring partitioning of Disko Bay, West
Greenland, by Arctic and Subarctic baleen whales.ICES J Mar Sci2012, 69:1226–1233.
4. Stafford KM, Moore SE, Laidre KL, Heide-Jørgensen MP:Bowhead whale springtime song off West Greenland.J Acoust Soc Am2008,125:3315–3323. 5. Wiig Ø, Heide-Jørgensen MP, Lindqvist C, Laidre KL, Postma ID, Dueck L,
Palsbøll PJ, Bachmann L:Recaptures of genotyped bowhead whales
Balaena mysticetusin eastern Canada and West Greenland.Endang Species Res2011,14:235–242.
6. Heide-Jørgensen MP, Garde E, Nielsen NH, Andersen ON:Biological data from the hunt of bowhead whales in West Greenland 2009 and 2010.
J Cetacean Res Manage2012,12:329–333.
Heide-Jørgensenet al. Animal Biotelemetry2013,1:15 Page 12 of 13
7. Heide-Jørgensen MP, Laidre KL, Logsdon ML, Nielsen TG:Springtime coupling between phytoplankton, sea ice, and sea surface temperature in Disko Bay, West Greenland.Prog Oceanogr2007,73:79–95.
8. Madsen SD, Nielsen TG, Hansen BW:Annual population development and production byCalanus finmarchicus,C. glacialisandC. hyperboreusin Disko Bay, western Greenland.Mar Biol2001,139:75–93.
9. Baumgartner MF, Mate BR:Summertime foraging ecology of North Atlantic right whales.Mar Ecol Prog Ser2003,264:123–135.
10. Houston AI, Carbone C:The optimal allocation of time during the diving cycle.Behav Ecol1992,3:255–265.
11. Werth AJ:Models of hydrodynamic flow in the bowhead whale filter feeding apparatus.J Exp Biol2004,207:3569–3580.
12. Kenney RD, Hyman MAM, Owen RE, Scott GP, Winn HE:Estimation of prey densities required by North Atlantic right whales.Mar Mam Sci1986,2:1–13. 13. Benoit-Bird KJ, Battaile BC, Heppell SA, Hoover B, Irons D, Jones N, Kuletz KJ,
Nordstrom CA, Paredes R, Suryan RM, Waluk CM, Trites AW:Prey patch patterns predict habitat use by top marine predators with diverse foraging strategies.PloS ONE,8:e53348. doi:10.1371/journal.pone.0053348. 14. Swalethorp R, Kjellerup S, Dünweber M, Nielsen TG, Møller EF, Rysgaard S,
Hansen BW:Grazing, egg production, and biochemical evidence of differences in the life strategies ofCalanus finmarchicus,C. glacialisand
C. hyperboreusin Disko Bay, western Greenland.Mar Ecol Prog Ser2011, 429:125–144.
15. Moore S, Craig George JC, Sheffield G, Bacon J, Ashjian C:Bowhead whale distribution and feeding near Barrow, Alaska, in late summer 2005–06.
Arctic2010,63:195–205.
16. Le Boeuf BJ, Costa DP, Huntley AC, Feldkamp SD:Continous, deep diving in female northern elephant seals,Mirounga angustirostris.Can J Zool
1988,66:446–458.
17. Nowacek DP, Johnson MP, Tyack P, Shorter KA, McLellan WA, Pabst DA: Buoyant balaenids: the ups and downs of buoyancy in right whales.
Proc R Soc Lond2001,B268:1811–1816.
18. Jakobsson M, Macnab R, Mayer L, Anderson R, Edwards M, Hatzky J, Schenke HW, Johnson P:An improved bathymetric portrayal of the Arctic Ocean: Implications for ocean modeling and geological, geophysical and oceanographic analyses.Geophys Res Let2008,35:L07602.
doi:10.1186/2050-3385-1-15
Cite this article as:Heide-Jørgensenet al.:Winter and spring diving behavior of bowhead whales relative to prey.Animal Biotelemetry 20131:15.
Submit your next manuscript to BioMed Central and take full advantage of:
• Convenient online submission
• Thorough peer review
• No space constraints or color figure charges
• Immediate publication on acceptance
• Inclusion in PubMed, CAS, Scopus and Google Scholar
• Research which is freely available for redistribution


![Table 2 Comparison of mean dive parameters from two periods winter (March and April, whales BW1 to BW4) andspring (May, whales BW5 to BW9) from this study and from earlier data collected from bowhead whales in Disko Baybetween 2001-2006, also reported in [2]](https://thumb-us.123doks.com/thumbv2/123dok_us/349031.1527438/10.595.58.539.123.445/comparison-parameters-periods-andspring-collected-bowhead-baybetween-reported.webp)