www.the-cryosphere.net/5/95/2011/ doi:10.5194/tc-5-95-2011
© Author(s) 2011. CC Attribution 3.0 License.
The Cryosphere
An improved bathymetry compilation for the Bellingshausen Sea,
Antarctica, to inform ice-sheet and ocean models
A. G. C. Graham1, F. O. Nitsche2, and R. D. Larter1
1Ice Sheets programme, British Antarctic Survey, High Cross, Madingley Road, Cambridge, CB3 0ET, UK 2Lamont Doherty Earth Observatory of Columbia University, 61 Route 9W, Palisades, New York, 10964, USA Received: 30 September 2010 – Published in The Cryosphere Discuss.: 15 October 2010
Revised: 14 January 2011 – Accepted: 3 February 2011 – Published: 16 February 2011
Abstract. The southern Bellingshausen Sea (SBS) is a
rapidly-changing part of West Antarctica, where oceanic and atmospheric warming has led to the recent basal melting and break-up of the Wilkins ice shelf, the dynamic thin-ning of fringing glaciers, and sea-ice reduction. Accurate sea-floor morphology is vital for understanding the contin-ued effects of each process upon changes within Antarc-tica’s ice sheets. Here we present a new bathymetric grid for the SBS compiled from shipborne multibeam echo-sounder, spot-sounding and sub-ice measurements. The 1-km grid is the most detailed compilation for the SBS to-date, reveal-ing large cross-shelf troughs, shallow banks, and deep inner-shelf basins that continue inland of coastal ice shelves. The troughs now serve as pathways which allow warm deep water to access the ice sheet in the SBS. Our dataset highlights ar-eas still lacking bathymetric constraint, as well as regions for further investigation, including the likely routes of palaeo-ice streams. The new compilation is a major improvement upon previous grids and will be a key dataset for incorpo-rating into simulations of ocean circulation, ice-sheet change and history. It will also serve forecasts of ice stability and fu-ture sea-level contributions from ice loss in West Antarctica, required for the next IPCC assessment report in 2013.
1 Introduction
Contributions to sea level from 21st Century changes in the West Antarctic ice sheet (WAIS) will form a key part of the Fifth Assessment Report of the IPCC due in 2013. Glaciolo-gists, oceanographers, modellers and geologists are currently working in tandem to better constrain the modern-day
thin-Correspondence to: A. G. C. Graham
ning and acceleration of the WAIS, measure changes to its glaciers and ice shelves at ocean margins, and estimate the impacts of future changes on the environment (including sea level), with implications for society as a whole (e.g. Over-peck and Weiss, 2009).
A concerted focus of West Antarctic studies is on the southern Bellingshausen Sea (SBS), fed by ice draining the WAIS as well as the adjoining Antarctic Pensinusla Ice Sheet, where major changes are already taking place (Fig. 1a). In May 2008 the Wilkins ice shelf dramati-cally disintegrated and recent satellite measurements of ice-surface elevation have indicated that glaciers which drain into the SBS have undergone dynamic thinning (thinning as a result of flow acceleration) related to warming deliv-ered through the oceans (Rignot and Jacobs, 2002; Pritchard et al., 2009), and as a result of the southerly migration of regional isotherms (i.e. atmospheric warming; Cook and Vaughan, 2010). A major ice stream, Ferrigno Glacier, which drains into Eltanin Bay, thinned by more than 0.5 m yr−1 be-tween 2003–2007 (Pritchard et al., 2009) and currently ex-hibits thinning rates of ca.−6 m yr−1at its grounding line. Oceanographic data have also shown the SBS is a key area where warm Circumpolar Deep-Water (CDW; temperature
≥1.0◦C, salinity 34.7 psu) periodically floods onto the shelf (Talbot, 1988; Jenkins and Jacobs, 2008), and coupled ther-modynamic models indicate that ice shelves in the SBS have been thinning rapidly as a result of basal melting, possibly for some decades (Holland et al., 2010). Reduction in sea ice since the 1970s is another indicator that the SBS is undergo-ing considerable environmental stress (Jacobs and Comiso, 1997). Thus it is of little surprise that a major focus of UK and US environmental research is the fast-changing SBS area.
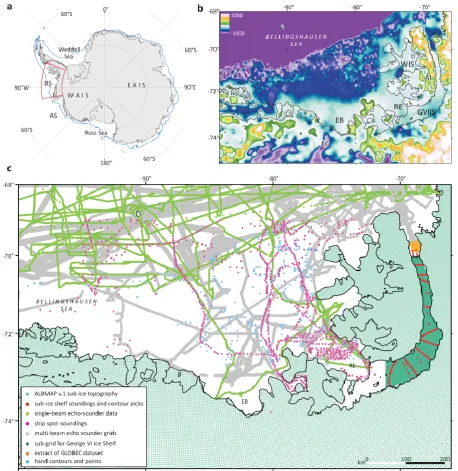
Fig. 1. (a) Location map showing the Antarctic ice sheets, the continental shelf edge (blue) and area covered by the new bathymetry grid
(red); South Pole Stereographic projection. (b) Existing bathymetry in the Bellingshausen Sea rendered from ALBMAP v.1.1. (Le Brocq et al., 2010). WGS84 Mercator projection. EB: Eltanin Bay; FG: Ferrigno Glacier; RE: Ronne Entrance; WIS: Wilkins Ice Shelf; AI: Alexander Island; GVIIS: George VI Ice Shelf (c) data types and their distribution for the new bathymetric compilation; coastline drawn from the ADD v.4.1. Table 1 provides additional details. WGS84 Mercator projection.
heat to the ice sheet (e.g., Thoma et al., 2008). In addi-tion, without realistic boundary conditions, models will not simulate the evolution of the ice sheets accurately and may misrepresent future contributions to climate change or sea level as a result. In the SBS, the current landscape be-neath the ice is underexplored and poorly known despite an ever-increasing ability to quantify subglacial topography
and ocean circulation. A recent compilation of Antarctica’s bed by Le Brocq et al. (2010) highlighted the weakness of bathymetry in regional compilations of Antarctic topogra-phy (Fig. 1b). While some regions are now well represented (e.g. the Amundsen Sea; Nitsche et al., 2007), the gridded bathymetry from the SBS remains inadequate for showing how the ice and ocean interact there. An improved topogra-phy for the sea floor was recently presented by Timmerman et al. (2010), but the grid was based on only a handful of the available sounding datasets for the embayment and failed to resolve some of the key topographic features clearly in-cluding the outline of the shelf break. Better bathymetry is needed urgently for this region, given that models of changes in the cryosphere (including the ice-sheet and ocean) will di-rectly inform the next IPCC assessments of climate change and sea-level rise.
In this paper, a new bathymetric grid is presented for the continental shelf and slope for the region 100–66◦W, 75– 68◦S in the Bellingshausen Sea (Fig. 1a). Existing grids for the area show a variety of different topographies but none clearly define the detailed morphology of the shelf, includ-ing the shelf edge and major cross-shelf troughs that have been partially imaged on multibeam echo-sounder data in the area (e.g. ´O Cofaigh et al., 2005b; Dowdeswell et al., 2008; Noormets et al., 2009).
2 Approach and method
Syntheses of depth soundings into representations of sea-floor topography have traditionally been carried out by hy-drographers who draw contour maps by hand to portray in-ferred morphology (Sandwell et al., 2001). However, these methods are imprecise and often non-reproducible. An al-ternative and successful method for producing bathymetry in deep ocean areas is to apply an inversion to satellite gravity data, but there are severe limitations to recovering sea-floor topography from radar altimetry: namely, its moderate res-olution and problems of noise in gravity anomaly measure-ments of the ocean surface slope (Smith and Sandwell, 1994; Macnab, 2009). This is particularly the case along polar con-tinental margins, as in the SBS, where sea-ice cover and vari-ations in thickness of the crust and sedimentary strata are sig-nificant factors affecting the gravity anomaly field. Further-more bathymetry data generated from inversion of Geosat data do not extend beyond 72◦S. Therefore, for the purpose of regional ice or ocean modelling on a continental shelf we consider the best bathymetric representation to be derived principally from in situ shipborne measurements.
We followed a procedure established by other work-ers to produce a bathymetric compilation for the Belling-shausen Sea. Our approach mirrors closely that of Nitsche et al. (2007), Fretwell et al. (2009) and Beaman et al. (2011), aggregating ship soundings from many expeditions and
com-bining them with other spatial data (sub-ice, sub-ice-shelf and land) to produce a continuous regional chart (Fig. 1c).
As primary context, sub-ice “bed” elevation data were ex-tracted from ALBMAP v.1 (LeBrocq et al., 2010) masked to the ice fronts and coastline drawn from the Antarctic Digital Database v.4.1. We converted the 5-km netcdf grid to xyz points and added these to our input dataset. Next, multibeam data were gridded at 300-m cell size using the mbgrid tool in MB-system (Caress and Chayes, 2006) with a Gaussian weighted averaging function and allowed a free interpolation to the limit of 2 grid cells (0.6-km radius; N.B. version 1.1. of the grid). The grid included new swath bathymetry tracks collected by the RRS James Clark Ross in 2008 and RV Oden in 2009/2010. The majority of multibeam datasets had al-ready been ping-edited to ensure removal of spurious data prior to our obtaining them for inclusion in the compilation. Single beam echo-sounding data were compiled from a num-ber of additional cruises of the James Clark Ross, RV
Natha-nial B. Palmer, RV Eltanin, RV Polar Duke, and RV Po-larstern (Table 1) and included in the grid. Ship-based spot
soundings from the Bellingshausen Sea UK Hydrographic Office Collector’s Sheet were also digitised and added to the dataset (Fig. 1c). These single soundings are particularly sig-nificant in areas where multibeam coverage is lacking and soundings from other scientific cruises are sparse.
To the west of the study area there are few data points to constrain topography and here we steered the grid to-wards a shelf edge shape that is consistent with the satellite-derived gravity anomaly field by adding a−580 m contour approximating the shelf-edge from the Smith and Sandwell gravity-derived topographic grid (Smith and Sandwell, 1997; Fig. 1c). However our use of these data was minimal, amounting to ca. <0.001% of the total dataset (11 points from a total of∼1 400 000). In addition, we digitised sub-ice shelf topography from Maslanyj’s (1987) seismic soundings of the George VI Ice Shelf (GVIIS) and removed inaccurate shallow soundings from the ALBMAP point-set (inherited from BEDMAP) using a mask tool. To avoid aliasing issues due to its narrow rift walls, we gridded the bathymetry of GVIIS separately to the remainder of the grid with a mini-mum curvature spline at 1-km grid spacing. The resulting raster was integrated into the compilation before final grid-ding.
Table 1. Data sets used in the new bathymetry compilation. SBES: single-beam echo sounder data; MBES: multibeam echo-sounder data;
PI (Principal Investigator).
Data set Accuracy estimate
Type Cruise/ID Year Vert. Horiz. Referencef
Sub-ice ALBMAP v.1 (5 km grid) 2010 N/A N/A Le Brocq et al. (2010)
topography Maslanyj GVIIS soundings 1987 N/A N/A Maslanyj (1987)
Maslanyj contours, digitised 1987 N/A N/A Maslanyj (1987)
(selected points)
MBES JR59 2001 1–8 ma 5 ma O Cofaigh et al. (2002)´
JR71 2002 1–8 ma 5 ma O Cofaigh et al. (2005b)´
JR84 2003 1–8 ma 5 ma A. Jenkins (PI)
JR104 2004 1–8 ma 5 ma O Cofaigh et al. (2005a)´
JR141 2006 1–8 ma 5 ma Larter et al. (2007)
JR157 2007 1–8 ma 5 ma Noormerts et al. (2009)
JR165 2007 1–8 ma 5 ma D. Shoosmith (PI)
JR179 2008 1–8 ma 5 ma Graham et al. (2010)
NBP9902 1999 1–8 ma 5 ma Wellner et al. (2001)
NBP0001 2000 1–8 ma 5 ma Anderson et al. (2002)
NBP0103 2001 1–8 ma 5 ma P. Wiebe (PI)
NBP0104 2001 1–8 ma 5 ma P. Wiebe (PI)
NBP0105 2001 1–8 ma 5 ma R. Smith (PI)
NBP0202 2002 1–8 ma 5 ma P. Wiebe (PI)
NBP0204 2002 1–8 ma 5 ma P. Wiebe (PI)
NBP0702 2007 1–8 ma 5 ma S. Jacobs (PI)
NBP0709 (500 m grid) 2007 1–8 ma 5 ma S. Ackley (PI)
ANT11/3 1994 1.2–8.5 mb <10 mc Miller and Grobe (1994)
ANT23/4 2006 1.2–8.5 mb <10 mc Gohl (2006)
NOAA RITS94B (150 m grid) 1994 1.2–8.5 mb <10 mc T. Bates (PI)
EW9101 1991 1.2–8.5 mb <10 mc J. Austin (PI)
Oden OS0910 (500 m grid) 2010 1−<8 md <10 mc J. Anderson/F. Nitsche (PI)
SBES JR04 1993 <4–40 me <10 mc P. Barker (PI)
NBP9208 1992 <4–40 me <10 mc C. Raymond (PI)
ANT11/3 (centrebeam) 1994 <4–40 me <10 mc Miller and Grobe (1994)
ANT12/4 (centrebeam) 1995 <4–40 me <10 mc R. Gersonde (PI)
ANT18/5 (centrebeam) 2001 <4–40 me <10 mc Bathmann (2002)
DSDP35 (centrebeam) 1974 <4–40 me <10 mc Hollister and Craddock (1974)
ELT11 1963 <4–40 me <10 mc P. Smith (PI)
ELT17 1965 <4–40 me <10 mc M. Dawson (PI)
ELT42 1970 <4–40 me <10 mc R. Houtz (PI)
PD90L1 1990 <4–40 me <10 mc R. Smith (PI)
THB80 N/A N/A N/A
DF85 1985 N/A N/A Kellogg and Kellogg (1987)
Other Collector sheet soundings Various N/A N/A
500 and 600 m hand contours N/A N/A N/A
from singlebeam soundings
Amundsen Sea regional 2007 N/A N/A Nitsche et al. (2007)
bathymetry compilation (3 km grid)
GLOBEC bathymetry, 2008 N/A N/A Bolmer (2008)
northern front of GVIIS
aVertical and horizontal accuracy based on RMS accuracy of sonar systems, and after estimates in Dowdeswell et al. (2010). bOther MBES system accuracy generally equal to 0.5 m±0.2% of the water depth.
cEstimated value but highly variable, dependent on acquisition parameters for individual surveys.
dEM122 accuracy of 0.2% of the water depth.
eBased on sounding vertical accuracy better than 1% of water depth, but likely to be variable between and within surveys.
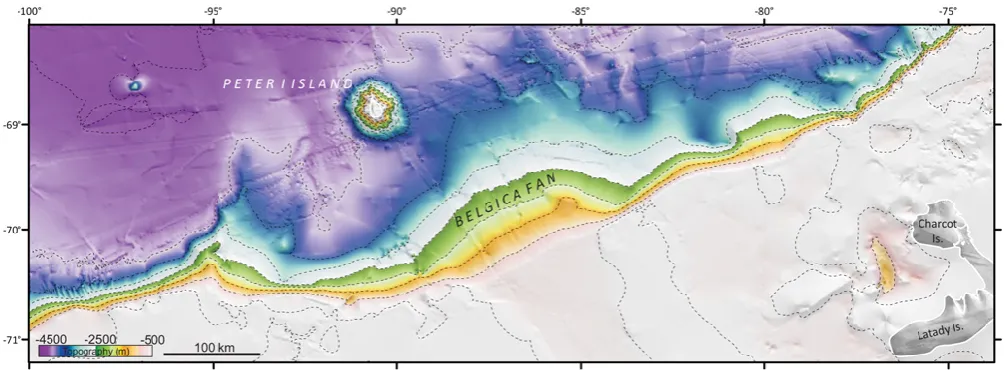
Fig. 2. Bathymetry of the Bellingshausen Sea. Grid cell size 1000 m. Coastline drawn from the ADD v.4.1. and areas of the ice sheet are
draped by a semi-transparent version of the LIMA raster image. Grid is compiled in South Pole stereographic projection, but shown here in Mercator WGS84 projection. The map is rendered here to accentuate shelf and sub-ice features, but a map highlighting deep-ocean features is shown in Fig. 3. Large format plot of the grid is available as Supplement Fig. S1.
and more realistic trough profile (Fig. 1c; see Discussions Paper and Supplement for further detail).
Lastly, we constrained the western edge of the grid by including a portion of the dataset presented in Nitsche et al. (2007). This method allows for near-seamless integration with their Amundsen Sea bathymetric grid.
Final gridding of a merged point file was carried out us-ing the Natural Neighbour algorithm in ArcGIS 9.3 (Sibson, 1981). The interpolation tool finds the closest subset of input samples to an interpolation point and applies weights to them based on proportionate areas to interpolate a value. As data quality varies between the input surveys, several iterations were required to identify and remove anomalous measure-ments (e.g. data spikes from poorly-processed echo sounder data). We produced a continuous topography with a grid cell size of 1000 m.
3 Results
The resulting grid is shown in Figs. 2 and 3. It covers an area of the shelf, slope, and ice-sheet interior>810 000 km2 in size. The continental shelf edge is well defined for the first time by the−600 m contour, except at the mouth of the prominent Belgica Trough where the shelf break lies a little deeper at ca.−700 m (cf. Timmerman et al., 2010). A few small re-entrants to the west of the grid are artefacts resulting from sparse input data, due to persistent ice cover north and northeast of Thurston Island which repeatedly prevents ship access (Figs. 1c, 2). Measured linearly from the coastline, the width of the shelf varies from very narrow (∼100 km) north of Charcot Island to broad (400–480 km) in the central Bellingshausen Sea (Fig. 2). Water depths on the shelf also vary considerably from>1000 m in the deepest inner-shelf basins to ca. 400–500 m on shallower banks.
Fig. 3. New bathymetry for the Bellingshausen Sea continental margin, shaded to accentuate features on the continental slope and rise.
Mercator projection. Contours are rendered at 500 m intervals.
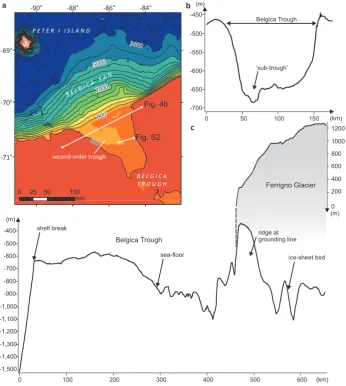
200–600 m deep (from shoulder to thalweg) relict glacial trough that has been carved out and subsequently occu-pied by fast-flowing ice streams since at least the Pliocene (Figs. 2, 4; Nitsche et al., 2000; Scheuer et al., 2006). On the inner shelf, Belgica Trough is shown to be a conver-gent system connected by smaller tributary troughs to each of the Ronne Entrance and Eltanin Bay basins. The trough shoals from the inner shelf basins towards the middle shelf, before flattening out and deepening once again towards the shelf break (Fig. 4c), where the trough mouth also widens (Fig. 4a). A small, second order trough, known to exist on the outer shelf within Belgica Trough (Hillenbrand et al., 2009) and resolvable in TOPAS profiles across the trough axis (Fig. S2), is well imaged in the new bathymetric chart measuring ca. 25 km wide, and 30–40 m deep (Fig. 4a and b). A new u-shaped trough is also revealed in the bathymetry to the east of Belgica Trough, which we refer to as Latady Trough. Latady Trough originates in Wilkins Sound and possesses an additional connection to the Ronne Entrance (Fig. 2). It is 390 km long, up to 80 km wide, has an arcu-ate planform expression, and like the neighbouring Belgica Trough, features characteristics which suggest it has been glacially-carved (e.g., u-shaped, retrograde slope). In addi-tion, the data suggest the presence of two smaller troughs on the inner shelf in the western part of the study area, near 87◦W and 91◦W, but the data coverage is currently too sparse to outline their shape or extent (Fig. 2). Shallow banks, typically 400–500 m deep, separate the troughs and also characterise regions of the inner shelf between deeper basins (Fig. 2).
At the mouth of the Belgica Trough, a major glacial de-positional centre (Belgica Fan; Dowdeswell et al., 2008) is represented in the new bathymetry, in its entirety, for the first time (Figs. 3 and 4a). It is characterised by widely-spaced
slope contours and a clear bulge in the margin profile which becomes progressively exaggerated with increasing depth. A smaller fan may also exist on the outer shelf at the mouth of Latady Trough (at ca. 82◦W; Fig. 3), as inferred previously by Scheuer et al. (2006) and Noormets et al. (2009), with a potential third fan farther east at ca. 80◦W (Fig. 3). In addi-tion, other parts of the lower slope and upper continental rise are generally well imaged across our study area, including the bathymetry surrounding Peter I island at∼90◦W, 69◦S (Figs. 3 and 4a). Refined bathymetry in this area will be par-ticularly useful for future modelling of deep water circulation (Holland et al., 2010).
650 600 3400 3000 2000 800 second-order trough
B E L G I C A T R O U G H P E T E R I I S L A N D
0 25 50 100 km
B E L G I C A F AN
-84° -86° -90° -88° -69° -70° -71°
B E L G I C A T R O U G H P E T E R I I S L A N D
0 25 50 100 km
B E LG I C A FA N
600 500 400 300 200 100 0 -400 -500 -600 -700 -800 -900 -1,000 -1,100 -1,200 -1,300 -1,400 -1,500 Belgica Trough shelf break Ferrigno Glacier 1200 1000 800 600 400 200 0 (km) (m) ridge at grounding line c
Figure 4 rev, Graham et al.
second-order trough 800 2000 3000 3400 600 a b Fig. 4b (km) Belgica Trough 150 100 50 0 -450 -500 -550 -600 -650 -700 ‘sub-trough’ Fig. S2 (m) (m)
sea-floor ice-sheet bed
800 3000
2000
Fig. 4. (a) Bathymetry of the outer shelf near the mouth of Belgica Trough, showing the small second order sub-trough, the shelf edge, and the
Belgica Fan; contours at 200 m intervals. (b) Cross-profile extracted from the new grid across the mouth of Belgica Trough; location shown in Fig. 4a. (c) Along-trough profile of the Belgica Trough and the Ferrigno Glacier basal topography, extracted from the new topographic grid. Note the unusual morphology of the outer shelf, and the apparent ridge at the glacier grounding line. Surface elevations of Ferrigno Glacier taken from the RadarSat DEM. For location, see Fig. 2.
Exact uncertainties are difficult to establish for the new grid, given the range of data types, vintages, and associated errors that make up the input dataset (e.g. some multibeam datasets with a vertical accuracy of e.g. 1–2 m versus older soundings with 10’s of metres of potential error). Neverthe-less, we provide some basic error estimates for the grid’s in-put datasets in Table 1, based on the RMS accuracy of the shipboard sonar systems used during acquisition, for water depths relevant to this study. We acknowledge that other factors including sea-state, beam angle, sea-floor geology, sound velocity correction, and signal-to-noise ratio may dras-tically affect sonar accuracy. Thus we suggest that readers consult original data sources and related publications for fur-ther details of uncertainty associated with individual surveys (Table 1).
Overall, this compilation is a major step in data represen-tation for the Bellingshausen Sea compared to the BEDMAP and recent ALBMAP compilations (Fig. 1b), and reveals more detail than found within new continent-wide datasets (Timmerman et al., 2010). Digital versions of this grid are available for download at: http://doi.pangaea.de/10.1594/ PANGAEA.746255 in netcdf and ArcGIS- compatible ascii raster formats (also included as a Supplement to the paper).
4 Discussion
Our new bathymetry resolves major topographic features of the Bellingshausen Sea shelf in detail for the first time. At 1-km resolution, the grid is of a much higher resolution than current coupled ice-ocean or ice-sheet models require be-cause such simulations are computationally intensive and re-quire a significant amount of running time, especially where working in large regional domains. However, even when resampled to lower resolutions, the differences in our grid compared to alternative counterparts are such that the new bathymetry should be useful immediately. Furthermore we anticipate future improvements to model “ability” (i.e. reso-lution and processing capability; Holland et al., 2010) which will allow for the use of more detailed boundary conditions with time.
A main observation is the continuity of cross-shelf troughs from the shelf edge to the modern ice-shelf fronts. Several studies have suggested that warm CDW must reach the ice-shelf fronts in the SBS to explain high rates of basal melting observed there (Talbot, 1988; Jenkins and Jacobs, 2008; Hol-land et al., 2010). The new grid demonstrates that continuous connections exist between the shelf edge where CDW orig-inates, and each of the southern George VI and Wilkins ice shelves, and Eltanin Bay ice front, via Belgica and Latady Troughs. Ferrigno glacier in particular, which has exhibited dynamic thinning and which may be an analogue for fast-changing glaciers such as Pine Island Glacier, has a continu-ous bathymetric link to the shelf edge along which the min-imum depth is only slightly shallower than 600 m, except across a ridge near to its modern grounding line (at 400 m; Fig. 4c). The current surface elevation change of Ferrigno glacier is measured at∼ −6 m yr−1 at the grounding line, which makes the ice stream one of the most dynamic on the Pacific margin of West Antarctica outside of the Amundsen Sea sector (Pritchard et al., 2009).
Warming as a result of CDW intrusion onto the inner shelf has been cited repeatedly as an explanation for the recent thinning and rereat of some West Antarctic glaciers, and this appears to be the most likely cause for Ferrigno glacier’s cur-rent changes (Rignot and Jacobs, 2002). However, the ap-parent ridge at the grounding line of the glacier would pose a clear obstacle to any deep-water ocean influence on the ice margin, if the sill were real. Thus, the simplest interpretation at present is that the sill imaged in our grid is an artefact of
existing topographic datasets and warm CDW does actually find access to the grounding line via the glacial cross-shelf trough. An embayment at the latitude and with the shape of Eltanin Bay would typically host an ice shelf, so the ab-sence of an ice-shelf or floating ice tongue today supports the presence of a warm-water influence right up to the mod-ern coastline. Further survey of the glacier’s grounding line is warranted however, to substantiate the presence or absence of a sill, and to establish possible mechanisms behind recent ice-sheet thinning in the SBS.
In contrast, oceanographic models of GVIIS indicate that virtually all of its current melting variability is driven by ocean processes at the southern end of the sub-ice cavity, in Ronne Entrance (Holland et al., 2010). Our grid shows both the Latady Trough and Belgica Trough connect to the southern limb of GVIIS through bathymetric deeps of 800– 1000 m. Likewise, the base of the Wilkins Ice Shelf is con-nected to the shelf edge via the 600–1000 m deep Latady Trough. Although surface water might be a significant factor in melting these “throughflow” ice shelves (Holland et al., 2010), interaction with warmer deep water masses is likely to play an important role in promoting high basal melt rates and ice-shelf changes in the SE Bellingshausen Sea.
The improved morphological characterisation of Belgica Trough also reveals that the outermost shelf slopes seaward and the trough gradient is relatively flat on the mid to outer shelf (Fig. 4c). In most other large palaeo-ice stream troughs in Antarctica, the outer shelf exhibits a distinct reverse slope towards marked and deep (up to 1500 m) inner shelf basins near to the coastline (e.g. Pine Island Trough; Graham et al., 2010). Theoretical studies have suggested that reverse gra-dient ice-sheet beds are a causal factor in ice-stream insta-bility and fast grounding line retreat (Vaughan and Arthern, 2007; Katz and Worster, 2010). However, a recent chronol-ogy presented for the retreat of palaeo-ice in Belgica Trough highlighted an unusually slow and continuous deglaciation for the WAIS in the SBS (calculating mean retreat rates of 7–55 m yr−1) (Hillenbrand et al., 2010). We hypothesise that the unusual shape of the outer shelf, together with a shal-lower trough profile, may have been influential for the style of ice-sheet recession in the Belgica Trough drainage catch-ment. Moreover, the mouth of Belgica Trough forms the deepest part of the shelf edge around West Antarctica which may be a reason why the WAIS apparently began its retreat early across this part of the continental margin (Hillenbrand et al., 2010).
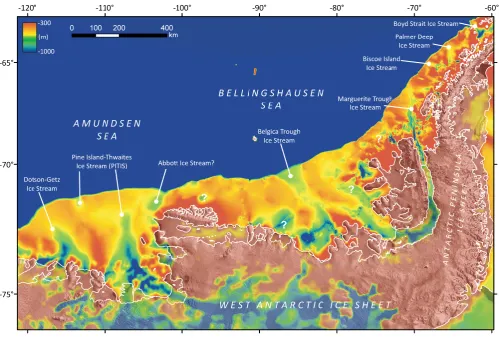
Fig. 5. Compilation of bathymetric charts for the West Antarctic Pacific margin (this study; Rebesco et al., 1998; Nitsche et al., 2007;
Bolmer, 2008; Le Brocq et al., 2010), illustrating cross-shelf morphologies which were the principle drainage pathways for numerous palaeo-ice streams (labelled). Ice stream pathways are identified based on interpretations of Anderson et al. (2002), Heroy and Anderson (2005), Evans et al. (2006), ´O Cofaigh et al. (2005a, b), Domack et al. (2006), Larter et al. (2009) and Graham et al. (2010). 4 areas still requiring investigation are highlighted with a question mark. Mercator WGS84 projection.
erosion along a small zone of enhanced ice flow within a broader fast-flowing ice stream. An analogue for such flow variability already exists in the modern, in cross-stream ve-locity variations measured on the Carlson-Talutis ice stream (e.g. Vaughan et al., 2008). As such, the second-order trough may pose an interesting site for further study with possible relevance to the flow behaviour of Antarctic ice streams op-erating today.
In addition, the bathymetry grid offers, for the first time, a sharp definition of the continental margin that was absent in previous compilations (e.g. Figs. 1b, 3). The morphology of the margin and slope is highly significant for modelling along-slope currents and for establishing the precise loca-tions of CDW intrusion onto the shelf. Warm deep water may preferentially move onto the continental shelf via shelf break curvatures and depressions (Dinniman et al., 2004; Walker et al., 2007) so an accurate delineation of the shelf edge can be considered a basic requirement of successful ocean mod-els. Similarly, ice-sheet reconstructions also require a
well-defined shelf break to establish the limit of former grounded ice, and the correct shape of the ice-margin has implications for ice-sheet models because changes in ice margin geometry will alter the strain distribution in simulated ice-sheets.
accurate configuration and form of these, and other, major ice streams is crucial for modelling change in the ice sheets through time, as reconstructions of the ancient Antarctic ice sheets validate the use of models for future simulations of change. Thus, the new grid should become a valuable re-source for modellers reconstructing palaeo-ice activity in the Bellingshausen Sea and for future expeditions targeting the main channels of ice flow in the past ice sheets.
On a regional scale, our grid adds to a number of others which depict the gross morphology of the West Antarctic Pacific margin, and show it to be dominated by cross-shelf troughs that were carved by, and repeatedly channelled, ar-teries of ice flow (palaeo-ice streams) to the fringes of the continental shelf during periods of more extensive glaciation (Fig. 5). A compilation of these bathymetric charts illustrates at least 8 known palaeo-ice stream systems between 120– 60◦W which were active at the Last Glacial Maximum, and highlights an additional 4 areas in the SBS region where the history of ice flow is almost entirely unknown (Fig. 5). These latter regions require further marine geological investigation especially since the few data that do exist indicate the po-tential for additional ice-formed troughs. In the meantime, the newly-improved regional bathymetry can be used imme-diately to test the reproducibility of ice stream locations and to constrain the patterns of long-term deglaciation within ice-sheet models of the palaeo-WAIS and Antarctic Peninusla Ice Sheet. Future improvements to the grid can only help in con-straining these models further, and may be achieved through additional grid processing to remove trackline artefacts, in-tegration of novel bathymetric datasets (e.g. Padman et al., 2010), and targeted sonar mapping in areas not yet visited by research vessels.
5 Summary
We produced the most detailed bathymetric grid to-date for the hitherto poorly mapped southern Bellingshausen Sea in West Antarctica. Our dataset shows that glacial troughs carved out by the WAIS and Antarctic Peninsula Ice Sheet during repeated glaciations of the continental shelf are now probably instrumental in delivering warm CDW to the ice margin, which has been a factor in the recent rapid demise of both grounded and floating ice in the Bellingshausen Sea. Use of our grid in future ice and ocean models is strongly encouraged, to help determine WAIS stability and forecast future loss from the ice sheets which translates directly into global sea-level. We also identify the wider application of the new bathymetry for mapping benthic biodiversity and re-gional biological trends (e.g. the Census of Antarctic Marine Life (CAML) community), habitat mapping across differ-ent sea-floor terrains, structural geological and tectonic re-constructions of the West Antarctic continent which utilise present-day sea-floor topography (e.g. Eagles et al., 2009),
as well as a starting point for reconstructions of Antarctic palaeo-topography.
Supplementary material related to this article is available online at:
http://www.the-cryosphere.net/5/95/2011/ tc-5-95-2011-supplement.zip.
Acknowledgements. We thank the captains, officers and crews of the RRS James Clark Ross and R/V Polarstern, and shipboard par-ties of numerous other cruises, for collecting data. Deb Shoosmith is thanked for providing JR165 bathymetry. Hans Werner Schenke and Karsten Gohl (both affiliated to Alfred Wegener Institute for Polar and Marine Research) supplied valuable data for the final compilation. Stewart Jamieson is thanked for his encouragement and constructive criticism of our work, and the three reviewers are gratefully acknowledged for helping improve the manuscript. This work forms a contribution to the Ice Sheets component of the British Antarctic Survey “Polar Science for Planet Earth” Programme. It was funded by The Natural Environment Research Council (AGCG and RDL). F. Nitsche was supported by NSF grant ANT-0838735.
Edited by: C. O’Cofaigh
References
Anderson, J. B., Shipp, S. S., Lowe, A. L., Wellner, J. S., and Mosola, A. B.: The Antarctic Ice Sheet during the Last Glacial Maximum and its subsequent retreat history – a review, Quater-nary Sci. Rev., 21, 49–70, 2002.
Bathmann, U.: The expedition ANTARKTIS XVIII/5b of the re-search vessel “Polarstern” in 2001, Berichte zur Polar- und Meeresforschung, 407, 98 pp., 2002.
Beaman, R. J., O’Brien, P. E., Post, A. L., and De Santis, L.: A new high-resolution bathymetry model for the Terre Adelie and George V continental margin, East Antarctica, Antarct. Sci., 23, 95–103, doi:10.1017/S095410201000074X, 2011.
Bingham, R. G., King, E. C., Larter, R. D., Pritchard, H. D., Smith, A. M., and Vaughan, D. G.: Ferrigno Ice Stream, West Antarc-tica: new boundary conditions for a catchment losing ice rapidly to dynamic thinning, Geophys. Res. Abstr., Vol. 12, EGU2010-4657, 2010.
Bolmer, S. T.: A note on the development of the bathymetry of
the continental margin west of the Antarctic Peninsula from 65◦
to 71◦S and 65◦to 78◦W, Deep-Sea Res. Pt. II., 55, 271–276, 2008.
Caress, D. W. and Chayes, D. N.: MB-system: Mapping
the Seafloor, available at: http://www.ldeo.columbia.edu/res/pi/ MB-System/, access: 28 September 2010, 2006.
Cook, A. J. and Vaughan, D. G.: Overview of areal changes of the ice shelves on the Antarctic Peninsula over the past 50 years, The Cryosphere, 4, 77–98, doi:10.5194/tc-4-77-2010, 2010. Dinniman, M. S. and Klinck, J. M.: A model study of circulation
and cross-shelf exchange on the west Antarctic Peninsula conti-nental shelf, Deep-Sea Res. Pt. II, 51, 2003–2022, 2004. Domack, E. W., Amblas, D., Gilbert, R., Brachfeld, S.,
morphology and glacial evolution of the Palmer deep outlet sys-tem, Antarctic Peninsula, Geomorphology, 75, 125–142, 2006. Dowdeswell, J. A., ´O Cofaigh, C., Noormets, R., Larter, R. D.,
Hil-lenbrand, C.-D., Benetti, S., Evans, J., and Pudsey, C. J.: A ma-jor trough-mouth fan on the continental margin of the Belling-shausen Sea, West Antarctica: the Belgica Fan, Mar. Geol., 252, 129–140, 2008.
Dowdeswell, J. A., Evans, J., and O Cofaigh, C.:´
Sub-marine landforms and shallow acoustic stratigraphy of a 400 km-long fjord-shelf-slope transect, Kangerlussuaq mar-gin, East Greenland, Quaternary Sci. Rev., 29, 3359–3369, doi:10.1016/j.quascirev.2010.06.006, 2010.
Eagles, G., Larter, R. D., Gohl K., and Vaughan, A. P. M.: West Antarctic Rift System in the Antarctic Peninsula, Geophys. Res. Lett., 36, L21305, doi:10.1029/2009GL040721, 2009.
Evans, J., Dowdeswell, J. A., ´O Cofaigh, C., Benham, T. J., and
Anderson, J. B.: Extent and dynamics of the West Antarctic Ice Sheet on the outer continental shelf of Pine Island Bay during the last glaciation, Mar. Geol., 230, 53–72, 2006.
Fretwell, P. T., Tate, A. J., Deen, T. J., and Belcher, M.: Compilation of a new bathymetric dataset of South Georgia, Antarct. Sci., 21, 171–174, 2009.
Gohl, K.: The Expedition ANTARKTIS-XXIII/4 of the Research Vessel “Polarstern” in 2006, Berichte zur Polar- und Meeres-forschung, 557, 166 pp., 2006.
Graham, A. G. C., Larter, R. D., Gohl, K., Dowdeswell, J. A., Hil-lenbrand, C.-D., Smith, J. A., Evans, J., Kuhn, G., and Deen, T. J.: Flow and retreat of the Late Quaternary Pine Island-Thwaites palaeo-ice stream, West Antarctica, J. Geophys. Res., 115, F03025, doi:10.1029/2009JF001482, 2010.
Heroy, D. C. and Anderson, J. B.: Ice-sheet extent of the Antarctic Peninsula region during the Last Glacial Maximum (LGM) – In-sights from glacial geomorphology, Geol. Soc. Am. Bull., 117, 1497–1512, 2005.
Hillenbrand, C.-D., Ehrmann, W., Larter, R. D., Benetti, S.,
Dowdeswell, J. A., ´O Cofaigh, C., Graham, A. G. C., and
Grobe, H.: Clay mineral provenance of sediments in the southern Bellingshausen Sea reveals drainage changes of the West Antarc-tic Ice Sheet during the Late Quaternary, Mar. Geol., 265, 1–18, 2009.
Hillenbrand, C.-D., Larter R. D., Dowdeswell, J. A., Ehrmann, W., ´
O Cofaigh, C., Benetti, S., Graham, A. G. C., and Grobe, H.: The sedimentary legacy of a palaeo-ice stream on the shelf of the southern Bellingshausen Sea: Clues to West Antarctic glacial history during the Late Quaternary, Quaternary Sci. Rev., 29, 2741–2763, doi:10.1016/j.quascirev.2010.06.028, 2010. Holland, P. R., Jenkins, A., and Holland, D. M.: Ice and ocean
pro-cesses in the Bellingshausen Sea, Antarctica, J. Geophys. Res., 115, C05020, doi:10.1029/2008JC005219, 2010.
Hollister, C. D. and Craddock, C.: Deep Sea Drilling Project, Leg 35: Bellingshausen Sea, Antarct. J. US, 9, 1–19, 1974.
Jacobs, S. S. and Comiso, J. C.: Climate variability in the Amund-sen and BellingshauAmund-sen seas, J. Climate, 10, 697–709, 1997. Jakobsson, M., Macnab, R., Mayer, L., Anderson, R., Edwards,
M., Hatzky, J., Schenke, H. W., and Johnson, P.: An im-proved bathymetric portrayal of the Arctic Ocean: Implica-tions for ocean modelling and geological, geophysical and oceanographic analyses, Geophys. Res. Lett., 35, L07602, doi:10.1029/2008GL033520, 2008.
Jenkins, A. and Jacobs, S. S.: Circulation and melting beneath George VI Ice Shelf, Antarctica, J. Geophys. Res., 113, C04013, doi:10.1029/2007JC004449, 2008.
Katz, R. F. and Worster, G.: Stability of ice-sheet grounding lines, P. R. Soc. A, 466, 1597–1620, doi:10.1098/rspa.2009.0434, 2010. Kellogg, D. E. and Kellogg, T. B.: Microfossil distributions in
mod-ern Amundsen Sea sediments, Mar. Micropaleontol., 12, 203– 222, 1987.
Larter, R. D., Gohl, K., Hillenbrand, C. D., Kuhn, G., Deen, T. J., Dietrich, R., Eagles, G., Johnson, J. S., Livermore, R. A., Nitsche, F. O., Pudsey, C. J., Schenke, H. W., Smith, J. A., Udint-sev, G. B., and Uenzelmann-Neben, G.: West Antarctic Ice Sheet change since the last glacial period, Eos, 88, 189–190, 2007. Larter, R. D., Graham, A. G. C., Gohl, K., Kuhn, G., Hillenbrand,
C.-D., Smith, J. A., Deen, T. J., Livermore, R. A., and Schenke, H.-W.: Subglacial bedforms reveal complex basal regime in a zone of paleo-ice stream convergence, Amundsen Sea embay-ment, West Antarctica, Geology, 37, 411–414, 2009.
Le Brocq, A. M., Payne, A. J., and Vieli, A.: An improved Antarctic dataset for high resolution numerical ice sheet mod-els (ALBMAP v1), Earth Syst. Sci. Data Discuss., 3, 195–230, doi:10.5194/essdd-3-195-2010, 2010.
Lythe, M. B., Vaughan, D. G., and the BEDMAP consortium: BEDMAP: A new ice thickness and subglacial topographic model of Antarctica, J. Geophys. Res., 106, 11335–11351, 2001.
Macnab, R.: Houston, We Have a Problem: Satellite
Al-timetry Skews Ocean Depths, Eos Trans. AGU, 90, 312, doi:10.1029/2009EO360003, 2009.
Maslanyj, M. P.: Seismic bedrock depth measurements and the ori-gin of George VI Sound, Antarctic Peninsula, Brit. Antarct. Surv. B., 75, 51–65, 1987.
Miller, H. and Grobe, H.: The expedition ANTARKTIS-XI/3 of RV “Polarstern” in 1994, Berichte zur Polar- und Meeresforschung, 188, 115 pp., 1994.
Nitsche, F. O., Cunningham, A. P., Larter, R. D., and Gohl, K.: Geometry and development of glacial continental margin depo-sitional systems in the Bellingshausen Sea, Mar. Geol., 162, 277– 302, 2000.
Nitsche, F. O., Jacobs, S. S., Larter, R. D., and Gohl, K.: Bathymetry of the Amundsen Sea continental shelf: Implications for, geology, oceanography and glaciology, Geochem. Geophy. Geosy., 8, Q10009, doi:10.1029/2007GC001694, 2007.
Noormets, R., Dowdeswell, J. A., Larter, R. D., ´O Cofaigh, C.,
and Evans, J.: Morphology of the upper continental slope in the Bellingshausen and Amundsen seas – implications for sedimen-tary processes at the shelf edge of West Antarctica, Mar. Geol., 258, 100–114, 2009.
´
O Cofaigh, C., Pudsey, C. J., Dowdeswell, J. A., and Morris, P: Evo-lution of subglacial bedforms along a paleo-ice stream, Antarc-tic Peninsula continental shelf, Geophys. Res. Lett., 29, 1199, doi:10.1029/2001GL014488, 2002.
´
O Cofaigh, C., Dowdeswell, J. A., Allen, C. S., Hiemstra, J., Pud-sey, C. J., Evans, J., and Evans, D. J. A.: Flow dynamics and till genesis associated with a marine-based Antarctic palaeo-ice stream, Quaternary Sci. Rev., 24, 709–740, 2005a.
´
doi:10.1029/2005JB003619, 2005b.
Overpeck, J. T. and Weiss, J. L.: Projections of future sea level be-coming more dire, P. Natl. Acad. Sci., 106, 21461–21462, 2009. Padman, L., Costa, D. P., Bolmer, S. T., Goebel, M. E., Huck-stadt, L. A., Jenkins, A., McDonald, B. I., and Shoosmith, D. R.: Seals map bathymetry of the Antarctic continental shelf, Geo-phys. Res. Lett., 37, L21601, doi:10.1029/2010GL044921, 2010. Pritchard, H. D. and Bingham, R. G.: Exploration glaciology: radar
and Antarctic ice, Physics Education, 42, 442–456, 2007. Pritchard, H. D., Arthern, R. J., Vaughan, D. G., and Edwards,
L. A.: Extensive dynamic thinning on the margins of the
Greenland and Antarctic ice sheets, Nature, 461, 971–975, doi:10.1038/nature08471, 2009.
Rebesco, M., Camerlenghi, A., and Zanolla, C.: Bathymetry and Morphogenesis of the Continental Margin West of the Antarctic Peninsula, Terra Antarctica, 5, 715–725, 1998.
Rignot, E. and Jacobs, S. S.: Rapid bottom melting widespread near Antarctic Ice Sheet grounding lines, Science, 296, 2020–2023, 2002.
Sandwell, D. T., Smith, W. H. F., Gille, S., Jayne, S., Soofi, K., and Coakley, B.: Bathymetry from Space: White paper in sup-port of a high-resolution, ocean altimeter mission, 5 April 2001, available at: http://topex.ucsd.edu/marine grav/white paper.pdf, access: 29 September 2010, 2001.
Scheuer, C., Gohl, K., Larter, R. D., Rebesco, M., and Udintsev, G. B.: Variability in Cenozoic sedimentation along the continental rise of the Bellingshausen Sea, West Antarctica, Mar. Geol., 227, 279–298, doi:10.1016/j.margeo.2005.12.007, 2006.
Sibson, R.: A Brief Description of Natural Neighbor Interpolation, in: Interpolating Multivariate Data, New York: John Wiley & Sons, 21–36, 1981.
Smith, W. H. F. and Sandwell, D. T.: Bathymetric prediction from dense satellite altimetry and sparse shipboard bathymetry, J. Geophys. Res., 99, 21803–21824, 1994.
Smith, W. H. F. and Sandwell, D. T.: Global seafloor topography from satellite altimetry and ship depth soundings, Science, 277, 1957–1962, 1997.
Talbot, M. H.: Oceanic environment of George VI Ice Shelf, Antarctic Peninsula, Ann. Glaciol., 11, 161–164, 1988. Thoma, M., Jenkins, A., Holland, D., and Jacobs, S. S.:
Mod-elling Circumpolar Deep Water intrusions on the Amundsen Sea continental shelf, Antarctica, Geophys. Res. Lett., 35, L18602, doi:10.1029/2008GL034939, 2008.
Timmermann, R., Le Brocq, A., Deen, T., Domack, E., Dutrieux, P., Galton-Fenzi, B., Hellmer, H., Humbert, A., Jansen, D., Jenkins, A., Lambrecht, A., Makinson, K., Niederjasper, F., Nitsche, F., Nøst, O. A., Smedsrud, L. H., and Smith, W. H. F.: A consistent dataset of Antarctic ice sheet topography, cavity geometry, and global bathymetry, Earth Syst. Sci. Data Discuss., 3, 231–257, doi:10.5194/essdd-3-231-2010, 2010.
Vaughan, D. G. and Arthern, R.: Why is it hard to
pre-dict the future of ice sheets?, Science, 315, 1503–1504, doi:10.1126/science.1141111, 2007.
Vaughan, D. G., Corr, H. F. J., Smith, A. M., Pritchard, H. D., and Shepherd, A.: Flow-switching and water piracy between Rutford Ice Stream and Carlson Inlet, West Antarctica, J. Glaciol., 54, 41–49, 2008.