RESEARCH
Responding to victimisation in a digital
world: a case study of fraud and computer
misuse reported in Wales
Sara Giro Correia
*Abstract
This paper presents the early results of a study exploring computer misuse and fraud victimisation in Wales, United Kingdom (UK). The results presented here describe the quality of the data available to local forces, the characteristics and heterogeneity of the victims who report incidents and the nature of the police response at a local level. The sig-nificance of these results is considered within the enforcement and victimisation policy context that surrounds com-puter misuse and fraud. It is argued that while Action Fraud data provides a rich source of data with respect to victims’ needs, specific improvements in data collection and processing could aid local forces in the delivery (or facilitation) of a more victim-focused response. Alongside this, the results highlight how an adequate police response must take victim heterogeneity into account, both at national and local levels. Finally, better understandings of vulnerability (both theoretically informed and empirically tested) are necessary, on which to build an adequate victim-response to these crime types.
Keywords: Cybercrime, Fraud, Computer misuse, Policing, Victimisation, Repeat victims, Vulnerability, Online crime
© The Author(s) 2019. This article is distributed under the terms of the Creative Commons Attribution 4.0 International License (http://creat iveco mmons .org/licen ses/by/4.0/), which permits unrestricted use, distribution, and reproduction in any medium, provided you give appropriate credit to the original author(s) and the source, provide a link to the Creative Commons license, and indicate if changes were made. The Creative Commons Public Domain Dedication waiver (http://creat iveco mmons .org/ publi cdoma in/zero/1.0/) applies to the data made available in this article, unless otherwise stated.
Introduction
Experiences of computer misuse (CM) and fraud vic-timisation have increasingly occupied the public sphere. Their significance was highlighted in the United Kingdom (UK) from 2017, as these crimes integrated the yearly crime estimates produced by the Office for National Sta-tistics (ONS). Recent estimates indicate that there were 3.25 million incidents of fraud and 1.24 million incidents of CM1 in the year ending March 2018 (ONS 2018a), increasing the grand total from 6.01 to 10.57 million esti-mated crimes (Ibid.). Alongside these figures stands the considerable investment government has committed to cyber security—£1.9 billion by 2021 (HM Government 2016).2 Finally, the threat and harm posed by these crime types have also attracted attention. Cases such as the 2007 cyber-attack on Estonia and the Stuxnet worm aimed at Iran stand as examples of large national infrastructure attacks. Recently, 2017 was characterised by ransom ware
attacks including WannaCry, which disrupted organi-sations across the world, including UK hospitals. Since, data-breaches have made successive headlines, with mil-lions of personal data records lost. However, it has been suggested that the mass media’s attention often focuses on ideal victims and perpetrators (Christie 1986) and fails to properly scrutinise ‘official’ narratives, primar-ily put forward by criminal justice institutions and large business victims (Jarvis et al. 2015; Levi 2006, 2008). As such, better and empirically grounded understandings of these crime types are necessary.
At the same time, the process by which victims report CM and fraud and the ways in which victim services are delivered have changed significantly in the UK. Firstly, the reporting of cybercrime and fraud has improved with the introduction of the national reporting centre, Action Fraud (AF). Its introduction mirrored the equivalent in
Open Access
*Correspondence: [email protected]
Swansea University, Singleton Park, Swansea SA2 8PP, UK
1 Including computer virus and unauthorised access to personal information.
2 Up from £860 million in the previous 5-year term. To illustrate de
the USA and Canada and had been recommended by The Fraud Review (2006) and academic experts (Button et al. 2009a; Levi and Burrows 2008). Additionally, victim sup-port services have been considerably decentralised from their previous model (Hall 2018). These services became (or reverted to) local delivery, with the addition of com-petitive bidding for service providers wishing to deliver those services, funded through the Office of the Police and Crime Commissioners (PCCs) (Ibid.). These changes have taken place in the context of a computer crime and fraud policing strategy which, following the counter-ter-rorism ‘CONTEST’ model, is divided into ‘4 Ps’: ‘Pursue’ offenders through prosecution and disruption, ‘Prepare’ to mitigate against the impact of incidents, ‘Protect’ indi-viduals, organisations and systems against being victim-ised and ‘Prevent’ people from engaging in crime (City of London Police 2015b; HM Government 2013, 2018). The ‘Protect’ strand is the one that is more clearly linked to a victim-focused response. Here, discussions with stake-holders revealed a policy of local delivery supported by national resources such as the NFIB. The responsibility of ‘volume’ crime prevention (i.e. that which is not con-sidered ‘serious organised crime’) falls to local police forces, following prioritisation by PCCs and Chief Con-stables (City of London Police 2015a). Third sector organisations such as Victim Support are meant to lead on addressing victim impact and reducing repeat vic-timisation (Draft NPFS 2015a, b). In addition, at the local level Police and Crime Reduction Plans often strategically focus ‘Protect’ activity on ‘vulnerable’ victims (e.g. Dyfed
Powys PCC 2017; Gwent PCC 2017; North Wales PCC
2017; South Wales PCC 2017). Thus, this area of crime control requires the interaction of UK law enforcement agencies across three levels: the National Fraud Intel-ligence Bureau (NFIB) determines what is investigated, the Regional Organised Crime Units (ROCUs) support strategic delivery and large-scale investigations and the local forces investigate and deliver victim-response ‘on the ground’.
In this context, this paper seeks to critically engage with challenges of responding the computer misuse and fraud victimisation by considering three questions: (1) How can data collection be improved to best enable local forces to meet victim needs? (2) How heterogeneous are victims who report CM and fraud in Wales? And (3) How is law enforcement responding to these crimes at a local level? It does so by drawing on the early results of the quantitative element of a larger mixed-methods study, utilising a sample of crimes reported via AF, for a period of 2 years (1st of October 2014 to the 30th of September 2016), within the four Welsh police forces. In answering these questions, this paper also concludes by pointing to avenues for future research. This paper focuses on fraud
and CM for two reasons. Firstly, except for some impor-tant contributions (Buchanan and Whitty 2014; Button et al. 2009b, 2014; Whitty 2015) there remains limited academic study of victimisation in this area. Secondly, the initial scoping research indicated that the overall impact of these crimes on victims, especially in terms of their volume and associated costs, as well as the vulnerability of victims were priorities in public discourse and aca-demic literature (Anderson et al. 2013; Blakeborough and Correia 2018; Buchanan and Whitty 2014; Button et al. 2009b, 2014; Home Office 2018b; McGuire and Dowling 2013; Whitty 2015).
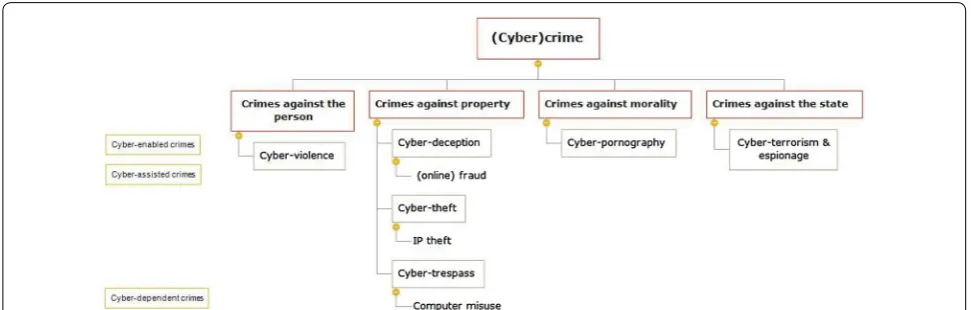
Finally, what is meant by computer misuse and fraud in this paper should be clarified and the author’s avoidance of the term ‘cybercrime’ explained. ‘Cybercrime’ is used to refer to a diverse range of illegal activity which occurs primarily within an electronic environment, enabled by the Internet (Yar 2006).3 Given the wide scope of the term however, it is useful to break ‘cybercrime’ down fur-ther into sub-categories. As such, the author started this enquiry by drawing on several existing typologies (par-ticularly Home Office 2018a, b; Levi et al. 2017; Levi and Burrows 2008; McGuire and Dowling 2013; Yar 2006), to identify what types of (cyber) crime may be of interest (see Fig. 1). However, ‘cybercrime’ is a contested term and its usefulness may be questioned altogether (Grabosky and Smith 1998), especially where the aim is to under-stand victims’ perspective and the extent to which victim policy is adequate and effectively implemented. Crucially for this study, the boundaries between “cyber” and “tra-ditional” crime were found to be blurred. In line with previous research (Levi et al. 2017),4 it became apparent that the author’s attempt at coding data according to an on/offline dichotomy was impossible.5 Furthermore, the Modus Operandi (MO) of a crime should not substan-tially change the principles that inform victim response. As such, this article will not exclusively consider crimes with a “cyber” element, but instead cases of victimisation associated with crimes of fraud and computer misuse, as defined by the Fraud Act 2006 and the Computer Misuse
3 This includes new crimes which did not exist prior to networked computers (cyber-dependent crimes), as well as crimes which pre-date the Internet but have been significantly “transformed” by it (cyber-enabled) (Wall 2001). To these we may also add cyber-assisted crimes, where ICT is used “in the course of criminal activity which would take place anyway” (Levi et al. 2017, p. 81). 4 In a study that analysed 106,681 crime reports made to Action Fraud
across police forces in England and Wales, between October to December 2014, the authors identified that the most common mode by which offend-ers first contacted their victims was by phone or text (35%), followed by contact after the victim visited a website (18%), contact in person (12%), by letter and fax (11%) and by email (8%) (Levi et al. 2017, p. 82).
5 This was not surprising with respect to fraud as many Modus Operandi
(MO) have been found to straddle the on/offline divide (e.g. Button et al.
Act 1990 respectively, whether they have on/offline ele-ments or both.6
Methods
This paper reports on a sub-set of early results from a
study based on N = 17,049 computer misuse (CM) and
fraud reports, made by victims within the Welsh police forces (Dyfed/Powys, Gwent, North Wales and South Wales), via the UK‘s national reporting centre Action Fraud (AF). The data relating to all crimes7 reported over a 2-year period between the 1st October 2014 and the 30th September 2016 were returned to the respec-tive forces who agreed to share this with the researcher via the Southern Wales Regional and Organised Crime Unit (ROCU), a partner organisation in this project. While it was possible to access the full population of AF victim reports at the time the data was collected, insights from crime reports collected prior to October 2014 were considered less reliable due to the transition into the AF reporting system. As such, all records available at the point of data collection from October 2014 were collected.
To undertake this research, the author underwent a process of security vetting, enabling her to access, clean and anonymise the data within the ROCU’s secure
environment. The anonymised dataset was then further analysed at Swansea University, whose Ethics Board reviewed and approved the project prior to its com-mencement. Given the project’s aim to improve the response to victims of CM and fraud, a strong public-interest rationale justified the use of this administrative dataset. Nonetheless, as the original dataset identified victims of crime, the handling of this sensitive informa-tion carried the risk of loss of anonymity and subsequent harm to participants. As such, a strict protocol for data access, anonymisation, storage and reporting was fol-lowed in order ensure these risks were mitigated.
A data-driven mixed methods methodology was employed. Mixed-methods is understood as “the type of research in which a researcher… combines elements of qualitative and quantitative research approaches… for the purposes of breadth and depth of understanding and corroboration” (Johnson et al. 2007, p. 123). AF reports contained both quantitative and qualitative data, each suited to different methods of analysis and to answer different research questions. As such, a mixed-methods approach was appropriate and a sequential explanatory design used (Creswell et al. 2003; Ivankova et al. 2006). This paper reports on the first stage in this sequence, where structured data from the AF database was quanti-tatively analysed, to explore reported incidents and police response.
A descriptive statistical analysis of the dataset was undertaken at first instance, including an exploration and testing of variables’ distribution and measures of central tendency. This enabled a better understanding of the quality of the data and the characteristics of the popula-tion of reporting victims. Subsequently, several theoreti-cally informed statistical hypotheses were tested using inferential frequentist methods. Given that the dataset contained a variety of categorical (e.g. gender), interval
Fig. 1 Cybercrime typology, based on Home Office (2018a, b), Levi et al. (2017), Levi and Burrows (2008), McGuire and Dowling (2013) and Yar (2006)
7 ‘Crimes’ include all cases reported and recorded as crimes by Action
Fraud, following the Home Office Counting Rules.
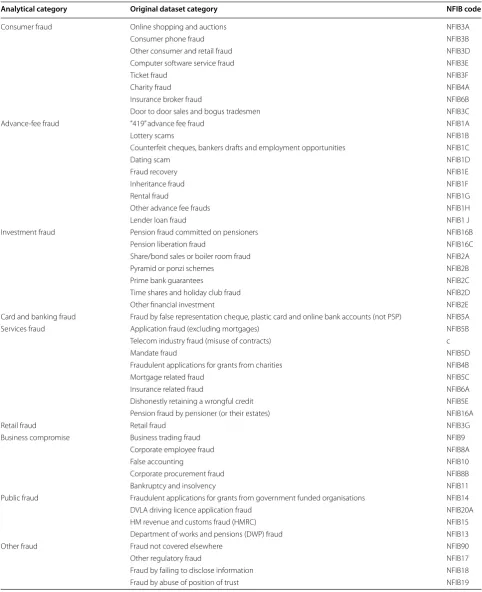
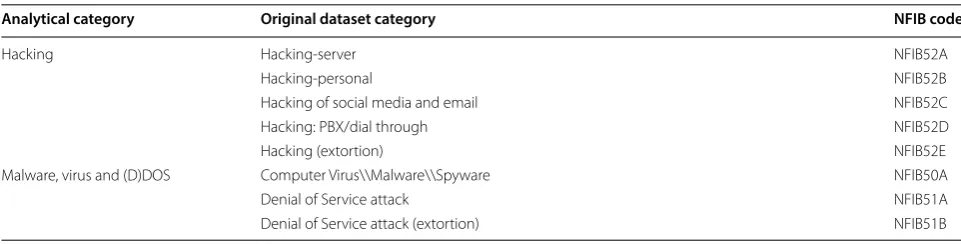
Table 1 Translation between fraud and computer misuse crime categories used in this study and NFIB codes
Analytical category Original dataset category NFIB code
Consumer fraud Online shopping and auctions NFIB3A
Consumer phone fraud NFIB3B
Other consumer and retail fraud NFIB3D
Computer software service fraud NFIB3E
Ticket fraud NFIB3F
Charity fraud NFIB4A
Insurance broker fraud NFIB6B
Door to door sales and bogus tradesmen NFIB3C
Advance-fee fraud “419” advance fee fraud NFIB1A
Lottery scams NFIB1B
Counterfeit cheques, bankers drafts and employment opportunities NFIB1C
Dating scam NFIB1D
Fraud recovery NFIB1E
Inheritance fraud NFIB1F
Rental fraud NFIB1G
Other advance fee frauds NFIB1H
Lender loan fraud NFIB1 J
Investment fraud Pension fraud committed on pensioners NFIB16B
Pension liberation fraud NFIB16C
Share/bond sales or boiler room fraud NFIB2A
Pyramid or ponzi schemes NFIB2B
Prime bank guarantees NFIB2C
Time shares and holiday club fraud NFIB2D
Other financial investment NFIB2E
Card and banking fraud Fraud by false representation cheque, plastic card and online bank accounts (not PSP) NFIB5A
Services fraud Application fraud (excluding mortgages) NFIB5B
Telecom industry fraud (misuse of contracts) c
Mandate fraud NFIB5D
Fraudulent applications for grants from charities NFIB4B
Mortgage related fraud NFIB5C
Insurance related fraud NFIB6A
Dishonestly retaining a wrongful credit NFIB5E
Pension fraud by pensioner (or their estates) NFIB16A
Retail fraud Retail fraud NFIB3G
Business compromise Business trading fraud NFIB9
Corporate employee fraud NFIB8A
False accounting NFIB10
Corporate procurement fraud NFIB8B
Bankruptcy and insolvency NFIB11
Public fraud Fraudulent applications for grants from government funded organisations NFIB14
DVLA driving licence application fraud NFIB20A
HM revenue and customs fraud (HMRC) NFIB15
Department of works and pensions (DWP) fraud NFIB13
Other fraud Fraud not covered elsewhere NFIB90
Other regulatory fraud NFIB17
Fraud by failing to disclose information NFIB18
(e.g. number of repeats) and ratio data (e.g. loss and age), statistical tests were carried as appropriate. In this paper results relating to Pearson Chi squared tests (χ2) are reported to identity significant differences between sub-groups of victims. The odds ratio and Cramèr’s V are reported where appropriate as measures of effect size. Finally, where χ2 was found to provide limited insight, generalised linear models (GLMs) were used to aid visu-alisation and interpretation of results. GLMs replicate or replace many of the traditional statistical tests, while allowing the researcher to focus on interpretation of models through a standard (visual) method (Field et al. 2012; Fox 2003; Fox and Weisberg 2011; Hutcheson and Schaefer 2012; Hutcheson and Sofroniou 1999).
There are several limitations when using police recorded crime (PRC) for statistical analysis, and some are particular to CM and fraud (Flatley 2013; Levi and
Burrows 2008). PRC only captures crime which was
reported to and recorded by the police. As such, it pro-vides an insight into reporting/recording rather than crime patterns or victimisation risk. This limitation is especially relevant with respect to the crime types under consideration as they are comparatively under-reported. It is estimated that only 14.5% of CM and fraud experi-enced by individuals were reported to the police in the year ending September 2018 (ONS 2019, Tables A1 and A4).8 In comparison, 55.9% of thefts were reported to the police in the same period (Ibid.).9 In addition, concerns have been raised over the process of “criming”, i.e. attrib-uting a crime label to a reported incident in accordance
with the UK’s Home Office Counting Rules (HOCR) (Home Office 2015). Issues regarding compliance with HOCR and recording practices led to PRC losing its sta-tus as approved national statistics in 2014 (UKSA 2014).10 Finally, high levels of ‘attrition’ have been reported in the recording of fraud and CM (Scholes 2018) and, as with administrative data more broadly, AF data was collected for the administration of justice and is thus not optimised for the purposes for which it was analysed here.
Nonetheless, AF data remains useful where the focus of the enquiry is the CJS response towards victims. While enquiry is limited to reported crime, it is also the case that responding to victim needs must start with those who come forward to report. Previous research has shown that trust in the police and a belief that the police can do something about the issue are important factors influencing whether victims report crime (MacDon-ald 2001; Skogan 1984; Zawitz et al. 1993). As such, an adequate police response is a factor in driving reporting behaviour. Previous research has also indicated that the victims’ perception of the seriousness of the crime, is the most important factor leading to a decision to report crime (Skogan 1984; Tarling and Morris 2010). Simi-larly, a cost–benefit analysis or the opportunity-costs for the victim involved in reporting also constitute factors in decisions to report crime (Goudriaan 2006; Skogan 1984). In fact, the seriousness of the crime and/or a cost– benefit rationale were given as prominent reasons for not reporting to AF—although lack awareness of the service was the most common reason cited for not reporting.11
Table 1 (continued)
Analytical category Original dataset category NFIB code
Hacking Hacking-server NFIB52A
Hacking-personal NFIB52B
Hacking of social media and email NFIB52C
Hacking: PBX/dial through NFIB52D
Hacking (extortion) NFIB52E
Malware, virus and (D)DOS Computer Virus\\Malware\\Spyware NFIB50A
Denial of Service attack NFIB51A
Denial of Service attack (extortion) NFIB51B
9 Calculation based on a total number of theft offences estimated at
3,574,000 for the UK population in the year ending September 2018 (Table A1), against the number of theft offences reported to the police for the same period at 1,998,876 (Table A4).
10 The removal of the designation of “national statistics” from police recorded crime can therefore be interpreted to mean that police recorded crime—which includes the crime data supplied by police forces and Action Fraud (now run by a private provider for the National Fraud Investigative Bureau) to the Home Office—does not meet identified user needs; are not produced, managed and disseminated to high standards; and its limitations not well explained. 11 While ONS provided respondents with a wider selection of reasons
(ONS 2017, Table 2), these were combined for ease of analysis by this researcher into “never heard of Action Fraud” (66%), “cost–benefit rationale” (19%), “crime reported elsewhere” (14%), “private matter” (8%), “other” (8%) and “don’t know” (1%).
Finally, per the Victims’ Code, the seriousness and impact of the crime, victim characteristics such as living with a disability and circumstances such as being a repeat vic-tim require an enhanced response from criminal justice agencies (MOJ 2015). The code extends to all victims of crime, the ‘right’ to be assessed according to such ‘vul-nerability’ criteria. As such, one would expect to be able to identify within AF data significant detail to enable an adequate prioritisation and response to victims’ needs, as well as discharge victims’ service and procedural rights (Hall 2018).
As such, this paper will consider the quality of AF data in terms of two quality dimensions set out within the European Statistical System (Eurostat 2017; ONS 2018b): (1) relevance and (2) accuracy and reliability. Rel-evance is the degree to which data meet the users exist-ing and emergexist-ing needs. Accuracy and reliability concern whether the sourced data is accurately recorded and reli-ably reflect the reality they seek to capture. While PRC does not currently carry the quality seal of UK ‘official’ statistics, these principles remain are useful in consider-ing the quality of AF data.
Results and discussion Data quality
Issues affecting the accuracy and reliability of AF data include data ‘missingness’ as well as errors in process-ing, measurement and coding. The level of missing data in salient AF variables was high and is summarised in Table 2. Missingness was highly prevalent in the origi-nal variables, but also in the variables derived/coded by the author, due to lack of detail and inconsistencies in some records. For example, several variables were coded based on the free-text incident description. However, some descriptions were missing and the level of detail variable. In addition, 664 duplicates were found within the dataset, indicating some processing error before the data was shared with the local forces. Finally, the author’s manual coding exercise identified some inconsistencies with respect to the original AF coding, particularly in the attribution of crime type category to incidents e.g. a ‘Denial of Service attack’ (DOS) recorded where ‘Hack-ing’ would have been a more appropriate category.
Action Fraud data shared with local forces could be much improved in terms of its ‘fitness’ to be used to con-duct victim vulnerability assessments. Extra fields which may enable local forces to develop a better picture of local victims’ needs include the type of victim (e.g. indi-vidual, business, charity or public sector organisation), gender, whether there is an on-line element to the inci-dent, victim’s gender, whether the victim has accessibility needs or is a repeat victim. The author could derive some of this information from the dataset through a combina-tion of automated and manual linkage and coding. How-ever, this was a resource-intensive exercise which local forces may be unable to carry out. Finally, in discussions with stakeholders it transpired that some of this informa-tion is collected centrally by AF/NFIB but is not shared with local forces. Even within the arguably limited terms within which ‘vulnerability’ is defined in the Victims’ Code (MOJ 2015),12 the data collected by AF and shared with local police forces appears insufficient to conduct a victim vulnerability assessment.
Victim heterogeneity
Significant differences were found with respect to crime types reported across victim characteristics, but the effect sizes were generally small. Differences in the crime types reported across victim groups are highlighted in Fig. 2. Among individual victims, a significant differ-ence was found with respect to crime types reported across gender (χ2 (7) = 73.57, p < 0.01). However, in this case Cramer’s V (0.075) indicates that the effect size is small.13 Nonetheless, the standardized residuals suggest that the difference is driven by females being significantly more likely to report Advance fee fraud (p < 0.01) and males significantly more likely to report Investment fraud (p < 0.01). Based on the odds ratio, the odds of a victim of Advance fee fraud being female are 1.24 times higher, while the odds of a victim of Investment fraud being male are 2.35 times higher. In terms of ethnicity, a significant difference was found between crime categories reported by victims identified as White and Other (χ2 (7) = 18.17,
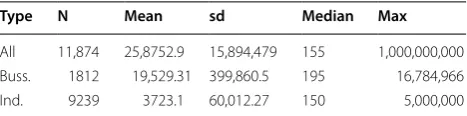
p= 0.001, Cramér’s V= 0.05). The standardized residuals revealed that this was driven by the White ethnic group reporting significantly more advance fee fraud while Table 2 Distribution of loss (including loss = £0)
N: sample size; sd: standard deviation; max: maximum value
Type N Mean sd Median Max
All 11,874 25,8752.9 15,894,479 155 1,000,000,000 Buss. 1812 19,529.31 399,860.5 195 16,784,966
Ind. 9239 3723.1 60,012.27 150 5,000,000
12 The Victims Code defines a victim as “a natural person who has suffered harm, including physical, mental or emotional harm or economic loss which was directly caused by a criminal offence” (2015, p. 2). Furthermore, there are three categories of victims which are entitled to an enhanced service under the code: (1) victims of the most serious crimes, (2) persistently targeted vic-tims and (3) vulnerable or intimidated vicvic-tims. While vicvic-tims of cybercrime and fraud are unlikely to fall under the first sub-category of victim entitled to enhanced service, they may fit the categories of persistently targeted, vulner-able or intimidated victims.
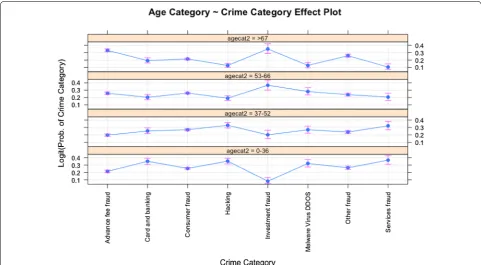
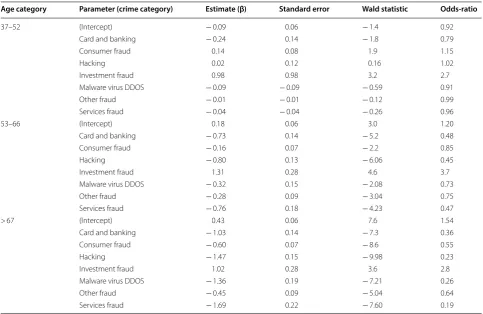
conversely, the Other group reported significantly less. Finally, a derived variable for age category grouping age data into UK Census categories was created and a signifi-cant association between victim’s age category and the crime types they reported (χ2 (84) = 525.63, p < 0.00114). However, the detail of what drives a significant χ2 result becomes difficult to interpret where multiple catego-ries result in large contingency tables. As such, the age category was re-coded into a new age variable split over four categories according to the age values for the first quartile, median (52) and third quartiles and a GLM predicting the logit of the probability of age category based on the crime reported was run in R statistics. The overall model significantly reduced residual deviance (χ2 (21) = 375.1, p < 0.0001) and the model’s effect dis-play (Fig. 3) clearly demonstrates that victims reporting Investment and Advance fee fraud are more likely to be older, whereas those reporting Hacking, service fraud and Malware/DDOS/Virus more likely to be younger vic-tims. This result is confirmed in the table summarising the statistical parameters (Table 3).
With respect to reported financial loss, Table 4 shows that loss data is highly spread, highlighting considerable differences between victims. A considerable number of reports (2682 or 21%) indicated a reported loss of £0. This observation should be interpreted with caution for
two reasons. Firstly, there was a considerable amount of missing data with respect to loss (30%). Secondly, where the victim has declared an estimation of loss at the time of reporting, this may not reflect longer term and/or indi-rect losses. On one hand these factors may result in an under-estimation of no-loss reports as the researcher noted that many no-loss reports were recorded as “miss-ing data” in the loss variable (as opposed to “£0”).15 On the other, there may be some instances where the victim reports the crime before the (total) loss is known to them. Nonetheless, this sample is indicative that a considerable proportion of reports made relate to ‘unsuccessful’ frauds or hacks.16 The impact of financial loss being relative to the means of the victim, prioritising cases where there is some loss may help focus a victim response. Currently, only cases reporting losses over £100,000 should be auto-matically picked up for further action at NFIB (Scholes 2018, p. 6). However, this amount is far beyond a typical loss being reported by individuals (or even businesses) and research has previously shown that cybercrime and fraud may result in victim-impacts beyond finan-cial loss. These may include feelings of stress, physical or mental health problems, strain on relationships and worsening personal credit rating, among others (Button et al. 2012). As such, to adequately prioritise cases for a
Fig. 2 Frequency of type of crime (analytical categories) by victim type (N = 17,049)
14 There were two cells with minimum expected frequencies below 5 and the minimum expected frequency overall was 4.4. However, as previously noted, with a larger contingency table it is acceptable to have up to 20% of expected frequencies below 5, given that no expected frequencies are below 1 (Field et al. 2012, p. 818).
15 At the same time, the researcher also found instances where a loss amount was recorded by Action Fraud within free-text field for the incident descrip-tion, but this was not recorded in the appropriate numerical variable. Issues of data accuracy and usefulness are returned to in the conclusion to this paper. 16 Although according to the Fraud Act 2006 the offence of fraud is
victim-focused response, the reporting system may also need to capture victim-impacts beyond financial loss.
Finally, victim heterogeneity was found in terms of the level of repeat victimisation within the sampled data. In order to assess repeat victimisation, two new vari-ables were computed from the original dataset prior to anonymisation: ‘repeat premises’ is a count of the num-ber of repeat reports from the same premises by match-ing victims’ first line of address and postcode (includmatch-ing all victims), ‘repeat victim’ is a count of how many reports from the same individual (excluding corporations) could be found by matching on victim’s name, date of birth and address.17 Overall, 30% of business reports were associ-ated with repeat premises and 10% of individual reports emanated from repeat victims. In addition, as indicated in Tables 5 and 6, there was some variation in the number of times a business/individual repeatedly reported.
Police demand and response
Of all the reports received from victims within the four Welsh police forces for the period under study (N = 17,049), most crimes were reported by victims within the jurisdic-tion of South Wales police force (41%). This is unsurpris-ing as this is the area with the largest population as well as
the most internet access. Of the reports received, 19% were ‘actioned’ in some way (N = 3225), as indicated by hav-ing been recorded as referred to a police force, a partner agency, classified with an outcome or progressed in some way on the AF dataset. In approximately 5% of all cases, the force by whom the case of actioned is known. Table 3 provides a summary of the various categories of outcome identified in this dataset. Of the 19% of cases that were actioned, most were referred for enforcement-type actions. In contrast, fewer cases were actioned to address victim support needs as indicated by the lower percentage of cases referred to a partner agency (1%) and victim care (0.25%).
On one level, this is in line with the policy priorities set by the UK government in the National Cyber Secu-rity Strategy 2016–2021 (HM Government 2016) and the Serious and Organised Crime Strategy (HM Government 2013, 2018). Both these strategies emphasise investigation of organised and persistent offenders and the protection of national critical infrastructure, while having less of a focus on victim support and what is referred to as high volume and/or low sophistication crime. In fact, the way in which Action Fraud reports are prioritised and selected for manual review by the NFIB for possible dissemina-tion inherently favours investigadissemina-tion over other outcomes such as victim services or intelligence (Scholes 2018). At this crucial stage of the victim journey, AF reports are col-lected in the NFIB’s “Known Fraud” database, whereby a
Fig. 3 Effect plot of GLM model of age category ~ crime category
computer programme selects cases for review and dis-semination based on the existence of potential lines of enquiry (Ibid.). Victim vulnerability is not assessed cen-trally in the same way. However, if victim-response is left for local forces to lead on, they would benefit from more guidance and better quality data (Table 7).
Conclusion
This paper considered the quality of the data which UK law enforcement agencies gather from victims of computer misuse and fraud offences, with respect to their information needs to provide an adequate victim response. Furthermore, it considered the heterogeneity of the victims who report and the level of police response. The analysis presented draws on the early results from a mixed-methods sequential study based on a sample of
crime reports made within the four Welsh police forces to Action Fraud (AF), the UK’s national reporting centre.
It is argued that AF data provides a rich data source to identify victim needs. At the same time, specific improve-ments in data collection and processing could aid local forces in the delivery of a victim-focused response, thereby properly addressing the government’s priorities as set out in the Victims Charter. As it stands, the data col-lected by AF and shared with local police forces appears insufficient to conduct a victim vulnerability assessment. In addition, quality issues and under-reporting will neg-atively impact on the strategic insight that can be drawn from this data.
While no large differences were found with respect to the types of crimes reported across demographic char-acteristics, there was some heterogeneity in terms of the Table 3 Regression parameters for multinomial linear model age category ~ crime category
Model: log
PrY=j
PrY=j′
=β0+β1Crimecategory(Card and Banking)+β2Crimecategory(Consumer fraud)
+β3Crimecategory(Hacking)+β4Crimecategory(Investment fraud)
+β5Crimecategory(Malware,Virus and DDOS)+β6Crimecategory(Other fraud)
+β7Crimecategory(Services fraud)
where j′ = reference category (age category = 0–36 years old)
β0=Advancefeefraud
Age category Parameter (crime category) Estimate (β) Standard error Wald statistic Odds-ratio
37–52 (Intercept) − 0.09 0.06 − 1.4 0.92
Card and banking − 0.24 0.14 − 1.8 0.79
Consumer fraud 0.14 0.08 1.9 1.15
Hacking 0.02 0.12 0.16 1.02
Investment fraud 0.98 0.98 3.2 2.7
Malware virus DDOS − 0.09 − 0.09 − 0.59 0.91
Other fraud − 0.01 − 0.01 − 0.12 0.99
Services fraud − 0.04 − 0.04 − 0.26 0.96
53–66 (Intercept) 0.18 0.06 3.0 1.20
Card and banking − 0.73 0.14 − 5.2 0.48
Consumer fraud − 0.16 0.07 − 2.2 0.85
Hacking − 0.80 0.13 − 6.06 0.45
Investment fraud 1.31 0.28 4.6 3.7
Malware virus DDOS − 0.32 0.15 − 2.08 0.73
Other fraud − 0.28 0.09 − 3.04 0.75
Services fraud − 0.76 0.18 − 4.23 0.47
> 67 (Intercept) 0.43 0.06 7.6 1.54
Card and banking − 1.03 0.14 − 7.3 0.36
Consumer fraud − 0.60 0.07 − 8.6 0.55
Hacking − 1.47 0.15 − 9.98 0.23
Investment fraud 1.02 0.28 3.6 2.8
Malware virus DDOS − 1.36 0.19 − 7.21 0.26
Other fraud − 0.45 0.09 − 5.04 0.64
financial losses and level of repeat victimisation. The pro-portion of no-loss reports suggests that a victim-focused response needs to capture victim-impacts beyond finan-cial loss. In addition, a small number of victims reported repeatedly over the time-period in question. Further research is needed to substantiate the link between repeat victimisation and vulnerability.
The meaning of ‘vulnerability’ also needs to be better understood in relation to victims of CM and fraud. The Code of Practice for Victims of Crime (MOJ 2015) and the crime plans developed by the Police and Crime Com-missioners for each of the Welsh police forces (Dyfed
Powys PCC 2017; Gwent PCC 2017; North Wales PCC
2017; South Wales PCC 2017) all commit to protecting and responding to the needs of vulnerable victims. How-ever, little is currently done in the way of analysing AF Table 4 Original and coded variables according to base,
number of unique levels and percentage of missing data (N = 17,049)
a Percentage missing calculated based on reports identified as relating to individual victims, N = 13,290 (businesses, charities and public sector victims excluded)
b Percentage missing calculated based on reports by business victims only, N = 2516
Base (n) Levels Missing (%)
Original variables
Police force 17,049 4 0
Reported date 17,049 751 0
NFIB category 17,049 55 0
Victim partial postcode 17,049 244 0
Victim agea 10,846 122 18
Victim ethnicitya 8668 17 35
Financial loss 11,874 1971 30
Force disseminated to 997 54 94
Partner agency disseminated to 227 7 99
Primary purpose (outcome) 1725 12 90
Call for service progress 2228 14 87
Derived and (re)coded variables
Crime category (analytical categories) 17,047 11 0.01
Crime group (fraud/CM) 17,049 2 0
Any online MO 15,431 2 9
Any offline MO 15,339 2 10
Mixed MO 15,339 2 10
Crime MO group 15,339 3 10
Victim type 15,952 3 6%
Victim gendera 13,011 2 2%
Victim ethnic groupa 8668 2 35
Repeat victim (individual)a 13,290 8 0
Repeat victim (premises) 17,049 19 0
Business sectorb 2428 21 3%
Table 5 Number of reports (and %) from the same business premises (N = 2432) and individual households (N = 13,290)
Number of reports Businesses
premises % Households %
1 (unique) 1710 70 11,777 89
2 322 13 1176 9
3 107 4 194 2
4 65 3 56 0.4
5–9 77 3 86 0.6
10–14 22 0.9 1 0.0
15–19 17 0.7 0 0
> 20 112 5 0 0
Table 6 Number of reports (and %) from the same individual victims (N = 13,290)
Number of reports Individuals %
1 (unique) 11,977 90
2 1012 8
3 179 1
4 37 0.3
5 31 0.2
6 24 0.2
7 6 0.0
8 24 0.2
Table 7 Records of cases actioned, Wales (N = 17,049)
Recorded action Frequency Percentage
of total
Actioned Enforcement 796 5
Force (misc) 14 0.08
Intelligence 10 0.06
Investigation closed 531 3
Investigation ongoing 1343 8 Partner agency referral 227 1
Prevention 175 1
Transferred to another
force 86 0.5
Victim care 43 0.25
Total 3225 19
Not actioned Filed 329 2
No investigation 176 1
NA 13,319 78
data for indicators of vulnerability. To achieve this, fur-ther research is needed into what these factors and indi-cators are. Once vulnerability is properly understood with respect to these crime types, it is suggested that applying the latest technology such as machine learn-ing to developlearn-ing a referral system for victim support services would go some way to putting the victim at the centre of computer crime and fraud policy. This would require however, a higher level of accuracy in the record-ing of these crime types. Alongside this, it is important to ensure that the various levels of policing and victim sup-port responsibility do not result in a lack of ownership of victim support services.
Abbreviations
AF: Action Fraud; CM: computer misuse; CSEW: Crime Survey for England and Wales; GLM: generalised linear model; MO: Modus Operandi; MOJ: Ministry of Justice (UK); NFIB: National Fraud Intelligence Bureau; ONS: Office for National Statistics; PCCs: Police and Crime Commissioners; PRC: police recorded crime; ROCU: Regional Organised Crime Unit; UK: United Kingdom.
Authors’ contributions
Not applicable as it is a single author publication. The author read and approved the final manuscript.
Authors’ information
Sara Giro Correia is a doctoral researcher at the Hillary Rodham Clinton School of Law at Swansea University. During her PhD programme, Sara has interned with the Cybercrime Unit at the Southern Wales Regional Organised Crime Unit, as well as with the Office for Security and Counter-Terrorism: Research and Analysis (OSCT R&A) at the UK Home Office.
Acknowledgements
The author would like to thank everyone at the cyber unit in the Southern Wales Regional Organised Crime Unit (ROCU) for their support in making this project possible. This piece is also indebted to the constructive feedback of Prof. Stuart Macdonald at Swansea University, as well as the extensive feedback of the two independent reviewers. I am very grateful for their time and consideration.
Competing interests
The author declares no competing interests.
Availability of data and materials
The data cannot be shared at present as agreement for this has not been provided by the research partners.
Funding
This research was funded by an Economic and Social Research Council (ESRC) Ph.D. studentship.
Publisher’s Note
Springer Nature remains neutral with regard to jurisdictional claims in pub-lished maps and institutional affiliations.
Received: 6 June 2018 Accepted: 6 April 2019
References
Anderson, R., Barton, C., Böhme, R., Clayton, R., van Eeten, M. J. G., Levi, M., et al. (2013). Measuring the cost of cybercrime (pp. 265–300). Berlin: Springer. https ://doi.org/10.1007/978-3-642-39498 -0_12.
Blakeborough, L., & Correia, S. (2018). The scale and nature of fraud: A review of the evidence. Retrieved from https ://www.gov.uk/gover nment /publi catio ns/the-scale -and-natur e-of-fraud -a-revie w-of-the-evide nce. Accessed 11 Apr 2019.
Buchanan, T., & Whitty, M. T. (2014). The online dating romance scam: causes and consequences of victimhood. Psychology, Crime & Law,20(3), 261–283.
Button, M., Lewis, C., & Tapley, J. (2009a). Fraud typologies and victims of fraud literature review. Retrieved from https ://www.gov.uk/gover nment /uploa ds/syste m/uploa ds/attac hment _data/file/11846 9/fraud -typol ogies .pdf. Accessed 11 Apr 2019.
Button, M., Lewis, C., & Tapley, J. (2009b). A better deal for fraud victims: Research into victims’ needs and experiences, London. Retrieved from https :// www.gov.uk/gover nment /uploa ds/syste m/uploa ds/attac hment _data/ file/11846 8/bette r-deal-for-fraud -victi ms.pdf. Accessed 11 Apr 2019. Button, M., Lewis, C., & Tapley, J. (2012). Not a victimless crime: the impact of fraud on individual victims and their families. Security Journal,27(1), 36–54.
Button, M., Nicholls, C. M., Kerr, J., & Owen, R. (2014). Online frauds: Learning from victims why they fall for these scams. Australian & New Zealand Journal of Criminology,47(3), 391–408.
Christie, N. (1986). The ideal victim. In E. A. Fattah (Ed.), From crime policy to victim policy. Macmillan: Simon Fraser University.
City of London Police. (2015a). (Draft) National Fraud “Protect” Strategy. In N. P. C. f. E. Crime (Ed.).
City of London Police. (2015b). (Draft) National Policing Fraud Strategy. In N. P. C. f. E. Crime (Ed.).
Creswell, J. W., Plano Clark, V. L., Gutmann, M., & Hanson, W. (2003). Advanced mixed methods research designs. In A. Tashakkori & C. Teddlie (Eds.),
Handbook on mixed methods in the behavioral and social sciences (pp. 209–240). London: Sage.
Dyfed Powys PCC. (2017). Police and crime plan 2017–2021.
Eurostat. (2017). European Statistics Code of Practice. For the National Statistical Authorities and Eurostat (EU statistical authority). Luxembourg.
Field, A., Miles, J., & Field, Z. (2012). Discovering statistics using R. Beverly Hills: SAGE Publications.
Flatley, J. (2013). The measurement of fraud and cyber-crime and their implica-tions for crime statistics, Report to the Crime Statistics Advisory Commit-tee. London: Office for National Statistics.
Fox, J. (2003). Effect displays in R for generalised linear models. Journal of Statistical Software,8(15), 1–27.
Fox, J., & Weisberg, S. (2011). An R companion to applied regression (2nd ed.). London: Sage Publications.
Gini, G., Card Noel, A., & Pozzoli, T. (2017). A meta-analysis of the differential relations of traditional and cyber-victimization with internalizing prob-lems. Aggressive Behavior,44(2), 185–198.
Goudriaan, H. (2006). Reporting crime: Effects of social context on the decision of victims to notify the police. (Doctoral thesis), Leiden University, Leiden. Retrieved from https ://opena ccess .leide nuniv .nl/handl e/1887/4410. Accessed 11 Apr 2019.
Grabosky, P. N., & Smith, R. G. (1998). Crime in the digital age: Controlling tel-ecommunications and cyberspace illegalities. New Brunswick: Transaction Publishers/The Federation Press.
Gwent PCC. (2017). Gwent police and crime plan 2017–2021.
Hall, M. (2018). Supporting victims of crime in England and Wales: Local commissioning meeting local needs? International Review of Victimology, 24(2), 219–237.
HM Government. (2006). Fraud review. Serious and Organised Crime Strategy, 8715 (2013). Retrieved from.
HM Government. (2016). National cyber security strategy 2016–2021. Serious and Organised Crime Strategy, 9718. Retrieved 1 November 2018 from https :// www.gov.uk/gover nment /uploa ds/syste m/uploa ds/attac hment _data/ file/56724 2/natio nal_cyber _secur ity_strat egy_2016.pdf.
Home Office. (2015). Counting rules for recorded crime: Fraud. Retrieved from https ://www.gov.uk/gover nment /publi catio ns/count ing-rules -for-recor ded-crime . Accessed 11 Apr 2019.
Home Office. (2018a). Street-level crime. Retrieved from https ://data.polic e.uk/ data/fetch /970d8 acd-0749-43d5-9f59-e83aa 51133 e9/. Accessed 11 Apr 2019.
•fast, convenient online submission
•
thorough peer review by experienced researchers in your field
• rapid publication on acceptance
• support for research data, including large and complex data types
•
gold Open Access which fosters wider collaboration and increased citations maximum visibility for your research: over 100M website views per year
•
At BMC, research is always in progress.
Learn more biomedcentral.com/submissions
Ready to submit your research? Choose BMC and benefit from:
Retrieved from London: https ://asset s.publi shing .servi ce.gov.uk/gover nment /uploa ds/syste m/uploa ds/attac hment _data/file/67404 6/under stand ing-costs -of-cyber -crime -horr9 6.pdf. Accessed 11 Apr 2019. Hutcheson, G., & Schaefer, L. (2012). Test selection in the 21st century. Journal
of Modelling in Management,7(3), 375–387.
Hutcheson, G., & Sofroniou, N. (1999). The multivariate social scientist: Introduc-tory statistics using generalized linear models. London: Sage.
Ivankova, N. V., Creswell, J. W., & Stick, S. L. (2006). Using mixed-methods sequential explanatory design: From theory to practice. Field Methods, 18(1), 3–20.
Jarvis, L., Macdonald, S., & Whiting, A. (2015). Constructing cyberterrorism as a security threat a study of international news media coverage. Perspec-tives on Terrorism, 9(1), 60–75. Retrieved from http://www.jstor .org/stabl e/26297 327.
Johnson, R. B., Onwuegbuzie, A. J., & Turner, L. A. (2007). Toward a definition of mixed methods research. Journal of Mixed Methods Research,1(2), 112–133.
Levi, M. (2006). White-collar, organised and cyber crimes in the media: Some contrasts and similarities. Crime Law and Social Change,49(6), 365–377. https ://doi.org/10.1007/s1061 1-008-9111-y.
Levi, M. (2008). Suite revenge?: The shaping of folk devils and moral panics about White-Collar crimes. The British Journal of Criminology,49(1), 48–67. Levi, M. (2017). Assessing the trends, scale and nature of economic
cyber-crimes: Overview an dissues. Crime, Law and Social Change,67(1), 3–20. https ://doi.org/10.1007/s1061 1-016-9645-3.
Levi, M., & Burrows, J. (2008). Measuring the impact of fraud in the UK: A conceptual and empirical journey. British Journal of Criminology,48(3), 293–318.
Levi, M., Doig, A., Gundur, R., Wall, D., & Williams, M. (2017). Cyberfraud and the implications for effective risk-based responses: Themes from UK research.
Crime, Law and Social Change,67(1), 77–96.
MacDonald, Z. (2001). Revisiting the dark figure: A microeconometric analysis of the under-reporting of property crime and its implications. The British Journal of Criminology,41(1), 127–149.
McGuire, M., & Dowling, S. (2013). Cyber crime: A review of the evidence. Retrieved from https ://www.gov.uk/gover nment /publi catio ns/cyber -crime -a-revie w-of-the-evide nce. Accessed 11 Apr 2019.
MOJ. (2015). Code of practice for victims of crime. Ministry of Justice. Retrieved from https ://www.cps.gov.uk/legal /asset s/uploa ds/files /OD_00004 9.pdf. Accessed 11 Apr 2019.
North Wales PCC. (2017). Police and crime plan 2017–2021.
ONS. (2017). Percentage of incidents of fraud and computer misuse reported to Action Fraud, and reasons for not reporting incidents to Action Fraud, year ending September 2016 CSEW (Experimental Statistics). Retrieved from https ://www.ons.gov.uk/peopl epopu latio nandc ommun ity/crime andju stice /adhoc s/00662 6perc entag eofin ciden tsoff rauda ndcom puter misus erepo rtedt oacti onfra udand reaso nsfor notre porti nginc ident stoac tionf raudy earen dings eptem ber20 16cse wexpe rimen talst atist ics. Accessed 11 Apr 2019.
ONS. (2018a). Crime in England and Wales: Appendix tables. Retrieved from https ://www.ons.gov.uk/relea ses/crime ineng landa ndwal esyea rendi ngmar ch201 8. Accessed 11 Apr 2019.
ONS. (2018b). Quality defined; the work we are doing to monitor and improve quality.
ONS. (2019). Crime in England and Wales: Appendix tables. Retrieved from https ://www.ons.gov.uk/peopl epopu latio nandc ommun ity/crime andju stice /datas ets/crime ineng landa ndwal esapp endix table s. Accessed 11 Apr 2019.
Scholes, A. (2018). The scale and drivers of attrition in reported fraud and cyber crime. London. Retrieved from https ://www.gov.uk/gover nment /publi catio ns/the-scale -and-drive rs-of-attri tion-in-repor ted-fraud -and-cyber -crime . Accessed 11 Apr 2019.
Skogan, W. G. (1984). Reporting crimes to the police: The status of world research. Journal of Research in Crime and Delinquency,21(2), 113–137. South Wales PCC. (2017). Police & crime reduction plan 2017–2021.
Tarling, R., & Morris, K. (2010). Reporting crime to the police. The British Journal of Criminology,50(3), 474–490.
UKSA. (2014). Statistics on crime in England and Wales, London. Retrieved from. Wall, D. S. (2001). Crime and the internet. London: Routledge.
Whitty, M. T. (2015). Anatomy of the online dating romance scam. Security Journal,28(4), 443–455.
Yar, M. (2006). Cybercrime and society (1st ed.). London: SAGE Publications. Zawitz, M. W., Klaus, P. A., Bachman, R., Bastian, L. D., DeBerry, M. M., Rand, M. R.,