BioMed Central
Page 1 of 17 (page number not for citation purposes)
Molecular Neurodegeneration
Open Access
Methodology
Optimisation of region-specific reference gene selection and
relative gene expression analysis methods for pre-clinical trials of
Huntington's disease
Caroline L Benn, Helen Fox and Gillian P Bates*
Address: Medical and Molecular Genetics, King's College London School of Medicine, 8th Floor Tower Wing, Guy's Hospital, Great Maze Pond, London, SE1 9RT, UK
Email: Caroline L Benn - [email protected]; Helen Fox - [email protected]; Gillian P Bates* - [email protected]
* Corresponding author
Abstract
Background: Transcriptional dysregulation is an early, key pathogenic mechanism in Huntington's disease (HD). Therefore, gene expression analyses have biomarker potential for measuring therapeutic efficacy in pre-clinical trials, particularly those aimed at correcting gene expression abnormalities. Housekeeping genes are commonly used as endogenous references in gene expression studies. However, a systematic study comparing the suitability of candidate reference genes for use in HD mouse models has not been performed. To remedy this situation, 12 housekeeping genes were examined to identify suitable reference genes for use in expression assays.
Results: We found that commonly used reference genes are dysregulated at later time points in the R6/2 mouse model of HD. Therefore, in order to reliably measure gene expression changes for use as pre-clinical trial biomarkers, we set out to identify suitable reference genes for use in R6/ 2 mice. The expression of potential reference genes was examined in striatum, cortex and cerebellum from 15 week old R6/2 and matched wild-type littermates. Expression levels of candidate reference genes varied according to genotype and brain region. GeNorm software was used to identify the three most stably expressed genes for each brain region. Relative quantification methods using the geometric mean of three reference genes for normalisation enables accurate determination of gene expression levels in wild-type and R6/2 mouse brain regions.
Conclusion: Our study has identified a reproducible, reliable method by which we able to accurately determine the relative expression level of target genes in specific brain regions, thus increasing the potential of gene expression analysis as a biomarker in HD pre-clinical trials.
Background
Huntington's disease (HD) is an autosomal dominant, late-onset neurodegenerative disorder caused by a CAG repeat expansion in exon 1 of the HD gene which
trans-lates into a polyglutamine (polyQ) tract in the huntingtin (Htt) protein [1]. HD thus belongs to a group of neurode-generative disorders caused by polyQ expansion, which include spinal and bulbar muscular atrophy (SBMA),
den-Published: 27 October 2008
Molecular Neurodegeneration 2008, 3:17 doi:10.1186/1750-1326-3-17
Received: 10 June 2008 Accepted: 27 October 2008
This article is available from: http://www.molecularneurodegeneration.com/content/3/1/17
© 2008 Benn et al; licensee BioMed Central Ltd.
Molecular Neurodegeneration 2008, 3:17 http://www.molecularneurodegeneration.com/content/3/1/17
Page 2 of 17 (page number not for citation purposes) tatorubral pallidoluysian atrophy (DRPLA) and the
spinocerebellar ataxias (SCA) types 1, 2, 3, 6, 7, and 17 [2]. The polyQ motif occurs in many transcription factors and can function as a transcriptional activation domain. Interestingly, polyQ repeat expansions in TATA binding protein (TBP) and the androgen receptor (AR) cause the disorders SCA17 and SBMA, respectively. Indeed, polyQ repeat containing disease proteins are increasingly impli-cated as mediators of gene expression, with deranged tran-scription profiles observed as a result of polyQ repeat expansion [3-10].
Transcriptional dysregulation is a central pathogenic mechanism in HD [11,12]. Gene expression profiling of
in vitro and in vivo models of HD such as the R6/2 mouse model reveals the identities of specifically altered mRNAs that recapitulates those altered in human HD patient brains [13,14]. Indeed, comparison of gene expression studies shows remarkable concordance between mouse models and human HD brain [15]. Furthermore, expres-sion profiling studies suggest that more accessible tissues such as muscle may be suitable for gene expression analy-ses [16], although the use of blood is more controversial [17,18].
Reverse transcriptase quantitative polymerase chain reac-tion (qRT-PCR) is a powerful tool to obtain data about gene expression. Normalisation enables one to determine the change in mRNA levels of a gene of interest from mul-tiple samples versus one or more reference gene(s), often a housekeeping gene [19-21]. Reference genes are selected on the basis of constitutive expression across samples to allow the reliable quantification of changes in gene expression [21]. At present, a universally optimal refer-ence gene has not been identified for any organism that can be used across different tissue types or disorders.
Clearly, in a disease such as HD where transcriptional dys-regulation is a prominent pathological feature, identifica-tion of suitable reference genes throughout the disease time-course is critical. This is amply demonstrated by data showing that beta-actin (Actb), a commonly-used refer-ence, is dysregulated at late time points in R6/2 mouse brain [22]. However, a systematic study comparing the suitability of different candidate reference genes in HD has not been performed. To remedy this situation, 12 housekeeping genes were examined to determine their utility as references in three distinct dissected brain regions from 15 week old R6/2 mice and littermate con-trols. We found that the expression levels of candidate ref-erence genes varied according to genotype and brain region, highlighting the necessity of identifying suitable references in the tissue or cell line under study. GeNorm software was used to identify the three most stably expressed genes for each brain region, from which the
geometric mean was derived as a reliable normalisation value for relative gene expression level analyses. Taken together, we propose that the method outlined in this study can be applied in different tissue samples in order to reliably generate gene expression changes as a biomarker in genetic and pharmacological approaches to modifying HD related phenotypes.
Results
Mice
Hemizygous R6/2 transgenic mice were bred and reared in our colony by backcrossing R6/2 males to (CBA × C57Bl/ 6) F1 females (B6CBAF1/OlaHsd, Harlan Olac, Bicester, UK) [23]. The R6/2 mouse model of HD ubiquitously expresses exon 1 of the human HD gene with over 150 CAG repeats, and develops neuropathology, cognitive and motor symptoms. R6/2 mice were always housed with wild type mice and were subject to a 12-h light: 12-h dark cycle. All animals had unlimited access to water and breeding chow and housing conditions and environmen-tal enrichment were as previously described [24]. R6/2 transgenic mice and wild-type littermate controls were sacrificed by cervical dislocation and brains rapidly removed. Striatum, cortex and cerebellum were dissected and flash-frozen in liquid nitrogen and stored at -80°C until use. The guidelines for animal care and use were in accordance with Home Office regulations.
RNA extraction and reverse transcription
Quantitative RT-PCR (qRT-PCR) represents a powerful tool for detection and quantification of mRNA with high sensitivity, good reproducibility and a wide dynamic range. The principles of qRT-PCR: RNA extraction, reverse transcription (RT), quantitative PCR, fluorescent chemis-try and appropriate real-time platforms are all extensively described in the literature [20,25], and through internet forums http://www.gene-quantification.de/. Each step can directly impact the reliability of the assay and quality assessment is essential to minimise variability (see Addi-tional File 1).
alter-Molecular Neurodegeneration 2008, 3:17 http://www.molecularneurodegeneration.com/content/3/1/17
Page 3 of 17 (page number not for citation purposes) natives include the nanodrop procedure or the use of 3':5'
assays [25].
The RT step is the source of most of the variability and is critically dependent on both enzyme choice and priming method. Target gene-specific primers can be used success-fully to eliminate spurious transcripts but then separate RT reactions are needed for each gene of interest, which is inefficient when surveying several genes, and further-more, different reactions do not have the same cDNA syn-thesis efficiency. We therefore use MMLV RT-ase (Invitrogen) together with random hexamers to synthe-sise a cDNA pool which is used for a number of different target-specific qPCR assays (see Additional File 1). In order to minimise variability, we prepare all experimental samples intended for comparison by qRT-PCR in parallel, adding the same amount of RNA template to each RT reac-tion. Reverse transcription of total RNA (either 5 μg of RNA from cerebellum and cortex or 1 μg of striatal RNA) was performed with MMLV RTase (Invitrogen). The cDNA samples were then cooled to 4°C and diluted 1:10 before storing at -20°C.
Real-time quantitative PCR (qRT-PCR)
QPCR uses fluorescent reporter dyes to combine the amplification and detection steps of the PCR reaction. The qPCR assay relies on measuring the increase in fluorescent signal, which is proportional to the amount of DNA pro-duced during the logarithmic phase of the PCR cycle. Indi-vidual reactions are characterised by the PCR cycle at which fluorescence first rises above a defined or threshold background fluorescence, a parameter known as the threshold cycle (Ct). The more target there is in the start-ing material, the lower the Ct. This correlation between fluorescence and amount of amplified product permits accurate quantification over a wide dynamic range, while retaining the sensitivity and specificity inherent in a con-ventional PCR. An additional benefit is conferred by reducing variability which can be introduced post-RT-PCR (such as ethidium bromide gel staining and densitometric analysis). We use two methods for the quantitative detec-tion of the amplicon: (a) gene-specific fluorescent Taq-man probes, or (b) SYBR green, a non-sequence specific fluorescent intercalating double-stranded DNA binding dye. Both types of reaction can work extremely well, with comparable dynamic range and sensitivity. An additional advantage conferred by the Taqman system is the use of probes labelled with different reporter dyes, allowing the detection and quantification of multiple target genes in a single (multiplex) reaction.
qPCR reactions are performed in triplicate with 5 μl of diluted cDNA template in a 25 μl reaction containing Pre-cision Mastermix (PrimerDesign), 300 nM primers and 200 nM probe using the Opticon 2 and Chromo4
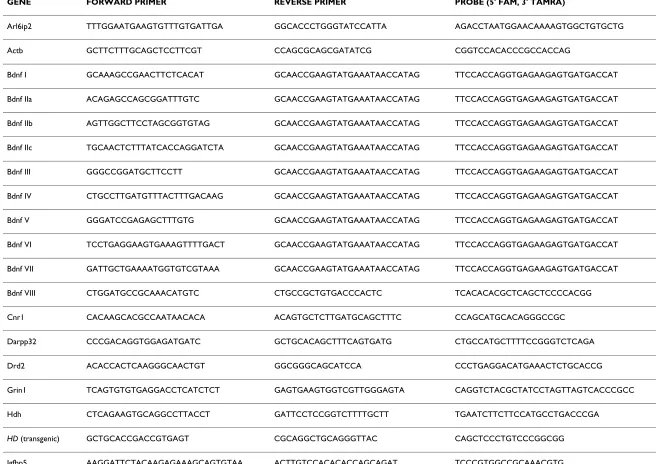
real-time PCR machines (Biorad). We preferentially use the Taqman system and therefore, primers and probes were designed using Primer Express software (Table 1). Probes were tagged with a FAM fluophore and a TAMRA quencher. Crossing threshold data were obtained during the logarithmic phase of amplification where efficiency was close to 100%.
Quantification strategy
Finally, the quantification strategy must be considered. Absolute quantification correlates the PCR signal to input copy number using a calibration curve, and is dependent on equivalent amplification efficiencies for both the native target and the calibration curve. Absolute quantifi-cation should be performed in situations where it is nec-essary to determine the transcript copy number, such as determining the titre of virus particles in blood. In con-trast, relative quantification measures the relative change in mRNA expression levels and is easier to perform than absolute quantification because a calibration curve is not necessary. Relative quantification is based on the expres-sion levels of target gene(s) versus reference gene(s) and the relative quantities can be compared across multiple experiments. We use relative quantification when consid-ering genetic and/or pharmacological modulation of HD related phenotypes. With respect to understanding the effect of a manipulation in a pathogenic pathway, it is more informative to state that a given treatment increases the expression of gene A by 5 fold, than if we state that the treatment increases the expression of gene A from 1000 copies to 5000 copies per cell [19]. Various mathematical models have been established to calculate the expression of a target gene in relation to an adequate reference, based on the comparison of the distinct cycle threshold values (Ct) at a constant level of fluorescent with, or without PCR efficiency correction. We use a well-characterised 2-ΔΔCt equation, as our target and reference PCR amplicons are generated with equivalent efficiencies [20].
Data analysis using the 2-ΔΔCt method
Molecu
lar Neurod
ege
neratio
n
2
008
,
3
:17
http
://www.molecu
larne
urode
gene
ration.com/content/3/1/1
7
Pa
ge 4 of
1
7
(page nu
mber not
for
cit
a
tion pur
poses)
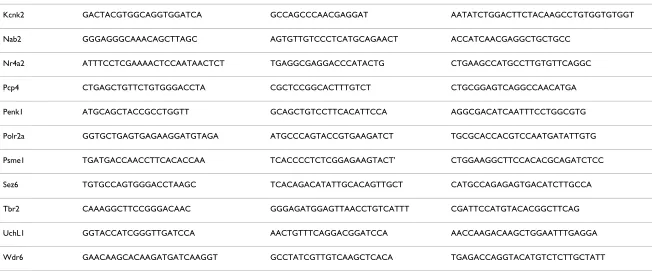
Table 1: Primer and probe lists.
GENE FORWARD PRIMER REVERSE PRIMER PROBE (5' FAM, 3' TAMRA)
Arl6ip2 TTTGGAATGAAGTGTTTGTGATTGA GGCACCCTGGGTATCCATTA AGACCTAATGGAACAAAAGTGGCTGTGCTG
Actb GCTTCTTTGCAGCTCCTTCGT CCAGCGCAGCGATATCG CGGTCCACACCCGCCACCAG
Bdnf I GCAAAGCCGAACTTCTCACAT GCAACCGAAGTATGAAATAACCATAG TTCCACCAGGTGAGAAGAGTGATGACCAT
Bdnf IIa ACAGAGCCAGCGGATTTGTC GCAACCGAAGTATGAAATAACCATAG TTCCACCAGGTGAGAAGAGTGATGACCAT
Bdnf IIb AGTTGGCTTCCTAGCGGTGTAG GCAACCGAAGTATGAAATAACCATAG TTCCACCAGGTGAGAAGAGTGATGACCAT
Bdnf IIc TGCAACTCTTTATCACCAGGATCTA GCAACCGAAGTATGAAATAACCATAG TTCCACCAGGTGAGAAGAGTGATGACCAT
Bdnf III GGGCCGGATGCTTCCTT GCAACCGAAGTATGAAATAACCATAG TTCCACCAGGTGAGAAGAGTGATGACCAT
Bdnf IV CTGCCTTGATGTTTACTTTGACAAG GCAACCGAAGTATGAAATAACCATAG TTCCACCAGGTGAGAAGAGTGATGACCAT
Bdnf V GGGATCCGAGAGCTTTGTG GCAACCGAAGTATGAAATAACCATAG TTCCACCAGGTGAGAAGAGTGATGACCAT
Bdnf VI TCCTGAGGAAGTGAAAGTTTTGACT GCAACCGAAGTATGAAATAACCATAG TTCCACCAGGTGAGAAGAGTGATGACCAT
Bdnf VII GATTGCTGAAAATGGTGTCGTAAA GCAACCGAAGTATGAAATAACCATAG TTCCACCAGGTGAGAAGAGTGATGACCAT
Bdnf VIII CTGGATGCCGCAAACATGTC CTGCCGCTGTGACCCACTC TCACACACGCTCAGCTCCCCACGG
Cnr1 CACAAGCACGCCAATAACACA ACAGTGCTCTTGATGCAGCTTTC CCAGCATGCACAGGGCCGC
Darpp32 CCCGACAGGTGGAGATGATC GCTGCACAGCTTTCAGTGATG CTGCCATGCTTTTCCGGGTCTCAGA
Drd2 ACACCACTCAAGGGCAACTGT GGCGGGCAGCATCCA CCCTGAGGACATGAAACTCTGCACCG
Grin1 TCAGTGTGTGAGGACCTCATCTCT GAGTGAAGTGGTCGTTGGGAGTA CAGGTCTACGCTATCCTAGTTAGTCACCCGCC
Hdh CTCAGAAGTGCAGGCCTTACCT GATTCCTCCGGTCTTTTGCTT TGAATCTTCTTCCATGCCTGACCCGA
HD (transgenic) GCTGCACCGACCGTGAGT CGCAGGCTGCAGGGTTAC CAGCTCCCTGTCCCGGCGG
Molecu
lar Neurod
ege
neratio
n
2
008
,
3
:17
http
://www.molecu
larne
urode
gene
ration.com/content/3/1/1
7
Pa
ge 5 of
1
7
(page nu
mber not
for
cit
a
tion pur
poses)
Kcnk2 GACTACGTGGCAGGTGGATCA GCCAGCCCAACGAGGAT AATATCTGGACTTCTACAAGCCTGTGGTGTGGT
Nab2 GGGAGGGCAAACAGCTTAGC AGTGTTGTCCCTCATGCAGAACT ACCATCAACGAGGCTGCTGCC
Nr4a2 ATTTCCTCGAAAACTCCAATAACTCT TGAGGCGAGGACCCATACTG CTGAAGCCATGCCTTGTGTTCAGGC
Pcp4 CTGAGCTGTTCTGTGGGACCTA CGCTCCGGCACTTTGTCT CTGCGGAGTCAGGCCAACATGA
Penk1 ATGCAGCTACCGCCTGGTT GCAGCTGTCCTTCACATTCCA AGGCGACATCAATTTCCTGGCGTG
Polr2a GGTGCTGAGTGAGAAGGATGTAGA ATGCCCAGTACCGTGAAGATCT TGCGCACCACGTCCAATGATATTGTG
Psme1 TGATGACCAACCTTCACACCAA TCACCCCTCTCGGAGAAGTACT' CTGGAAGGCTTCCACACGCAGATCTCC
Sez6 TGTGCCAGTGGGACCTAAGC TCACAGACATATTGCACAGTTGCT CATGCCAGAGAGTGACATCTTGCCA
Tbr2 CAAAGGCTTCCGGGACAAC GGGAGATGGAGTTAACCTGTCATTT CGATTCCATGTACACGGCTTCAG
UchL1 GGTACCATCGGGTTGATCCA AACTGTTTCAGGACGGATCCA AACCAAGACAAGCTGGAATTTGAGGA
Wdr6 GAACAAGCACAAGATGATCAAGGT GCCTATCGTTGTCAAGCTCACA TGAGACCAGGTACATGTCTCTTGCTATT
The forward and reverse primer sequences, together with the Taqman probe sequences for each gene routinely used in our laboratory are listed.
KEY: Arl6ip2 (ADP-ribosylation factor-like 6 interacting protein 2); Actb (beta-actin); Bdnf (Brain-derived neurotrophic factor; Roman numerals refer to promoter-specific amplification);
Cnr1 (Cannabinoid receptor 1); Darpp32 (Dopamine and cAMP regulated neuronal phosphoprotein, also known as Ppp1r1b, protein phosphatase 1, regulatory subunit 1B); Drd2 (Dopamine D2 receptor); Grin1 (glutamate receptor, ionotropic, NMDA1 {zeta 1}); Hdh (Murine huntington's disease gene homologue); Htt (Human Huntington's disease gene, used to detect human exon 1 transgene); Igfbp5 (insulin-like growth factor binding protein 5 precursor); Kcnk2 (potassium channel, subfamily K, member 2); Nab2 (Ngfi-A binding protein 2); Nr4a2 (nuclear receptor subfamily 4, group A, member 2); Pcp4 (Purkinje cell protein 4); Penk1 (Preproenkephalin); Polr2a (RNA polymerase II {DNA directed} polypeptide A); Psme1 (proteasome activator 28-α subunit); Sez6 (seizure related gene 6); Tbr2 (eomesodermin homolog), Uchl1 (ubiquitin carboxyl-terminal hydrolase L1), Wdr6 (WD repeat domain 6).
Molecular Neurodegeneration 2008, 3:17 http://www.molecularneurodegeneration.com/content/3/1/17
Page 6 of 17 (page number not for citation purposes) a ΔCt value of 0 and all the other samples will have
nega-tive values (see Additional File 2). The second step is to perform the function (ΔCt sample - ΔCt reference), which gives a ΔΔCt value. The third step is to calculate 2-ΔΔCt, which yields the expression ratio (as a positive integer) for each individual sample. After performing the 2-ΔΔCt calculation for each sample, we calculate the means for each group in addition to determining the standard deviation and standard error of the mean (SEM) thus providing a rela-tive expression ratio (in arbitrary units) and variation between ratios (see Additional File 2). The expression ratio data are amenable to statistical tests.
Dysregulation of commonly-used normalisation genes in aged R6/2 mice
Modulation of the R6/2 phenotype by genetic or pharma-cological methods involves a comprehensive battery of behavioural tests which are performed up to 14 or 15 weeks of age [24]. At the end of the trial, mice are sacri-ficed and tissues are taken for further biochemical analy-ses such as aggregate quantification [26], or gene expression analyses. However, a systematic study to iden-tify the most suitable reference genes for use in HD mouse models has not been performed. The majority of research-ers in the HD field appear to use beta-actin (Actb) and the NMDA receptor subunit 1 (Grin1) as reference genes. It was recently reported that both Actb and Grin1 were down-regulated at 14 weeks of age in R6/2 brain regions [22]. We therefore set out to determine the suitability of
Actb and Grin1, together with ubiquitin C (Ubc) at 12 and 15 weeks of age in striatum and cerebellum of transgenic R6/2 mice and matched controls. We found down-regula-tion of both Actb and Grin1 mRNA levels in both striatum (Figure 1A, p < 0.05) and cerebellum (Figure 1B, p < 0.05) of 15 week R6/2 mice despite equivalent expression levels in transgenic and control mice at 12 weeks of age. There-fore, the suitability of Actb and Grin1 as references became questionable.
Identification of suitable reference genes in dissected brain regions
Given the progressive nature of the transcriptional dysreg-ulation phenotype in the R6/2 mice, with down-regula-tion of commonly used reference genes such as Actb, it was critical to determine which genes were most suitable for normalisation at later time points. However, to validate the stable expression of a given control gene, prior knowl-edge of a reliable measure to normalise this gene is required. In order to circumvent this circular problem, we took advantage of the principle that the expression ratio of two ideal internal control genes will be near-identical in all samples tested, regardless of the experimental condi-tion [21]. We therefore utilized the geNorm Housekeep-ing Gene Selection Kit (PrimerDesign) to evaluate 12 commonly used housekeeping genes [21] in 3 different
dissected brain regions from 15 week old wild-type and R6/2 mice. Reference genes tested were 18S (18S ribos-omal RNA subunit), Actb (beta-actin), Atp5b (ATP syn-thase subunit 5b), B2m (beta-2 microglobulin), Canx
(calnexin), Cyc1 (cyclin D1), Eif4a2 (eukaryotic initiation factor 4a2), Gapdh (glyceraldehyde-3-phosphate dehydro-genase), Rpl13a (ribosomal protein L13a), Sdha (succi-nate dehydrogenase complex, subunit A), Ubc (ubiquitin C) and Yhwaz (phospholipase A2).
Equal amounts of RNA extracted from striatum dissected from 9 R6/2 mice and 9 wild-type controls were reverse-transcribed and used as a template for real-time PCR using the primer/probe sets provided according to the manufac-turers protocol (PrimerDesign). Each reaction was per-formed in triplicate and the Ct values for each sample were averaged to obtain raw Ct values (Figure 2a). The raw Ct values were transformed into relative quantification data using the 2-ΔΔCt method and used to prepare an input file for geNorm analysis. The geNorm output ranks the candi-date reference genes according to their expression stability (Figure 2b) and determines the number of reference genes required for optimal normalisation, expressed as pairwise variation (V) (Figure 2c). We identified Ubc (ubiquitin C),
Eif4a2 (eukaryotic initiation factor 4a2) and Atp5b (ATP synthase subunit 5b) as being the most stably expressed genes in 15 week wild-type and R6/2 mouse striatum (Table 2). To increase confidence in our data, we con-firmed our findings in a separate cohort of samples (data not shown).
Brain tissue is not homogenous and is composed of widely differing cell types. Consistent with this, microar-ray analysis of distinct brain regions and cell types shows highly specific transcriptional profiles [27-31]. We there-fore set out to determine whether the optimal reference genes identified for use in striatum were also suitable for use as references in two other brain regions, the cerebel-lum and the cerebral cortex. GeNorm analysis was per-formed using RNA prepared from dissected cerebellum (see Additional File 3) and cortex (see Additional File 4) in precisely the same manner as for the striatum. We found that the tissue source determined the choice of genes for normalisation, with Canx (calnexin), Atp5b and
Eif4a2 identified for normalisation in the cerebellum; and
Atp5b, Rpl13a (ribosomal protein L13a) and Canx being suitable choices for the cortex. The cortex showed more expression stability variation than either the striatum or cerebellum, which may reflect a greater heterogeneity in cell types and function.
Validation of reference genes identified through geNorm analyses
Molecular Neurodegeneration 2008, 3:17 http://www.molecularneurodegeneration.com/content/3/1/17
Page 7 of 17 (page number not for citation purposes)
Progressive gene dysregulation in R6/2 mice over time
Figure 1
Progressive gene dysregulation in R6/2 mice over time. (A) Raw crossing threshold data for Actb, Grin1 and Ubc in 12 and 15 week old R6/2 transgenic mice and wild-type littermates in striatum shows an increase in crossing threshold data for both Actb and Grin1 but not Ubc, despite carefully controlling for RNA amounts. (B) Similar data as for (A), except that RNA extracts are from cerebellum. 12 week old wild-type (WT) = white bars, 12 week old R6/2 mice = stripes, 15 week old WT = dots, 15 week old R6/2 = solid fill bars. Error bars are S.E.M. (n = 10), * p < 0.05.
A
B
*
*
*
Striatum
Molecular Neurodegeneration 2008, 3:17 http://www.molecularneurodegeneration.com/content/3/1/17
Page 8 of 17 (page number not for citation purposes) Figure 2 (see legend on next page)
A
B
Molecular Neurodegeneration 2008, 3:17 http://www.molecularneurodegeneration.com/content/3/1/17
Page 9 of 17 (page number not for citation purposes) twelve candidates. We concluded that in order to measure
expression levels of our genes of interest accurately by rel-ative quantification, normalization by multiple house-keeping genes would be more robust. We therefore chose to use the geometric mean of at least the best three refer-ence genes identified for each tissue in our analyses as it indicates the central tendency, or typical value of a set of numbers [21]. Furthermore, the geometric mean is more appropriate than the arithmetic mean as we would expect that changes in the gene expression would occur in a rela-tive fashion and hence we can control better for possible outlying values and abundance differences between the different genes. In order to establish relative expression analyses for dysregulated genes in the striatum of R6/2 mice, we first confirmed that the dynamic Ct range of the reference genes was equivalent to the majority of our genes of interest and that the amplification efficiencies of the reference genes and genes of interest were equivalent.
In order to test the validity of using the geometric mean of three reference genes, we focused on expression of Bdnf in the cortex as this is a target gene of interest in HD [32-36].
We compared the relative expression analysis output for the coding exon of Bdnf from 12 week R6/2 and matched littermate controls with either a single reference gene (with low or high stability between the two genotypes) or with the geometric mean of three reference genes in wild-type and R6/2 cortex. In the first instance, we found that using a single reference gene with a high stability value between the two genotypes (such as Canx in the cortex; p = 0.0016) is superior to using a single reference gene with a poor stability profile between the two genotypes (such as Actb, p = 0.0926) (Figure 3). Furthermore, it was clear that using the geometric mean of three reference genes
GeNorm analyses to identify optimal reference genes in the striatum
Figure 2 (see previous page)
GeNorm analyses to identify optimal reference genes in the striatum. (A) Raw crossing threshold (Ct) data for a panel of 12 potential references from the geNorm kit in wild-type (open bars) and R6/2 (filled bars) mice. (B) Raw Ct data was subjected to analysis with the geNorm applet which automatically calculates the gene-stability measure M, which is an average pairwise variation of a particular gene with all other control genes. Therefore, genes with the lowest M value have the most stable expression, in this case across genotypes (i.e. comparing wild-type and R6/2 mice). Expression stability is plotted for each of the potential reference genes, progressing from the least stable genes with a higher M value to the most stable genes with a lower M value. (C) In order to measure expression levels accurately, normalization by multiple housekeeping genes is optimal. The graph illustrates the levels of variation in average reference gene stability with the sequential addition of each ref-erence gene to the equation, starting with the three most stably expressed genes on the left with the inclusion of a 4th gene and so on, moving to the right. This measure is known as pairwise variation (V), the values of which are indicated above each bar, with a score of <0.15 as a target.
Table 2: Control genes ranked in order of their expression stability.
Striatum Cerebellum Cortex
UbC Canx Atp5b
Eif4a2 Atp5b Rpl13a
Atp5b Eif4a2 Canx
Yhwaz 18S UbC
Actb Rpl13a 18S
Gapdh Cyc1 Eif4a2
Sdha UbC Yhwaz
Cyc1 Sdha Cyc1
Rpl13a Actb Sdha
18S B2M Gapdh
B2M Gapdh B2M
Canx Yhwaz Actb
Housekeeping genes are ranked in order of their expression stability, and therefore their suitability for use as a reference for the striatum, cerebellum and cortex. The most suitable genes are listed first.
Comparison of normalisation strategy
Figure 3
Molecular Neurodegeneration 2008, 3:17 http://www.molecularneurodegeneration.com/content/3/1/17
Page 10 of 17 (page number not for citation purposes) further decreased the p-value and therefore increased the
sensitivity and reliability of detecting the difference in
Bdnf expression compared to using a single reference gene (p = 0.0006) (Figure 3). Therefore, using the geometric mean of three reference genes markedly improves our ability to detect subtle effects on Bdnf expression by an experimental modulation.
BDNF expression analyses
Brain-derived neurotrophic factor (BDNF) is an impor-tant neurotrophic factor involved in regulating neuronal transmission, striatal neuronal survival, and has previ-ously been implicated in HD pathogenesis [37,38]. BDNF mRNA and protein levels are severely decreased in the cor-tices of numerous HD murine models, including R6/2 mice, and in human HD patients. Assaying BDNF levels therefore holds promise as a useful pre-clinical trial biomarker. Rodent Bdnf gene structure and regulation is complicated, with six upstream transcription start sites spliced (either bipartite or tripartite) to a major coding exon [39]. We therefore established Taqman assays utilis-ing a common reverse primer and probe in the codutilis-ing exon in order to determine the extent of exon-specific Bdnf
mRNA down-regulation over time in R6/2 mice. We addi-tionally surveyed coding exon-specific Bdnf expression. RNA was extracted from cortices of 4, 8, 12 and 15 week old R6/2 transgenic mice and littermate controls and used to synthesize cDNA as a template for qRT-PCR. The geo-metric mean of Ct data from three housekeeping genes was used to normalise levels of Bdnf transcript using the 2ΔΔCt formula. We observed expression of all Bdnf tran-scripts with the exception of 6a and 6b in R6/2 cortex at all times tested (Figure 4). At 4 weeks of age, there was no difference in Bdnf expression level between R6/2 and con-trols, with the exception of a decrease in promoter IIa-spe-cific transcript in R6/2 mice. However, we saw a significant decline in Bdnf expression levels at sympto-matic time points from promoters I, IIa, IIb, IV, V, and also in the coding exon VIII. We subjected the data to power calculations as previously described [40] (Figure 5), which can be used in several ways: (1) to determine how many animals would be required to have a reasona-ble (e.g. > 80%, Figure 5B–E and data not shown) chance of detecting an improvement of a given magnitude at a given P value (p < 0.05); (2) to determine the size of an effect one could expect to detect using a given number of animals; (3) to assess the probability of detecting an effect of given magnitude using a given number of animals. Power calculations suggested that transcript-specific anal-yses from Bdnf promoters could be informative when determining the effect of a pre-clinical modulation. For example, 10 samples would be sufficient to observe a 23% and 30% improvement in Bdnf promoter V expression at 12 and 15 weeks of age respectively with 80% power at p < 0.05 (Figure 5D). However, we obtained less powered to
detect improvements in transcription from Bdnf promot-ers I, IIa and VIII in this dataset with statistical confidence (Figures 5B, C and 5E respectively). In order to illustrate this, the dotted lines plotted on Figure 5B–E show the number of mice required to detect 30% improvement in Bdnf transcript expression. We would need 14 mice for
Bdnf promoter IIa at 15 weeks, 36 mice at 8 weeks, but over 50 mice at 12 weeks; 14 mice for Bdnf promoter IIb at 15 weeks but over 50 mice at 12 weeks; 11 mice for Bdnf
promoter V at 15 weeks but 8 mice at 12 weeks and 34 mice at 8 weeks; 9 mice for Bdnf promoter VIII at 12 weeks but over 50 mice at 15 weeks. Therefore, the age at which the levels of a particular transcript are analysed could be important and needs to be surveyed. Obviously, the larger the change in R6/2 Bdnf transcript levels with respect to wild type, the smaller the number of samples required to obtain statistical significance.
Discussion
Recent advances in gene quantification strategies enable the rapid and precise quantification of RNA transcripts. Normalisation is required to remove sampling differences (such as RNA quantity and quality) in order to identify real gene-specific variation. Accurate normalisation of gene expression levels is therefore a prerequisite, espe-cially when studying the biological significance of subtle gene expression differences. The majority of laboratories use a single control gene for normalisation purposes in RT-PCR (both "classical" and real-time RT-PCR), with
Actb, Gapdh and ribosomal RNA being used in over 90% of cases [41]. However, housekeeping gene expression can vary considerably, with obvious impact on meaningful data interpretation. For example, it has been reported that
B2m (beta-2-microglobulin, a commonly used reference gene) is variably expressed in neuroblastoma cells, depending on the differentiation state of the tumour cells [42], warranting the validation of a reference gene in each experimental system. Additionally, a study showed that a set of genes, including Actb varied in expression by 7 to 23-fold across a panel of 60 cell lines [43,44]. In this regard, identifying suitable control genes for normalisa-tion is even more important when working with complex tissues such as brain regions, or with tissues of different histological origins. Consistent with previously published data [22], we found that a commonly used reference gene,
Actb is specifically dysregulated at later time-points in R6/ 2 mouse brain regions. Therefore, the use of Actb as an appropriate single control normalisation factor is inap-propriate, particularly at later time points. This is trou-bling, as Actb appears to be one of the most commonly used normalisation genes in expression analyses in HD.
Molecular Neurodegeneration 2008, 3:17 http://www.molecularneurodegeneration.com/content/3/1/17
Page 11 of 17 (page number not for citation purposes) Bdnf promoter-specific expression analyses in R6/2 cortex
Figure 4
Bdnf promoter-specific expression analyses in R6/2 cortex. Relative expression ratios to the geometric mean of three housekeeping genes for Bdnf promoter-specific transcripts in R6/2 (filled bars) and littermate wild-type controls (open bars). Data from 4, 8, 12 and 15 weeks (4 w, 8 w, 12 w and 15 w) represents the pathogenic time course from pre-symptomatic stages through to late symptomatic stages for Bdnf promoter-specific transcripts (A) I, (B) IIa, (C) IIb, (D) IIc, (E) III, (F) IV, (G) V and (H) coding exon VIII, according to Liu et al., 2006 [39]. Error bars are S.E.M (n = 8), * p < 0.05, ** p < 0.01, *** p < 0.001.
A
B
C
D
E
F
H
G
***
*
**
***
*
**
**
*
**
***
***
***
*
***
I
IV III
IIc IIa
IIb
V VIII
**
*
**
***
Molecular Neurodegeneration 2008, 3:17 http://www.molecularneurodegeneration.com/content/3/1/17
Page 12 of 17 (page number not for citation purposes) Figure 5 (see legend on next page)
A
B
C
D
E
***
* **
*** *
** **
*
**
*** *** ***
* ***
I IIa
V VIII
** *
Molecular Neurodegeneration 2008, 3:17 http://www.molecularneurodegeneration.com/content/3/1/17
Page 13 of 17 (page number not for citation purposes) disease time-course. However to date, there has been no
systematic study comparing the suitability of different candidate reference genes in HD. We therefore chose to survey a panel of 12 housekeeping genes in an unbiased fashion. We found that the expression levels of candidate reference genes varied according to genotype and brain region, highlighting the necessity of identifying suitable references in the tissue under study. Specifically, the three most stable genes for each brain region tested as identified by geNorm analysis (striatum, cerebellum and cortex) are distinct, with only one gene being common to all three (Atp5b). This is consistent with the notion that there are highly specific transcriptional profiles in distinct brain regions and cell types.
It has been shown that a conventional normalisation strategy based on a single reference gene can lead to erro-neous normalisation up to 6-fold [21]. We therefore pro-pose that a more stringent normalisation strategy should be incorporated, particularly when studying potentially subtle effects upon gene expression levels of a pharmaceu-tical agent or a genetic modulation strategy. It has been demonstrated that calculating the geometric mean of three reference genes yields a reliable normalisation value, which can then be used to determine relative expression ratios for genes of interest [21]. We therefore surveyed the effect of three different normalisation strategies. We found a stable reference gene to use as a single normaliser is superior to a gene whose expression is unstable between the experimental conditions. However, calculating the geometric mean of three stably expressed reference genes and subsequently using this normalisation factor in sub-sequent analyses is preferable. Thus, it is critical not only to identify the most suitable reference genes for expres-sion analyses by an unbiased method in the tissue/cell line of interest, but also to utilise a precise normalising strategy in order to derive meaningful results. This is par-ticularly applicable to studies interrogating the molecular mechanism underlying HD pathogenesis and mecha-nisms by which a particular intervention may exert a ben-eficial effect.
Bdnf gene transcription is induced by wild-type, but not mutant Htt through interactions with NRSF [32]. In addi-tion, Bdnf mRNA and protein levels are severely decreased in the cortices of numerous HD murine models as well as in post-mortem human HD cortex [37]. Interestingly, gene expression profiling of multiple HD mouse models and comparison to human HD brain suggests that Bdnf
depletion plays a major role in striatal degeneration [15]. Remarkably, of all HD mouse models, transcriptional profiles of Bdnf knock-out mice are the most similar to gene expression changes identified in HD human brain, suggesting that decreased Bdnf expression is a key patho-genic feature in HD, possibly through reduced corticostri-atal BDNF transport [33,38]. Furthermore, BDNF levels influence HD onset and progression and up-regulating
Bdnf expression in HD mouse models through exercise, environmental enrichment, treatment with compounds or by adenoviral injection have all shown promise in ameliorating HD-related symptoms [33,34,36,45,46]. Therefore, there is precedence for Bdnf modulation as a therapeutic approach in HD. Taken together, it is critical that we can reliably measure Bdnf levels, either when directly attempting to modulate Bdnf expression; or for use as a biomarker in the context of other disease-modify-ing therapies, particularly those aimed at correctdisease-modify-ing gene expression deficits, such as histone deacetylase inhibitors [22,47-51]. We have therefore developed and validated Taqman-based real-time assays for promoter-specific Bdnf
gene expression in the cortex of R6/2 mice. Indeed, in this context, we have expanded the scope of interrogating Bdnf
expression with respect to HD. Bdnf gene structure and regulation is complex, with upstream transcription start sites spliced to a coding exon, yielding distinct pro-Bdnf
molecules which are cleaved to yield a mature BDNF pro-tein. The complexity of the Bdnf gene facilitates precise regulation of BDNF with respect to the diversity of its functions. Previously reported investigations into Bdnf
gene expression dysregulation were based on the four originally described distinctive promoters in the Bdnf gene [32-38]. However, the previous work on Bdnf's gene struc-ture was incomplete, and it has recently been extended with the identification of six upstream transcription start
Power calculations determine the optimal Bdnf assays for use as preclnical assessment tools
Figure 5 (see previous page)
Molecular Neurodegeneration 2008, 3:17 http://www.molecularneurodegeneration.com/content/3/1/17
Page 14 of 17 (page number not for citation purposes) sites spliced (either bipartite or tripartite) to a major
cod-ing exon [39] (see Additional File 5). We have capitalised on the more detailed knowledge of Bdnf gene structure by designing promoter-specific Taqman assays. We have therefore not only confirmed previously published pro-moter-specific dysregulation in the R6/2 mouse model of HD, but expanded this knowledge. Of particular interest, we have designed specific assays from each of the variants arising from alternative splicing events through the intra-exonic splice sites in promoter II, which has previously been shown to be down-regulated in the R6/2 striatum. Specifically, we have shown that while all three splice var-iants from Bdnf promoter II are dysregulated, Bdnf tran-script IIa is progressively dysregulated to a further extent and is more statistically significant. Furthermore, power calculations suggest that we can effectively use Bdnf
expression analyses as an output measure in a pre-clinical trial. Finally, recently published data has suggested that Bdnf expression dysregulation occurs in a cell-autono-mous property in HD [52]. Consistent with this, it appears that gene expression dysregulation may be an intrinsic function of mutant Htt protein, although the precise molecular mechanism remains to be determined [53,54].
Conclusion
Transcriptional dysregulation is a central pathogenic molecular mechanism in HD, with robust, reproducible and early changes in the expression of specific mRNA moieties. Therefore, analysis of gene expression could be valuable as a biomarker to monitor disease progression and the efficacy of therapeutic agents in clinical trials. However, commonly used reference genes and current methods in the HD field are unsuitable for gene expres-sion analysis. We suggest an improvement on previous methods by demonstrating the identification of suitable and reliable reference genes for dissected brain regions of R6/2 mice, which can be applied to other brain regions, tissues or cell lines. In addition, we illustrate a more robust method for analysis, namely using the geometric mean of three reference genes for relative quantification analyses. These improvements are not novel in that they have been previously described and extensively used in other disease fields. However, they are not routinely used within the HD field. We therefore propose that the meth-ods outlined in this study can be applied in different tis-sues (including biopsies) and cell lines in order to reliably and accurately determine the relative expression level of target genes in these brain regions, thus increasing the potential of gene expression analysis as a biomarker in HD.
Methods
Detailed methods and statistical analyses are available as a supplementary section (see Additional File 6).
List of Abbreviations Used
BDNF: brain derived neurotrophic factor; Ct: crossing threshold; HD: Huntington's disease; PCR: polymerase chain reaction; polyQ: polyglutamine; qRT-PCR: quanti-tative real-time PCR; qPCR: quantiquanti-tative PCR; RT-PCR: reverse transcriptase-PCR
Competing interests
The R6/2 mice are licensed by King's College London for commercial use.
Authors' contributions
CLB initiated this study and participated in its design, including performing the geNorm analyses, optimising the real-time protocol and analyses and drafting the man-uscript. HF performed assays and power calculations; GPB participated in the design of this study, provided funding and guidance and helped to draft the manuscript. All authors have read and approved the final manuscript.
Additional material
Additional file 1
Gene expression analyses work flow. Flow diagram to illustrate the work flow involved in gene expression analysis, from data generation (including sample preparation and experimental process) through to data analysis.
Click here for file
Molecular Neurodegeneration 2008, 3:17 http://www.molecularneurodegeneration.com/content/3/1/17
Page 15 of 17 (page number not for citation purposes)
Acknowledgements
Funding was provided by the Wellcome Trust (66270) and the CHDI Foun-dation. The authors would like to thank Ben Woodman for management of the mouse colony, Jude Nixon for help with statistical analysis, Dr Rachel Butler, Dr Kirupa Sathasivam and Dr Ghazaleh Sadri-Vakili for critical read-ing of the manuscript and helpful discussions.
References
1. Huntington's Disease Collaborative Research Group: A novel gene containing a trinucleotide repeat that is expanded and unsta-ble on Huntington's disease chromosomes. Cell 1993,
72:971-983.
Additional file 2
Example worksheet illustrating 2-ΔΔCt analysis process. Shown is an
Excel worksheet illustrating the process of relative expression analysis. In the worksheet are numbers in blue which illustrate each step. (A) Crossing threshold data can be imported into Excel from real-time PCR platforms (shown are the Bdnf data only for simplicity). (B) Each sample has been run in triplicate and the means of each sample is calculated. Standard deviations should be checked at this point and should be within 1 Ct. C) The raw crossing threshold (Ct) data can be used to plot a graph of the means for each genotype. Shown are means (Avg), standard deviations (SD) and standard error of the mean (SEM) for WT (wild-type) and TG (R6/2) mice (n = 7/genotype). The means are used to generate the graphs, and error bars are SEM. (D) The geometric mean (Geo, or GEOMEAN) is calculated using the raw Ct data for all three reference genes (Atp5b,
Canx, Rpl13a) for each sample. (E) The geometric mean is transformed into a ΔCt value, thus expressing each sample with respect to the least expressed sample. To do this, the Ct of the least expressed sample is sub-tracted from the current sample Ct, giving a negative value for each sam-ple. The least expressed sample will have a value of zero. (F) The ΔCt is calculated for the Bdnf data. (G) The ΔΔCt is calculated, by performing the function (Ct sample - Ct reference), which will give both positive and negative values. (H) To transform the ΔΔCt values into positive integers that represent the expression levels, use the Excel POWER function, enter-ing 2 as the number and -ΔΔCt as the power. The negative sign is neces-sary in this context. (J) The relative expression levels for each sample can then be used to calculate the means (Avg), standard deviation (SD) and standard error of the mean (SEM) for each genotype. These data are used to generate graphs showing expression ratios for target genes. (K) In addi-tion, the expression ratios can be used as a substrate for statistical analyses such as a Student's t-test.
Click here for file
[http://www.biomedcentral.com/content/supplementary/1750-1326-3-17-S2.ppt]
Additional file 3
GeNorm analyses to identify optimal reference genes in the cerebel-lum. (A) Raw crossing threshold (Ct) data for a panel of 12 potential ref-erences from the geNorm kit in wild-type (open bars) and R6/2 (filled bars) mice. Reference genes tested were 18S (18S ribosomal RNA subu-nit), Actb (beta-actin), Atp5b (ATP synthase subunit 5b), B2m (beta-2 microglobulin), Canx (calnexin), Cyc1 (cyclin D1), Eif4a2 (eukaryotic initiation factor 4a2), Gapdh (glyceraldehyde-3-phosphate dehydroge-nase), Rpl13a (ribosomal protein L13a), Sdha (succinate dehydrogenase complex, subunit A), Ubc (ubiquitin C) and Yhwaz (phospholipaase A2). (B) Raw Ct data was subjected to analysis with the geNorm applet which automatically calculates the gene-stability measure M, which is an average pairwise variation of a particular gene with all other control genes. Therefore, genes with the lowest M value have the most stable expression, in this case across genotypes (ie comparing wild-type and R6/ 2 mice). Expression stability is plotted for each of the potential reference genes, progressing from the least stable genes with a higher M value to the most stable genes with a lower M value. (C) In order to measure expres-sion levels accurately, normalization by multiple housekeeping genes is optimal. The graph illustrates the levels of variation in average reference gene stability with the sequential addition of each reference gene to the equation, starting with the most stably expressed genes on the left with the inclusion of a 4th gene etc, moving to the right. This measure is known as
pairwise variation (V), the values of which are indicated above each bar. A V score of below 0.15 is the target.
Click here for file
[http://www.biomedcentral.com/content/supplementary/1750-1326-3-17-S3.ppt]
Additional file 4
GeNorm analyses to identify optimal reference genes in the cortex. (A) Raw crossing threshold data (Ct) for a panel of 12 potential references from the geNorm kit in wild-type (open bars) and R6/2 (filled bars) mice. Reference genes tested were 18S (18S ribosomal RNA subunit), Actb
(beta-actin), Atp5b (ATP synthase subunit 5b), B2m (beta-2 microglob-ulin), Canx (calnexin), Cyc1 (cyclin D1), Eif4a2 (eukaryotic initiation factor 4a2), Gapdh (glyceraldehyde-3-phosphate dehydrogenase),
Rpl13a (ribosomal protein L13a), Sdha (succinate dehydrogenase com-plex, subunit A), Ubc (ubiquitin C) and Yhwaz (phospholipaase A2). (B) Raw Ct data was subjected to analysis with the geNorm applet which automatically calculates the gene-stability measure M, which is an aver-age pairwise variation of a particular gene with all other control genes. Therefore, genes with the lowest M value have the most stable expression, in this case across genotypes (ie comparing wild-type and R6/2 mice). Expression stability is plotted for each of the potential reference genes, pro-gressing from the least stable genes with a higher M value to the most sta-ble genes with a lower M value. (C) In order to measure expression levels accurately, normalization by multiple housekeeping genes is optimal. The graph illustrates the levels of variation in average reference gene stability with the sequential addition of each reference gene to the equation, start-ing with the most stably expressed genes on the left with the inclusion of a 4th gene etc, moving to the right. This measure is known as pairwise
vari-ation (V), the values of which are indicated above each bar. A V score of below 0.15 is the target.
Click here for file
[http://www.biomedcentral.com/content/supplementary/1750-1326-3-17-S4.ppt]
Additional file 5
Bdnf gene structure. This schematic of Mus musculus Bdnf gene struc-ture (top panel, accession number AY057907) indicates the "classical" four promoters (blue boxes) and coding exon (white box) and the recently described additional promoters (yellow boxes) [39]. Only the coding exon is translated, giving rise to a protein of 289 amino acids. The NRSE site and intra-exonic splice sites on promoter II are also indicated. The bottom panel shows the splice variants arising from the Bdnf gene, including the splice variants arising from intra-exonic splice sites A, B and C in pro-moter II.
Click here for file
[http://www.biomedcentral.com/content/supplementary/1750-1326-3-17-S5.ppt]
Additional file 6
Methods. Detailed methods
Click here for file
Molecular Neurodegeneration 2008, 3:17 http://www.molecularneurodegeneration.com/content/3/1/17
Page 16 of 17 (page number not for citation purposes) 2. Bates GP, Harper PS, Jones AL: Huntington's Disease 3rd edition.
Edited by: Bates GP, Harper PS, Jones AL. Oxford: Oxford University Press; 2002.
3. Luthi-Carter R, Strand AD, Hanson SA, et al.: Polyglutamine and transcription: gene expression changes shared by DRPLA and Huntington's disease mouse models reveal context-independent effects. Hum Mol Genet 2002, 11:1927-1937. 4. McMahon SJ, Pray-Grant MG, Schieltz D, Yates JR 3rd, Grant PA:
Pol-yglutamine-expanded spinocerebellar ataxia-7 protein dis-rupts normal SAGA and SLIK histone acetyltransferase activity. Proc Natl Acad Sci USA 2005, 102:8478-8482.
5. Wang L, Rajan H, Pitman JL, McKeown M, Tsai CC: Histone deacetylase-associating Atrophin proteins are nuclear receptor corepressors. Genes Dev 2006, 20:525-530.
6. Evert BO, Araujo J, Vieira-Saecker AM, et al.: Ataxin-3 represses transcription via chromatin binding, interaction with histone deacetylase 3, and histone deacetylation. J Neurosci 2006,
26:11474-11486.
7. Helmlinger D, Hardy S, Abou-Sleymane G, et al.: Glutamine-expanded ataxin-7 alters TFTC/STAGA recruitment and chromatin structure leading to photoreceptor dysfunction.
PLoS Biol 2006, 4:e67.
8. Helmlinger D, Hardy S, Eberlin A, Devys D, Tora L: Both normal and polyglutamine-expanded ataxin-7 are components of TFTC-type GCN5 histone acetyltransferase-containing complexes. Biochem Soc Symp 2006:155-163.
9. Goold R, Hubank M, Hunt A, et al.: Down-regulation of the dopamine receptor D2 in mice lacking ataxin 1. Hum Mol Genet 2007, 16:2122-2134.
10. Haecker A, Qi D, Lilja T, et al.: Drosophila brakeless interacts with atrophin and is required for tailless-mediated transcrip-tional repression in early embryos. PLoS Biol 2007, 5:e145. 11. Luthi-Carter R, Cha JH: Mechanisms of transcriptional
dysregu-lation in Huntington's disease. Clin Neurosci. Res 2003, 3:165-177. 12. Cha JH: Transcriptional signatures in Huntington's disease.
Prog Neurobiol 2007, 83:228-248.
13. Luthi-Carter R, Strand A, Peters NL, et al.: Decreased expression of striatal signaling genes in a mouse model of Huntington's disease. Hum Mol Genet 2000, 9:1259-1271.
14. Hodges A, Strand AD, Aragaki AK, et al.: Regional and cellular gene expression changes in human Huntington's disease brain. Hum Mol Genet 2006, 15:965-977.
15. Kuhn A, Goldstein DR, Hodges A, et al.: Mutant huntingtin's effects on striatal gene expression in mice recapitulate changes observed in human Huntington's disease brain and do not differ with mutant huntingtin length or wild-type huntingtin dosage. Hum Mol Genet 2007, 16:1845-1861. 16. Strand AD, Aragaki AK, Shaw D, et al.: Gene expression in
Hunt-ington's disease skeletal muscle: a potential biomarker. Hum Mol Genet 2005, 14:1863-1876.
17. Borovecki F, Lovrecic L, Zhou J, et al.: Genome-wide expression profiling of human blood reveals biomarkers for Hunting-ton's disease. Proc Natl Acad Sci USA 2005, 102:11023-11028. 18. Runne H, Kuhn A, Wild EJ, et al.: Analysis of potential
transcrip-tomic biomarkers for Huntington's disease in peripheral blood. Proc Natl Acad Sci USA 2007, 104:14424-14429.
19. Livak KJ, Schmittgen TD: Analysis of relative gene expression data using real-time quantitative PCR and the 2(-Delta Delta C(T)) Method. Methods 2001, 25:402-408.
20. Pfaffl MW: Quantification strategies in real-time PCR. In A-Z of quantitative PCR Edited by: Bustin SA. La Jolla: International University Line; 2001.
21. Vandesompele J, De Preter K, Pattyn F, et al.: Accurate normaliza-tion of real-time quantitative RT-PCR data by geometric averaging of multiple internal control genes. Genome Biol 2002,
3:RESEARCH0034.
22. Sadri-Vakili G, Bouzou B, Benn CL, et al.: Histones associated with downregulated genes are hypo-acetylated in Huntington's disease models. Hum Mol Genet 2007, 16:1293-1306.
23. Mangiarini L, Sathasivam K, Seller M, et al.: Exon 1 of the HD gene with an expanded CAG repeat is sufficient to cause a pro-gressive neurological phenotype in transgenic mice. Cell 1996, 87:493-506.
24. Woodman B, Butler R, Landles C, et al.: The Hdh(Q150/Q150) knock-in mouse model of HD and the R6/2 exon 1 model
develop comparable and widespread molecular phenotypes.
Brain Res Bull 2007, 72:83-97.
25. Nolan T, Hands RE, Bustin SA: Quantification of mRNA using real-time RT-PCR. Nat Protoc 2006, 1:1559-1582.
26. Weiss A, Klein C, Woodman B, et al.: Sensitive biochemical aggregate detection reveals aggregation onset before symp-tom development in cellular and murine models of Hunting-ton's disease. J Neurochem 2008, 104:846-858.
27. Nadler JJ, Zou F, Huang H, et al.: Large-scale gene expression dif-ferences across brain regions and inbred strains correlate with a behavioral phenotype. Genetics 2006, 174:1229-1236. 28. Schulz DJ, Goaillard JM, Marder EE: Quantitative expression
pro-filing of identified neurons reveals cell-specific constraints on highly variable levels of gene expression. Proc Natl Acad Sci USA 2007, 104:13187-13191.
29. Stansberg C, Vik-Mo AO, Holdhus R, et al.: Gene expression pro-files in rat brain disclose CNS signature genes and regional patterns of functional specialisation. BMC Genomics 2007, 8:94. 30. Strand AD, Aragaki AK, Baquet ZC, et al.: Conservation of regional gene expression in mouse and human brain. PLoS Genet 2007, 3:e59.
31. Cahoy JD, Emery B, Kaushal A, et al.: A transcriptome database for astrocytes, neurons, and oligodendrocytes: a new resource for understanding brain development and function.
J Neurosci 2008, 28:264-278.
32. Zuccato C, Ciammola A, Rigamonti D, et al.: Loss of huntingtin-mediated BDNF gene transcription in Huntington's disease.
Science 2001, 293:493-498.
33. Canals JM, Pineda JR, Torres-Peraza JF, et al.: Brain-derived neuro-trophic factor regulates the onset and severity of motor dys-function associated with enkephalinergic neuronal degeneration in Huntington's disease. J Neurosci 2004,
24:7727-7739.
34. Zuccato C, Liber D, Ramos C, et al.: Progressive loss of BDNF in a mouse model of Huntington's disease and rescue by BDNF delivery. Pharmacol Res 2005, 52:133-139.
35. Zuccato C, Marullo M, Conforti P, Macdonald ME, Tartari M, Cat-taneo E: Systematic Assessment of BDNF and Its Receptor Levels in Human Cortices Affected by Huntington's Disease.
Brain Pathol 2008, 18:225-238.
36. Gharami K, Xie Y, An JJ, Tonegawa S, Xu B: Brain-derived neuro-trophic factor over-expression in the forebrain ameliorates Huntington's disease phenotypes in mice. J Neurochem 2008,
105:369-379.
37. Zuccato C, Cattaneo E: Role of brain-derived neurotrophic fac-tor in Huntington's disease. Prog Neurobiol 2007, 81:294-330. 38. Strand AD, Baquet ZC, Aragaki AK, et al.: Expression profiling of
Huntington's disease models suggests that brain-derived neurotrophic factor depletion plays a major role in striatal degeneration. J Neurosci 2007, 27:11758-11768.
39. Liu QR, Lu L, Zhu XG, Gong JP, Shaham Y, Uhl GR: Rodent BDNF genes, novel promoters, novel splice variants, and regulation by cocaine. Brain Res 2006, 1067:1-12.
40. Hockly E, Woodman B, Mahal A, Lewis CM, Bates GP: Standardiza-tion and statistical approaches to therapeutic trials in the R6/ 2 mouse. Brain Res Bull 2003, 61(5):469-479.
41. Suzuki T, Higgins PJ, Crawford DR: Control selection for RNA quantitation. Biotechniques 2000, 29:332-337.
42. Cooper MJ, Hutchins GM, Mennie RJ, Israel MA: Beta 2-microglob-ulin expression in human embryonal neuroblastoma reflects its developmental regulation. Cancer Res 1990, 50:3694-3700. 43. Ross DT, Scherf U, Eisen MB, et al.: Systematic variation in gene
expression patterns in human cancer cell lines. Nat Genet 2000, 24:227-235.
44. Warrington JA, Nair A, Mahadevappa M, Tsyganskaya M: Compari-son of human adult and fetal expression and identification of 535 housekeeping/maintenance genes. Physiol Genomics 2000,
2:143-147.
45. Bemelmans AP, Horellou P, Pradier L, Brunet I, Colin P, Mallet J:
Brain-derived neurotrophic factor-mediated protection of striatal neurons in an excitotoxic rat model of Huntington's disease, as demonstrated by adenoviral gene transfer. Hum Gene Ther 1999, 10:2987-2997.
Hunting-Publish with BioMed Central and every scientist can read your work free of charge
"BioMed Central will be the most significant development for disseminating the results of biomedical researc h in our lifetime."
Sir Paul Nurse, Cancer Research UK
Your research papers will be:
available free of charge to the entire biomedical community
peer reviewed and published immediately upon acceptance
cited in PubMed and archived on PubMed Central
yours — you keep the copyright
Submit your manuscript here:
http://www.biomedcentral.com/info/publishing_adv.asp
BioMedcentral Molecular Neurodegeneration 2008, 3:17 http://www.molecularneurodegeneration.com/content/3/1/17
Page 17 of 17 (page number not for citation purposes)
ton's disease, indicating a possible disease mechanism. J Neurosci 2004, 24:2270-2276.
47. Steffan JS, Bodai L, Pallos J, et al.: Histone deacetylase inhibitors arrest polyglutamine-dependent neurodegeneration in Dro-sophila. Nature 2001, 413:739-743.
48. Hockly E, Richon VM, Woodman B, et al.: Suberoylanilide hydroxamic acid, a histone deacetylase inhibitor, amelio-rates motor deficits in a mouse model of Huntington's dis-ease. Proc Natl Acad Sci USA 2003, 100:2041-2046.
49. Gardian G, Browne SE, Choi DK, et al.: Neuroprotective effects of phenylbutyrate in the N171-82Q transgenic mouse model of Huntington's disease. J Biol Chem 2005, 280:556-563. 50. Butler R, Bates GP: Histone deacetylase inhibitors as
therapeu-tics for polyglutamine disorders. Nat Rev Neurosci 2006,
7:784-796.
51. Sadri-Vakili G, Cha JH: Histone deacetylase inhibitors: a novel therapeutic approach to Huntington's disease (complex mechanism of neuronal death). Curr Alzheimer Res 2006,
3:403-408.
52. Brown TB, Bogush AI, Ehrlich ME: Neocortical expression of mutant huntingtin is not required for alterations in striatal gene expression or motor dysfunction in a transgenic mouse.
Hum Mol Gen in press. 2008, Jul 16.
53. Runne H, Régulier E, Kuhn A, et al.: Dysregulation of gene expres-sion in primary neuron models of Huntington's disease shows that polyglutamine-related effects on the striatal tran-scriptome may not be dependent on brain circuitry. J Neurosci 2008, 28(39):9723-9731.