The Cryosphere, 7, 889–904, 2013 www.the-cryosphere.net/7/889/2013/ doi:10.5194/tc-7-889-2013
© Author(s) 2013. CC Attribution 3.0 License.
Natural Hazards
and Earth System
Sciences
Atmospheric
Chemistry
and Physics
Open AccessAtmospheric
Chemistry
and Physics
Open Access DiscussionsAtmospheric
Measurement
Techniques
Open AccessAtmospheric
Measurement
Techniques
Open Access DiscussionsBiogeosciences
Open Access Open Access
Biogeosciences
DiscussionsClimate
of the Past
Open Access Open Access
Climate
of the Past
Discussions
Earth System
Dynamics
Open Access Open Access
Earth System
Dynamics
DiscussionsGeoscientific
Instrumentation
Methods and
Data Systems
Open Access
Geoscientific
Instrumentation
Methods and
Data Systems
Open Access DiscussionsGeoscientific
Model Development
Open Access Open Access
Geoscientific
Model Development
DiscussionsHydrology and
Earth System
Sciences
Open AccessHydrology and
Earth System
Sciences
Open Access DiscussionsOcean Science
Open Access Open Access
Ocean Science
DiscussionsSolid Earth
Open Access Open Access
Solid Earth
Discussions
The Cryosphere
Open Access Open Access
The Cryosphere
DiscussionsNatural Hazards
and Earth System
Sciences
Discussions
Quantifying present and future glacier melt-water contribution to
runoff in a central Himalayan river basin
M. Prasch1, W. Mauser1, and M. Weber2
1Department of Geography, LMU Munich, Germany
2Commission for Geodesy and Glaciology, Bavarian Academy of Sciences and Humanities, Munich, Germany
Correspondence to: M. Prasch ([email protected])
Received: 23 September 2012 – Published in The Cryosphere Discuss.: 29 October 2012 Revised: 22 March 2013 – Accepted: 3 May 2013 – Published: 28 May 2013
Abstract. Water supply of most lowland cultures heavily de-pends on rain and melt water from the upstream mountains. Especially melt-water release of alpine mountain ranges is usually attributed a pivotal role for the water supply of large downstream regions. Water scarcity is assumed as conse-quence of glacier shrinkage and possible disappearance due to global climate change (GCC), in particular for large parts of Central and Southeast Asia. In this paper, the applica-tion and validaapplica-tion of a coupled modeling approach with re-gional climate model (RCM) outputs and a process-oriented glacier and hydrological model is presented for the central Himalayan Lhasa River basin despite scarce data availability. Current and possible future contributions of ice melt to runoff along the river network are spatially explicitly shown. Its role among the other water balance components is presented. Al-though glaciers have retreated and will continue to retreat according to the chosen climate scenarios, water availability is and will be primarily determined by monsoon precipita-tion and snowmelt. Ice melt from glaciers is and will be a minor runoff component in summer monsoon-dominated Hi-malayan river basins.
1 Introduction
Water supply of most lowland cultures heavily depends on rain and melt water from the upstream mountains, because mountain watersheds can store considerable amounts of pre-cipitation as snowpack and glaciers (Viviroli et al., 2007). Its delayed release through snowmelt and glacier-ice melt can augment river runoff during dry periods (Jansson et al., 2003, Viviroli et al., 2007, Weber et al., 2010) with ice melt
of-ten being the last water source after the melt-out of snow. Especially melt-water release of glaciers in the Alps, the Himalaya and other alpine mountain ranges, is usually at-tributed a pivotal role for the water supply of large down-stream regions (Baraer et al., 2012; Barnett et al., 2005; Bookhagen and Burbank, 2010; Collins and Tayler, 1990; Cruz et al., 2007; Huss et al., 2008; Huss, 2011; Moore et al., 2009; Pellicciotti et al., 2012). But snowpack and glaciers are among the land surface compartments most susceptible to global climate change (GCC). Glacier retreat has attracted wide public interest and serves as symbol for the impact of GCC. As consequence of glacier shrinkage and possible dis-appearance water scarcity is assumed (Cruz et al., 2007) due to GCC, in particular for large parts of Central and Southeast Asia (Barnett et al., 2005; Casassa et al., 2009; Cruz et al., 2007; Singh et al., 2006; Xu et al., 2009). Especially in High Asia this was brought into focus by the IPCC (Intergovern-mental Panel on Climate Change) statement on Himalayan glacier retreat and its assumed consequences for water avail-ability (Cruz et al., 2007). Despite recent studies pointing to the differing influences of ice-melt water on runoff due to re-gionally varying climatic and hydrological conditions along the Hindu Kush–Himalayas (Bolch et al., 2012; Immerzeel et al., 2010, 2012; Kaser et al., 2010; K¨a¨ab et al., 2012; Pellic-ciotti et al., 2012; Rees and Collins, 2006; Thayyen and Ger-gan, 2010), the future rate of recession of Himalayan glaciers as well as their present and future role for the downstream re-gions remain controversial.
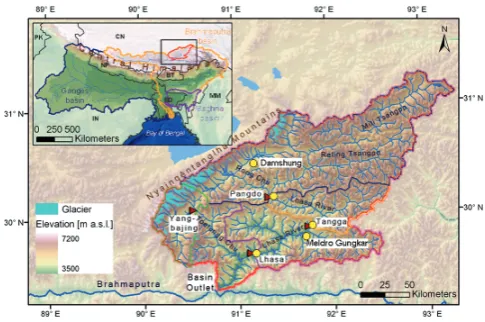
Fig. 1. Location of the Lhasa River basin in the central Himalaya and basin characteristics. The runoff gauges and the sub-basins an-alyzed in detail are marked with red triangles, the meteorological stations are marked with yellow circles and both are labeled (see also Supplement Table S1).
Immerzeel et al., 2010) or at small scales (Immerzeel et al., 2012). Some results are limited to present climatic conditions (Bookhagen and Burbank, 2010; Kaser et al., 2010; Pellic-ciotti et al., 2012; Thayyen and Gergan, 2010). This is also the case for the important analysis of changes in runoff in re-lation to glacier volume and area changes (e.g., Collins and Taylor, 1990; Huss et al., 2008; Jansson et al., 2003; and Moore et al., 2009) or future impacts are estimated in us-ing a hypothetical development of climate and glaciers (e.g., Baraer et al., 2012) and no future climate model outputs. Dif-ferent approaches, e.g., using the glacier mass balance to cal-culate glacier melt water release (e.g., Huss et al., 2008), of-ten do not have a high temporal resolution and do not con-sider melt water release in the case of a balanced mass bal-ance. Although the negative mass balance in the ablation area is balanced by the positive mass balance in the accumula-tion area, melt water is released in the lower parts. Detailed studies of the ice-melt contribution to runoff in relation to snowmelt and the other water balance components and of their changing composition due to GCC are needed to assess the current and future role of glaciers for downstream wa-ter management (e.g., Collins and Taylor, 1990; Huss et al., 2008; Kaltenborn et al., 2010; Jansson et al., 2003; Moore et al., 2009; Viviroli et al., 2011). They are, so far, rare in monitored regions like the Alps (Weber et al., 2010) and not available in remote regions as the Himalayas. Since there is no feasible method to distinguish river water according to its generation at the scale of large watersheds and because GCC deals with the future, model studies, properly validated with recorded data, are currently the only feasible approach to quantify the contributions of rainfall, snow- and ice melt to river runoff.
We present a model-based analysis of the temporal dynam-ics and spatial pattern of the rainfall, snow- and ice-melt
con-tribution to river runoff under past and future climatic condi-tions for the Lhasa River basin (LRB) in the central Himalaya (Fig. 1, Sect. 2). To account for the specific and unique role of the glaciers for the downstream regions, we wanted to quantify the contribution of glacier ice-melt water to river runoff not only for the highly glacierized head watersheds but also for the downstream regions where people usually live and use the water. The results presented here are based on the approach developed in the integrative research projects GLOWA-Danube (GLObal change of the WAter cycle; www. glowa-danube.de) and BRAHMATWINN (Fl¨ugel, 2011) to study the impacts of climate change on water availability. The full model chain with PROMET (Processes of Radia-tion, Mass and Energy Transfer), SCALMET and SURGES (SUbscale Regional Glacier Extension Simulation) was al-ready applied in the Upper Danube River basin with excellent data availability and validated in detail (Marke et al., 2011a, b; Mauser and Bach, 2009; Weber et al., 2010). General hy-drological results were presented in Prasch et al. (2011a) for the Upper Brahmaputra River basin. Here, the application and validation of the coupled modeling approach with re-gional climate model (RCM) outputs and a process-oriented glacier and hydrological model is explained for the central Himalayan LRB despite scarce data availability (Sects. 3, 4). Then, the results are shown in depth: the spatial contribution of ice melt to river runoff along the river network of the LRB (Sect. 5.1), the amount of ice-melt water related to other wa-ter balance components (Sect. 5.2) and the timing of the melt contribution in its seasonal course (Sect. 5.3) for past and future climatic conditions from 1971–2080.
2 Study area
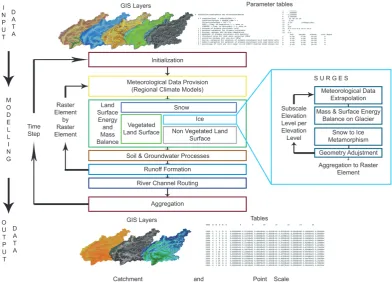
Fig. 2. Modeling approach. Scheme of implementation of the glacier model SURGES into PROMET, describing the spatial and temporal modeling cycle through the model components.
was recorded, similar to most parts of the Tibetan Plateau (Bolch et al., 2010; Li et al., 2011; Yao et al., 2007; Zhou et al., 2010). From 1970 to 2000, about 6 to 10 m w.e. (water equivalent) (Frauenfelder and K¨a¨ab, 2009; K¨a¨ab et al., 2008) melted away on average.
Climatic conditions in the LRB are determined by a strong seasonal course of the precipitation, which falls during the monsoon months in summer (430–520 mm a−1(see also Ta-ble 2), 90 % falling from June to September). Mean annual air temperatures vary between –9◦C in the Nyainqˆentanglha Mountains and +10◦C in the Lhasa River valley near the river’s mouth. Due to the pronounced wet season during the summer monsoon and the dry season lasting the rest of the year, the runoff shows a clear seasonal cycle, with the flood peak reached in August. About 90 % of the mean annual runoff is observed between May and November, whereas in the winter season, runoff is low.
The coincidence of the ablation period and the mon-soon season in summer largely determines the importance of glacier melt for water availability in the LRB similar to large, summer-monsoon dominated areas in the Himalayas, because melt water is of higher importance during dry peri-ods and vice versa. In contrast to man-made reservoirs, snow and ice reservoirs are filled or emptied by natural processes in either a cyclic or anti-cyclic behavior, and therefore cannot be managed for downstream agriculture, hydropower,
indus-try and households. If snow- and ice melt occur during the rainy season (cyclic behavior), they may add a small fraction to the large amount of runoff generated by heavy rainfall. When snow- and ice reservoirs melt during the dry season (anti-cyclic behavior), the generated runoff can be used to compensate potential water shortages.
The basin is only 2 % glacierized as of 1970. Nevertheless it was chosen, because the study wants not only to analyze the contribution of glacier melt water in the highly glacier-ized head watersheds. It also wants to analyze the influence of ice melt in the downstream regions, where usually people live and use water. Despite scarce data availability (Supple-ment Table S1 shows details of the observed meteorological and discharge data at the stations illustrated in Fig. 1) the successful application of a coupled modeling approach with RCM outputs and a process-oriented glacier and hydrologi-cal model can be demonstrated.
3 Methods
3.1 Model description
river basin. In order to quantify the contribution of glacier melt water to river runoff not only for the highly glacierized head watersheds, but also for the downstream regions where people usually live and use the water, the full water balance components of a heterogeneous, large-scale river basin have to be taken into account. Therefore the models consider the water flows in vegetation, soils and river channels and the complete rainfall–runoff, snow and ice dynamics (Eq. 1): Q=R+S−E+1GS +1SS+1IS, (1) whereQis runoff, R is rainfall, S is snowfall, E is evapotran-spiration,1GS is changes in groundwater storage, 1SS is changes in snow storage, and1IS is changes in ice storage. Particularly evapotranspiration and the complex interactions of rainfall and snowmelt forming surface runoff, infiltrating into the soil and groundwater, forming interflow and base flow are important for runoff generation in the large down-stream areas. Together with the melt-water release of the glacier ice the determination of the importance of ice-melt water throughout a mesoscale river basin is enabled. This is the underlying motivation to couple a complex hydrological model with a glacier mass- and energy-balance model. The small-scale processes leading to melt-water release on the heterogeneous surfaces of mountains and glaciers are con-sidered by SURGES using a subscale approach in calculat-ing the surface mass and energy balance of all glaciers in the basin. Accordingly these processes are calculated on a scale, which is finer than the applied process scale of the PROMET watershed model and parameterizes the subscale terrain us-ing an area–elevation ice thickness classification table (see Sect. 3.1.3).
Furthermore, the method should allow determining the rel-evance of ice melt among the other water balance compo-nents. Consequently, we separated ice- and snowmelt in the entire basin. The term “snowmelt” is seen in a purely physi-cal sense as “snow that melts at the surface of a snow cover” be it on the glacier or not. Therefore it consists of both, snowmelt from non-glacierized and glacierized parts of the basin. On each location on a glacier, ice melt can only set in after all snow has melted and the ice is exposed to energy transfer from radiation and/or the atmosphere.
A consistent meteorological data set (near-surface air tem-perature, precipitation, air humidity, wind speed, incoming shortwave and longwave radiation in a temporal resolution of 1 h) is required for each raster element to run the models. Therefore, the scaling tool SCALMET (Marke et al., 2011a, b) is applied to downscale outputs of RCMs during runtime.
3.1.1 The PROMET watershed model
The PROMET model used in this study was developed in order to study the impacts of climate change on the water balance in heterogeneous, large-scale river basins (A∼100 000 km2). PROMET runs with a temporal resolu-tion of 1 h and is a spatially distributed model. It is based
on physical principles and the mass and energy balances are closed. The model is not calibrated to measured runoff and the parameterizations are invariant in space and time across the whole basin. Varying climatic conditions and hydrologi-cal regimes of complex catchments (e.g., mountain head wa-tersheds and large river valleys in the forelands) are modeled synchronously by PROMET (Mauser and Bach, 2009). The model was successfully applied in the complex river basin of the Upper Danube in central Europe (A=77 000 km2) with comparably good data availability under past and future cli-mate conditions. Due to its characteristics PROMET fulfills the requirements for impact studies of climate change on the regional scale (Mauser and Bach, 2009). The local hetero-geneities in the LRB are considered through a model raster with a resolution of 1×1 km.
3.1.2 The scaling tool SCALMET
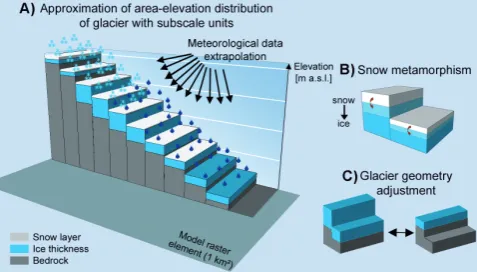
Fig. 3. Approximation of area-elevation distribution of a glacier by SURGES for one raster element (A) and elevation levels of a glacier covering several raster elements (B).
Fig. 4. Scheme of subscale approach of the glacier model SURGES (modified after Prasch et al., 2011a, p. 63).
3.1.3 The SURGES glacier model
Concerning the strong variation with elevation of the pro-cesses, SURGES uses an area–elevation distribution with subscale units (for the LRB elevation levels with intervals of 100 m are applied) (Fig. 3a) to approximate the complex ter-rain of mountain glaciers within all glacierized 1 km2raster elements of the full river basin. If a glacier covers several raster elements (Fig. 3b) the elevation belts of one glacier are spread over several raster elements. Each subscale unit is characterized by a homogenous ice thickness and surface elevation. The subscale approach thus enables the coexis-tence of accumulation zones at the higher altitudes and ab-lation zones at the lower altitudes within one raster element (Fig. 4a). The algorithms of SURGES to calculate accumu-lation and melt rates are designed to use data as measured at a local climate station as input. Hence, the meteorological data for precipitation, air temperature, air humidity, incom-ing shortwave and longwave radiation, air pressure and wind speed, provided by SCALMET, has to be extrapolated to the
elevation levels. Therefore air temperature, air pressure, wet bulb temperature (for differentiation of rain from snowfall by iteratively solving the psychrometer formula) and the wind speed on the glacier for air temperatures above 0◦C (a kata-batic flow over glaciers, which is caused by the differences in the density of air between the snow-free surrounding areas of a glacier and the comparatively cold glacier surface, which is very common over melting surfaces) are extrapolated due to the different elevations at the subscale glacier belts. All the other meteorological variables, e.g., precipitation or in-coming radiation, are assumed to be constant throughout the raster element and are taken from SCALMET without any adaptation. Details of the meteorological data provision are presented in the Supplement.
These processes accelerate snow metamorphism. Thus, af-ter a period of one year, similar to the estimation of Kang et al. (2007), half of the snow layer is transformed to ice in this study. Even though firn is not distinguished specif-ically, changes with respect to the energy balance are taken into account by the simulation of changes in the albedo, vary-ing between 0.5 (snow-free ice) and 0.9 (freshly fallen snow) (further details in the Supplements).
Finally, glacier geometry is adjusted both in the case of melt out or growth of the ice reservoir on different eleva-tion levels in reducing or respectively increasing glacier area (Fig. 4c). In the first case, the ice on an elevation level melts away and then the glacier area is reduced by the area of the el-evation level (Fig. 4c, left to right). In the second case, snow accumulates and ice is build on an ice-free elevation level and then the glacier area is increased by the area of the elevation level (Fig. 4c, right to left). Since snow that accumulates at the higher elevation levels is transformed to ice as explained above and sublimation, evaporation and melt are taken into account, it does not accumulate endlessly, although the loss of ice thickness there is underestimated because of the miss-ing consideration of subsidence caused by ice flow. Released melt water is aggregated for each raster cell and then redi-rected to the stream flow from all cells by PROMET’s rout-ing component as described in Mauser and Bach (2009). Ad-ditionally, the model chain is applied under future climate conditions, which are characterized in this region according to the climate model outputs by increasing temperatures and only slight changes in the amount of precipitation, so that glacier retreat goes along with a reduction of the ice flow. Although an ice flow model is not explicitly implemented, the approximation of glacier geometry changes is considered in a first step. Moreover, the complexity of the relevant pro-cesses requires detailed information about the glacier’s ge-ometry and cannot be simulated in a simple approach on the catchment scale. This is the reason why glacier changes are crudely considered in long-term studies (e.g., Rees and Collins, 2006).
3.1.4 Discussion of the modeling approach
Focusing on the effect of the processes in determining the melt-water release under changing climatic conditions throughout a complex mesoscale river basin in the presented modeling approach results in the neglect of some small-scale processes on the glacier so far. Wind-induced snow transport and the small-scale shading caused by the surrounding moun-tains, which principally facilitate the formation of glaciers in some cases, has so far been neglected. The effect of trans-porting ice from the accumulation to the ablation area due to the ice flow has so far been excluded, but the snow-to-ice metamorphism and glacier geometry changes are con-sidered in a first step as well as sublimation. Accordingly, snow that accumulates at the higher elevation levels is trans-formed to ice and does not accumulate endlessly as explained
in Sect. 3.1.3. Since the model chain is applied under future climate conditions which are characterized in this region ac-cording to the climate model outputs by increasing tempera-tures and only slight changes in the amount of precipitation, glacier mass balances are negative and consequently cause glacier geometry changes, which are considered. This pro-cess is partly compensated by the ice flow of large glaciers, which is so far not explicitly implemented. The enhancement of the model with an ice flow model is intended for future work.
The approach nevertheless enables the distributed simu-lation of the main processes for determination of the melt water release of all glaciers in a mesoscale river basin. The properties of each single glacier are considered in as much detail as possible by the approximation of the ice thick-ness area–elevation distribution. This includes capturing the small-scale glacier properties below the process scale of PROMET of 1×1 km for the simulation of energy and mass balances. Furthermore, the coexistence of rain- and snow-fall, of the accumulation and ablation zones of a glacier and the neighboring non-glacierized areas on one raster element can be handled. Geometry changes in the glacier are consid-ered in reducing the glacier area after the ice melt at given elevation levels, although the implementation of ice flow ef-fects could improve the determination. Moreover, SURGES can be applied under past as well as future climatic condi-tions, since it is process oriented and uses universal constants and universal algorithms, which are invariant in space and time throughout the basin. Through the implementation of SURGES in PROMET, the influence of the melt water re-lease of glaciers for the water balance can be determined in a spatially distributed way over the complete large-scale catchment, considering the full water balance processes. Fi-nally, in applying the SCALMET tool, RCMs can be applied as meteorological input data. They make the application of the modeling approach independent of meteorological sta-tion data. This is especially important in remote mountain regions as is the LRB.
3.2 Input data
Fig. 5. Comparison of modeled (CLM ERA 40 driven SCAL-MET outputs) and observed daily air temperatures for the Lhasa, Damshung and Meldro Gungkar stations.
the CLM data were downscaled to the spatial resolution of 1×1 km through the scaling tool SCALMET (Marke et al., 2011a, b) without adding further bias correction. For all fur-ther model parameters we used open access data like SRTM (Shuttle Radar Topography Mission; Jarvis et al., 2006) and Aster (ERSDAC, 2009) digital elevation models, the NASA Terra/Modis land cover product (Boston University, 2004), the Harmonized World Soil Database (FAO et al., 2009) and the Chinese Glacier Inventory (World Data Center For Glaciology and Geocryology, 2009), which provides mean ice thickness for the glaciers in the LRB. The mean ice thick-ness is then modified considering surface slope (Haeberli and Hoelzle, 1995) and the thinning out of the glacier to its edges and front. Additionally, a digital terrain analysis was carried out with TOPAZ (Topographic Parameterization; Gabrecht and Martz, 1999) and field data were applied. Further details to the applied input data in the models can be found in Ta-ble 1 and in Prasch et al. (2011b).
4 Validation of the modeling approach in the Lhasa River basin
The models PROMET, SURGES and SCALMET have been developed and successfully applied within the integrative research project GLOWA-Danube (www.glowa-danube.de). Additionally, PROMET and SCALMET were applied in the Upper Brahmaputra Basin (Prasch et al., 2011a, b) to study the impacts of climate change on water availability within the framework of the project BRAHMATWINN (Fl¨ugel, 2011). The full model chain was already applied in the Upper Danube River basin and validated in detail (Weber et al., 2010; further details in the Supplement). Therefore, here the validation of the modeling approach in the LRB is shown. This includes validating with SCALMET down-scaled air temperature and precipitation, glacier develop-ment, and runoff in the LRB.
4.1 Validation of air temperature and precipitation in the LRB
To validate the downscaled air temperature and precipita-tion sums in the LRB, the data recorded air temperature
Fig. 6. Comparison of modeled (CLM ERA 40 driven-SCALMET outputs) and observed monthly precipitation for the Lhasa and Tangga (1971–2000), Pangdo (1976–2000) and Damshung and Meldro Gungkar stations (1980–2000).
Fig. 7. Development of observed and modeled (CLM ECHAM 5 driven SCALMET outputs) monthly air temperature and precipita-tion at the Lhasa staprecipita-tion for 1980–2000.
and precipitation data at five meteorological stations (Fig. 1, Table S1) are compared with the downscaled values after SCALMET is run. Both, CLM ERA 40 and CLM ECHAM 5 data are used as input for SCALMET in the validation, be-cause ECHAM 5 driven SCALMET outputs, as driven by a climate model, cannot reproduce the chronology of the meteorological conditions contrary to ERA 40 data, which are based on observations. The SCALMET outputs of CLM ECHAM 5 should, however, reproduce the meteorological conditions and the climate signal. Consequently, the average values, the general seasonal course without matching single years and the trend of the data should be comparable to ob-served data. ERA 40 driven outputs should additionally rep-resent the seasonal course of single years.
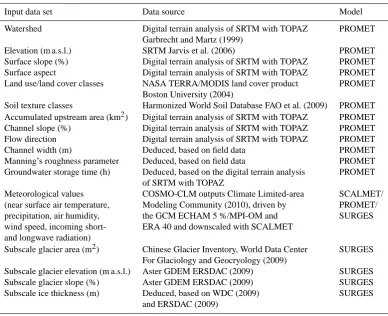
Table 1. Required input data layers to run the models PROMET, SCALMET and SURGES and data sources for the Lhasa River catchment.
Input data set Data source Model
Watershed Digital terrain analysis of SRTM with TOPAZ PROMET
Garbrecht and Martz (1999)
Elevation (m a.s.l.) SRTM Jarvis et al. (2006) PROMET
Surface slope (%) Digital terrain analysis of SRTM with TOPAZ PROMET Surface aspect Digital terrain analysis of SRTM with TOPAZ PROMET Land use/land cover classes NASA TERRA/MODIS land cover product PROMET
Boston University (2004)
Soil texture classes Harmonized World Soil Database FAO et al. (2009) PROMET Accumulated upstream area (km2) Digital terrain analysis of SRTM with TOPAZ PROMET Channel slope (%) Digital terrain analysis of SRTM with TOPAZ PROMET Flow direction Digital terrain analysis of SRTM with TOPAZ PROMET
Channel width (m) Deduced, based on field data PROMET
Manning’s roughness parameter Deduced, based on field data PROMET Groundwater storage time (h) Deduced, based on the digital terrain analysis PROMET
of SRTM with TOPAZ
Meteorological values COSMO-CLM outputs Climate Limited-area SCALMET/ (near surface air temperature, Modeling Community (2010), driven by PROMET/ precipitation, air humidity, the GCM ECHAM 5 %/MPI-OM and SURGES wind speed, incoming short- ERA 40 and downscaled with SCALMET
and longwave radiation)
Subscale glacier area (m2) Chinese Glacier Inventory, World Data Center SURGES For Glaciology and Geocryology (2009)
Subscale glacier elevation (m a.s.l.) Aster GDEM ERSDAC (2009) SURGES
Subscale glacier slope (%) Aster GDEM ERSDAC (2009) SURGES
Subscale ice thickness (m) Deduced, based on WDC (2009) SURGES and ERSDAC (2009)
Table 2. Validation of simulated CLM ERA 40 and CLM ECHAM 5 and observed mean values of air temperature and precipitation in the LRB.
Station and time period
Air temperature (◦C) Precipitation sum (mm)
Obser-
Down-1
Down-1
Obser-
Down-1
Down-1 vation
scaled scaled
vation
scaled scaled
CLM CLM CLM CLM
data data data data
(driven (driven (driven (driven
by ERA 40) by ECHAM 5) by ERA 40) by ECHAM 5)
Lhasa 8.1 7.2 −0.9 7.9 −0.2 426 584 158 524 97
(1980–2000)
Meldro Gungkar 6.0 5.3 −0.7 6.0 0.0 548 532 −16 481 −67
(1980–2000)
Damshung 1.8 1.7 −0.1 2.4 0.6 464 543 80 511 48
(1980–2000)
Pangdo no data 538 647 91 587 41
(1976–2000)
Tangga no data 517 561 44 513 −4
(1971–2000)
0.6 K. The mean precipitation sum of Damshung and Pangdo is overestimated by the CLM ECHAM 5 driven SCALMET outputs, but the deviations are within 10 %, whereas in Lhasa the overestimation reaches 22 %. The precipitation sum is slightly underestimated for Meldro Gungkar and Tangga. In comparison to the CLM ERA 40 driven SCALMET
Coefficient of 0.79 0.78 0.80 0.72 0.70 0.74 determinationR−2
Slope of linear 1.37 1.30 1.29 1.00 0.92 0.93
regression
Nash–Sutcliffe 0.31 0.39 0.48 0.67 0.70 0.73
efficiency coefficient
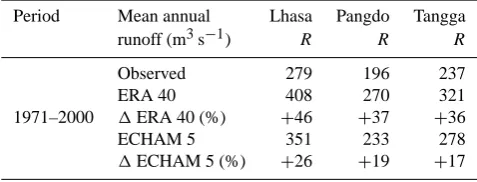
Table 4. Validation of mean annual runoff (m3s−1for ERA 40- and ECHAM 5-driven model runs).
Period Mean annual Lhasa Pangdo Tangga
runoff (m3s−1) R R R
1971–2000
Observed 279 196 237
ERA 40 408 270 321
1ERA 40 (%) +46 +37 +36
ECHAM 5 351 233 278
1ECHAM 5 (%) +26 +19 +17
precipitation of the CLM ECHAM 5 driven SCALMET out-puts are illustrated for the station Lhasa in Fig. 7. The sea-sonal cycles are captured by the model output, with the mon-soon precipitation during the summer months and the dry winters, although there are overestimations of precipitation during the pre-monsoon time in April and May, taking into account that the annual values cannot be reproduced by a cli-mate model. The comparison of the monthly simulated and observed values also shows modeling of a reasonable range of minimum and maximum values. Two January tempera-tures, however (1987, 1988), are simulated at a clearly lower level than all observations. Consequently, the mean meteo-rological conditions are reproduced by the CLM ECHAM 5 model run, particularly when considering the coarse resolu-tion of the CLM outputs. Taking into account technical dif-ficulties in precipitation observation and the resulting devia-tions, the average results seem to be reasonable.
4.2 Validation of glacier development in the LRB
As part of the Brahmatwinn project, a detailed glacier change study for the Lhasa River basin was conducted by com-paring multi-temporal optical remote sensing data from the Landsat and ASTER sensors with the Chinese Glacier In-ventory (Frauenfelder and K¨a¨ab, 2009; K¨a¨ab et al., 2008). A total change of−21 % in glacier area from 1970 to 2000 was found. Using various area–volume relations a mass
bal-Fig. 8. Comparison of observed and modeled monthly runoff.
Fig. 9. Comparison of observed and modeled daily runoff (Lhasa data are from Prasch et al., 2011a, p. 66).
ance change of−0.2 to−0.3 m w.e. per year was estimated (Frauenfelder and K¨a¨ab, 2009; K¨a¨ab et al., 2008).
For the past 30 yr, a decrease of 20 % (CLM ECHAM 5) of the glacier area is modeled. This is within the range of the observed glacier area reduction. For the ice-water reservoir, an average mass loss of 0.3 m (CLM ECHAM 5) is calcu-lated. In comparison with the results for this area, the mass loss is consistent.
4.3 Validation of runoff in the LRB
Fig. 10. Development of monthly observed and modeled runoff at Lhasa, Pangdo and Tangga gauges from 1971/1976–2000.
daily and monthly runoff values for the CLM ERA 40 driven model run together with quality criteria in Table 3, whereas for the CLM ECHAM 5 and ERA 40 driven results the mean annual runoff is validated as climate signal (Table 4). The validation of modeled runoff shows an overestimation during the summer months, but this overestimation changes during the validation period from 1971 to 2000. While it is large in the 1970s and 1980s, it is clearly reduced in the 1990s. The reason for the change can be found in the input of the amount of precipitation which is then also in better accor-dance with the observations as shown in the Supplement Ta-ble S2. Although there are biases, the seasonal runoff course is reproduced by the model, especially when taking into
ac-Fig. 11. Development of daily observed and modeled runoff (Lhasa data are from Prasch et al., 2011a, p. 66).
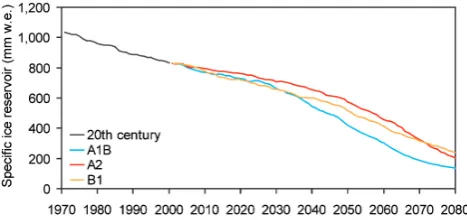
Fig. 12. Modeled development of the specific ice reservoir in the LRB from 1970 to 2080. The evolution is shown for the past (1970– 2000) and for the IPCC SRES-A1B, -A2 and -B1 emission scenar-ios (2000–2080). Detailed values can be found in Supplement Ta-ble S3.
Fig. 13. Mean annual runoff fraction of ice melt throughout the river network. Colored rivers contain ice-melt water; no ice melt contributes to runoff of brown rivers. The percentage is shown for rivers with average runoff above 0.5 m3s−1for the past (1971 to 2000) and the future SRES-A1B scenario periods (2011–2040 and 2051–2080); river width symbolizes runoff quantity between 0.5 and 450 m3s−1.
5 Results
The seasonal contribution of snow- and ice melt to total runoff is analyzed for the past 30 yr and the IPCC SRES-A1B, -A2 and -B1 emission scenarios (Naki´cenovi´c et al., 2000) until 2080. Figure 12 shows the development of the modeled total ice volume in the LRB between 1970 and 2080 for the three selected emission scenarios. The spatial dis-tribution in the LRB for 2000 and 2080 is shown in Sup-plement Fig. S1, detailed numbers of future glacier change are presented in Supplement Table S3. The observed con-tinuous glacier retreat during the last decades (Bolch et al., 2010, Frauenfelder and K¨a¨ab, 2009; K¨a¨ab et al., 2008; Yao et al., 2007) will continuously proceed regardless of the se-lected scenario, but glaciers will not completely disappear
river network
To determine the contribution of glacier ice-melt water, the model is run under two different model settings. In the first setting, glaciers are considered and ice melt is directly in-jected into the river channels. In the second setting, glacier volumes are set to zero. We consider, for each time step, the difference in runoff between the two model settings as the ice-melt runoff component. In order to specifically quan-tify the contribution of ice melt to total runoff, it is treated separately from snowmelt, which occurs contrary to ice melt throughout the whole basin. Divided by total runoff includ-ing ice melt, it represents the contribution of ice melt to total runoff, shown in Fig. 13. While ice melt amounts to more than 50 % of total runoff in the glacierized head wa-tersheds, its contribution rapidly decreases as watershed area increases. In the larger tributaries (A >3000 km2) and at the outlet of the LRB only 0.1–5 % of the water can be attributed to ice melt during the past period from 1971–2000.
Fig. 14. Modeled development of the fraction of snow precipitation in the LRB.
Fig. 15. Modeled number of snow days at different altitudes in the LRB.
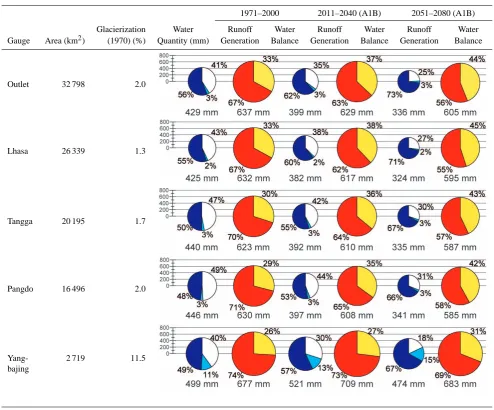
5.2 Ice melt related to other water balance components
The following analysis of all water balance components gives deeper insight. For each hourly model time step, runoff is composed of rainfall, snow- and ice melt, which, together with evapotranspiration and changes in snow, ice, soil and ground water storage close the water balance (see Eq. 1 and Supplement Tables S4, S5 and S6). Since long-term changes in soil water content and groundwater in the LRB are mod-eled to be below 1 %, they are neglected. To determine the relative contribution of ice melt in comparison to the other runoff and water balance components, we separated them for the five gauges in the LRB marked in Fig. 1. Table 5 shows that today about 30 % of the water in the LRB evaporates, which is in accordance with Sharma et al. (2000), whereas 70 % is released as runoff. The most important runoff com-ponent at the outlet today originates from snowmelt. Rainfall generates 40 % of the runoff whereas ice melt contributes be-tween 2 and 3 % (max. 11 % at Yangbajing).
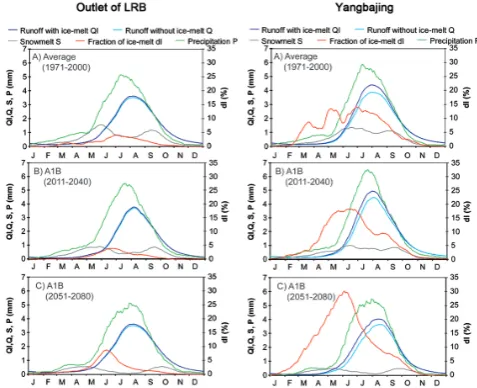
Under future climatic conditions, increasing evapotranspi-ration is modeled due to rising temperatures. Together with a slight decrease in precipitation this results in a consid-erable decrease in runoff at all gauges except at Yangba-jing during both future periods. There, evapotranspiration increases only marginally and the modeled annual ice-melt contribution slightly increases because of the large decrease in snowmelt during both simulated future periods. The latter
Fig. 16. Average annual dynamics of daily different runoff com-ponents at the outlet of the LRB (left) and at Yangbajing (right) (moving average over 30 days); river runoff with (blue) and without (cyan) ice melt (left y-axis) together with snowmelt water release of the basin (grey, left y-axis), precipitation (green, left y-axis) and fraction of ice melt (red, right y-axis) for the periods 1971–2000 (A), 2011–2040 (B) and 2051–2080 (C) are shown (see also Sup-plement Fig. S2).
is due to the compensational effect described above. Conse-quently, the importance of ice melt will remain low at the outlet and in most parts of the LRB (see also Fig. 13).
5.3 The seasonal timing of melt contribution
Glacierization Water Runoff Water Runoff Water Runoff Water Gauge Area (km2) (1970) (%) Quantity (mm) Generation Balance Generation Balance Generation Balance
Outlet 32 798 2.0
Lhasa 26 339 1.3
Tangga 20 195 1.7
Pangdo 16 496 2.0
Yang- 2 719 11.5
bajing
radiation and snowmelt from its peak in early June. The de-creasing rainfall and cloud cover towards the end of the rainy season in September and October cause snowmelt to increase again. Since glaciers are still protected by a snow cover, ice melt is not increasing. Falling temperatures in September de-crease ice melt until it stops in late October. Accordingly, runoff generated from rainfall and ice melt is almost cyclic (see Sect. 2) at the outlet of the LRB. The close match be-tween total modeled runoff with and without ice melt con-firms the minor contribution of ice melt (Figs. 13, 16, S2). From the point of view of water management this is unfa-vorable since ice melt cannot augment low-flow conditions during the dry winter season.
becomes lower in the scenario periods. Consequently, runoff is reduced, mainly caused by changes in the amount of pre-cipitation. Additionally the reduction of snowmelt and in-creasing evapotranspiration forces the runoff reduction dur-ing early summer, particularly for the period from 2051 to 2080 (Figs. 16, S2).
These processes are basically similar for the sub-basin of Yangbajing with larger glacierization and accordingly larger ice-melt contribution to runoff (Figs. 16, right; S2, right). Al-though the amount of ice melt increases in future periods not only in spring as described above (Sects. 5.1, 5.2), but also in early summer, runoff is reduced during these months taking into account the increase in precipitation in the second sce-nario period. Only in May the increasing ice melt up to 30 % can augment the missing snowmelt and reduced precipita-tion, whereas during the summer months, this effect is neg-ligible. Again, the strong decrease of snowmelt and increase of evapotranspiration are the reasons, despite higher altitudes and larger ice reservoirs with the described compensational effect (Sect. 5.1).
6 Conclusions
The presented approach offers the possibility to analyze the temporal and spatial pattern of the rainfall, snow- and ice-melt contribution to river runoff under past and future cli-matic conditions. The consideration of regional variations provides a detailed basis for the development of appropriate adaptation strategies to GCC in order to support future wa-ter availability. Although the models require a broad range of input data due to the complexity of the subject to be mod-eled, this study demonstrates their applicability in remote regions. The validation for the Lhasa River catchment pre-sented proves the reliability of the model results for glaciers and for the hydrological water balance.
The resulting quantification of the contribution of glacier ice-melt water to river runoff not only in the highly glacier-ized head watersheds but also for the downstream regions as the main objective of this study let us conclude that ice melt, on average, has played and will play a minor role in the downstream water supply from the Lhasa River, contributing less than 5 %. Although glaciers will be strongly reduced by GCC, this is mainly due to the cyclic behavior of runoff gen-erated from rainfall and from ice melt in the past and future in accordance to Thayyen and Gergan (2010), because precipi-tation and ice melt will remain cyclic under GCC according to the scenarios. Thus, the contribution of ice melt to total runoff will almost remain stable until 2080, although there will be a slight increase during a short period in spring. Con-trary, the contribution of snowmelt to river runoff will gener-ally decrease with GCC in the LRB and result in changes in water availability. Additionally, the increase of evapotranspi-ration with increasing air temperatures also will reduce water availability. Since the LRB is representative for glacierized,
summer-monsoon dominated Himalayan basins, this result can be generalized for summer-monsoon dominated regions in the Himalayas as for instance the Ganges and Brahmapu-tra river basins (Fig. 1).
Uncertainties still exist in the simulation of future mon-soon precipitation in current GCMs (Kripalani et al., 2007) and spatial distribution is still especially difficult to simulate (Kripalani et al., 2007; Dobler and Ahrens, 2010). Hence, significantly increased monsoon precipitation would modify the simulation result for runoff and glacier changes. Since there is no indication from the currently available climate model results that monsoon timing and dynamics will dras-tically change in the upcoming future as a consequence of GCC, the results of the study strongly suggest a re-evaluation of the future role of the glaciers for the water management in the Himalaya region and its lowlands.
Supplementary material related to this article is
available online at: http://www.the-cryosphere.net/7/889/ 2013/tc-7-889-2013-supplement.pdf.
Acknowledgements. Financial support by the European Com-mission Sixth Framework Programme (FP6) within the project “Brahmatwinn” and the Federal Ministry of Education and Research (BMBF) within the “GLOWA-Danube” project are gratefully acknowledged. We thank the Institute of Tibetan Plateau Research ITP and the International Centre for Integrated Mountain Development ICIMOD for data provision.
Edited by: J. O. Hagen
References
Baraer, M., Mark, B. G., McKenzie, J. M., Condom, T., Bury, J., Huh, K., Portocarrero, C., G´omez, J., and Rathay, S.: Glacier recession and water resources in Peru’s Cordillera Blanca, J. Glaciol., 58, 134–150, doi:10.3189/2012JOG11J186, 2012. Barnett, T. P., Adam, J. C., and Lettenmaier, D. P.: Potential impacts
of a warming on water availability in snow-dominated regions, Nature, 438, 303–309, doi:10.1038/nature04141, 2005. Bolch, T., Yao, T., Kang, S., Buchroithner, M. F., Scherer, D.,
Maus-sion, F., Huintjes, E., and Schneider, C.: A glacier inventory for the western Nyainqentanglha range and the Nam Co basin, Tibet, and glacier changes 1976–2009, The Cryosphere, 4, 419–433, doi:10.5194/tc-4-419-2010, 2010.
Bolch, T., Kulkarni, A., K¨a¨ab, A., Huggel. C, Paul, F., Cogley, J. G., Frey, H., Kargel, J.S., Fujita, K., Scheel, M, Bajracharya, S., and Stoffel, M.: The State and Fate of Himalayan Glaciers, Science, 336, 310–314, 10.1126/science.1215828, 2012.
Climate Limited-area Modeling Community, available at: http:// www.clm-community.eu (last access: 22 May 2012), 2012. Collins, D. N. and Taylor, D. P.: Variability of runoff from
partially-glacierised Alpine basins, in: Hydrology in Mountains Regions, Proceedings of two Lausanne Symposia, August 1990, IAHS Publ., 193, 365–372, 1990.
Cruz, R. V., Harasawa, H., Lal, M., Wu, S., Anokhin, Y., Punsalmaa, B., Honda, Y., Jafari, M., Li, C., and Huu Ninh, N.: Asia, in: Cli-mate Change 2007: Impacts, Adaptation and Vulnerability. Con-tribution of Working Group II to the Fourth Assessment Report of the Intergovernmental Panel on Climate Change, edited by: Parry, M. L., Canziani, O. F., Palutikof, J. P., van der Linden, P. J., and Hanson, C. E., Cambridge University Press, Cambridge, UK, 469–506, 2007.
Dobler, A. and Ahrens, B.: Precipitation by a regional climate model and bias correction in Europe and South Asia, Meteorolo. Z., 17, 499–509, doi:10.1127/0941-2948/2008/0306, 2008. Dobler, A. and Ahrens, B.: Analysis of the Indian summer monsoon
system in the regional climate model COSMO-CLM. Geophys. Res., 115, D16101, doi:10.1029/2009JD013497, 2010.
ERSDAC: The Ministry of Economy, Trade, and Industry (METI) of Japan and the United States National Aeronautics and Space Administration (NASA): Aster Global Digital Elevation Model (GDEM), available at: http://www.jspacesystems.or.jp/ersdac/ GDEM/E/2.html, 2009.
FAO, IIASA, ISRIC, ISSCAS, JRC: Harmonized World Soil Database V 1.1, FAO, Rome, Italy and IIASA, Laxen-burg, Austria, available at: http://www.iiasa.ac.at/Research/LUC/ External-World-soil-database/HTML/, 2009.
Fl¨ugel, W.-A.: Twinning European and South Asian river basins to enhance capacity and implement adaptive integrated water re-sources management approaches – results from the EC-project BRAHMATWINN, Adv. Sci. Res., 7, 1–9, doi:10.5194/asr-7-1-2011, 2011.
Frauenfelder, R. and K¨a¨ab, A.: Glacier mapping from multi-temporal optical remote sensing data within the Brahmaputra river basin, in: Proceedings of the 33rd International Sympo-sium on Remote Sensing of Environment, Stresa, Italy, 4–8 May 2009, available at: http://folk.uio.no/kaeaeb/publications/299 R. Frauenfelder.pdf, 2009.
Garbrecht, J. and Martz, L. W.: TOPAZ Version 3.1, USDA, Agri-cultural Research Service Grazinglands Research Laboratory, Oklahoma, USA, 1999.
Haeberli, W. and Hoelzle, M.: Application of inventory data for esti-mating characteristics of and regional climate-change effects on mountain glaciers: a pilot study with the European Alps, Ann. Glaciol., 21, 206–212, 1995.
Huss, M.: Present and future contribution of glacier storage change to runoff from macroscale drainage basins in Europe, Water Re-sour. Res., 47, W07511, doi:10.1029/2010WR010299, 2011.
Bierkens, M. F. P.: Hydrological response to climate change in a glacierized catchment in the Himalayas, Climatic Change, 110, 721–736, doi:10.1007/s10584-011-0143-4, 2012.
Iziomon, M. G., Mayer, H., and Matzarakis, A.: Downward at-mospheric longwave irradiance under clear and cloudy skies: Measurement and parameterization. J. Atmos. Sol-Terr. Phy., 65, 1107–1116, 2003.
Jansson, P., Hock, R., and Schneider, T.: The concept of glacier storage: a review, J. Hydrol., 282, 116–129, doi:10.1016/S0022-1694(03)00258-0, 2003.
Jarvis, A., Reuter, H. I., Nelson, A., and Guevara, E.: Hole-filled seamless SRTM data V3, International Centre for Tropical Agri-culture (CIAT), available at: http://srtm.csi.cgiar.org, 2006. K¨a¨ab, A., R. Frauenfelder, R., and Frauenfelder K¨a¨ab, J. A.: Glacier
distribution and glacier area changes 1960s-2000 in the Brahma-putra river basin, EGU General Assembly, Vienna, Austria, 13– 18 April 2008, EGU08–A–05334, 2008.
K¨a¨ab, A., Berthier, E., Nuth, Ch., Gardelle, J., and Ar-naud, Y.: Contrasting patterns of early twenty-first-century glacier mass change in the Himalaya, Nature, 488, 495–498, doi:10.1038/nature11324, 2012.
Kaltenborn, B. P., Nellemann, C., and Vistnes, I. I.: High mountain glaciers and climate change. Challenges to human livelihoods and adaptation, United Nations Environment Programme, GRID-Arendal, GRID-Arendal, Norway, 56 pp., 2010.
Kang, S., Qin, D., Ren, J., Zhang, Y., Kaspari, S., Mayewski, P. A., and Hou, S.: Annual Accumulation in the Mt. Nyainqentanglha Ice core, Southern Tibetan Plateau, China: Relationships to At-mospheric Circulation over Asia, Arct. Antarct. Alp. Res., 39, 63–670, 2007.
Kaser, G., Großhauser, M., and Marzeion, B.: Contribution potential of glacierst o water availability in different cli-mate regimes, P. Natl. Acad. Sci. USA, 107, 20223–20227, doi:10.1073/pnas.1008162107, 2010.
Kripalani, R. H., Oh, J. H., Kulkarni, A., Sabade, S. S., and Chaud-hari, H. S.: South Asian summer monsoon precipitation vari-ability: coupled climate simulations and projections under IPCC AR4, Theor. Appl. Climatol. 90, 133–159, doi:10.1007/s00704-006-0282-0, 2007.
Li, Z., He, Y., An, W., Song, L., Zhang, W., Catto, N., Wang, Y., Wang, S., Liu, H., Cao, W., Theakstone, W. H., Wang, S., and Du, J.: Climate and glacier change in southwestern China during the past several decades, Environ. Res. Lett., 6, doi:10.1088/1748-9326/6/4/045404, 2011.
Liston, G. E. and Elder, K.: A Meteorological Distribution System for High-Resolution Terrestrial Modeling (MicroMet), J. Hy-drometeorol.,7, 217–234, 2006.
Mu-nich, Germany, available at: http://edoc.ub.uni-muenchen.de/ 9162/,188 pp., 2008.
Marke, T., Mauser, W., Pfeiffer, A., and Z¨angl, G.: A pragmatic approach for the downscaling and bias correction of regional cli-mate simulations: evaluation in hydrological modeling, Geosci. Model Dev., 4, 759–770, doi:10.5194/gmd-4-759-2011, 2011a. Marke, T., Mauser, W., Pfeiffer, A., Z¨angl, G., and Jacob, D.: The
effect of downscaling on river runoff modeling: a hydrologi-cal case study in the Upper Danube Watershed, Hydrol. Earth Syst. Sc. Discuss., 8, 6331–6384, doi:10.5194/hessd-8-6331-2011, 2011b.
Mauser, W. and Bach, H.: PROMET – Large scale distributed hy-drological modeling to study the impact of climate change on the water flows of mountain watersheds, J. Hydrol., 376, 362–377, doi:10.1016/j.jhydrol.2009.07.046, 2009.
Moore, R. D., Fleming, S. W., Menounos, B., Wheate, R., Foun-tain. A, Stahl, K., Holm, K., and Jakob, M.: Glacier change in western North America: Influences on hydrology, geomor-phic hazards and water quality, Hydrol. Process., 23, 42–61, doi:10.1002/hyp.7162, 2009.
Naki´cenovi´c, N. and Swart, R.: IPCC Special Report on Emission Scenarios, Intergovernmental Panel on Climate Change, Cam-brigde, United Kingdom, 608 pp., 2000.
Pellicciotti, F., Bauder, A., and Parola, M.: Effect of glaciers on streamflow trends in the Swiss Alps, Water Resour. Res., 46, W10522, doi:10.1029/2009WR009039, 2010.
Pellicciotti, F., Buergi, C., Immerzeel, W. W., Konz, M., and Shrestha, A. B.: Challenges and Uncertainties in Hydrological Modeling of Remote Hindu Kush-Karakoram-Himalayan (HKH) Basins: Suggestions for Calibration Strategie, Mt. Res. Dev., 32, 39–50, doi:10.1659/MRD-JOURNAL-D-11-00092.1, 2012. Prasch, M., Bernhardt, M., Weber, M., Strasser, U., and Mauser, W.:
Physically based modelling of snow cover dynamics in Alpine regions, in: Managing Alpine Future – IGF Forschungsberichte, 2, edited by: Borsdorf, A., St¨otter, J., and Veulliet, E., Verlag der ¨Osterreichischen Akademie der Wissenschaften, Innsbruck, Austria, 322–330, 2008.
Prasch, M., Marke, T., Strasser, U., and Mauser, W.: Large scale in-tegrated hydrological modelling of the impact of climate change on the water balance with DANUBIA, Adv. Sci. Res., 7, 61–70, doi:10.5194/asr-7-61-2011, 2011a.
Prasch, M., Weber, M., and Mauser, W.: Distributed modelling of snow- and ice-melt in the Lhasa River basin from 1971 to 2080, in: Cold Regions Hydrology in a Changing Climate, Proceedings of an international symposium, H02, held during IUGG 2011 in Melbourne, Australia, July 2011, IAHS Publ., 346, 57–64, 2011b.
Rees, H. G. and Collins, D. N.: Regional differences in response of flow in glacier-fed Himalayan rivers to climatic warming, Hy-drol. Process., 20, 2157–2169, doi:10.1002/hyp.6209, 2006. Sharma, K. P., Vorosmarty, Ch. J., and Moore III, B.: Sensitivity
of the Himalayan hydrology to land-use and climatic changes, Climatic Change, 47, 117–139, 2000.
Singh, P., Arora, M., and Goel, N. K.: Effect of climate change on runoff of a glacierized Himalayan basin, Hydrol. Process., 20, 1979–1992, doi:10.1002/hyp.5991, 2006.
Thayyen, R. J. and Gergan, J. T.: Role of glaciers in watershed hy-drology: a preliminary study of a “Himalayan catchment”, The Cryosphere, 4, 115–128, doi:10.5194/tc-4-115-2010, 2010. Viviroli, D., D¨urr, H. H., Messerli, B., Meybeck, M., and
Wein-gartner, R.: Mountains of the world, water towers for humanity: Typology, mapping, and global significance, Water Resour. Res., 43, W07447, doi:10.1029/2006WR005653, 2007.
Viviroli, D., Archer, D. R., Buytaert, W., Fowler, H. J., Greenwood, G. B., Hamlet, A. F., Huang, Y., Koboltschnig, G., Litaor, M. I., L´opez-Moreno, J. I., Lorentz, S., Sch¨adler, B., Schreier, H., Schwaiger, K., Vuille, M., and Woods, R.: Climate change and mountain water resources: overview and recommendations for research, management and policy, Hydrol. Earth Syst. Sc., 15, 471–504, doi:10.5194/hess-15-471-2011, 2011.
Weber, M., Braun, L. N., Mauser, W., and Prasch, M.: Contribution of rain, snow- and icemelt in the upper Danube today and in the future, Geogr. Fis. Din. Quat., 33, 221–230, 2010.
World Data Center For Glaciology and Geocryology: Chinese Glacier Inventory, available at: http://wdcdgg.westgis.ac.cn/ (last access: 17 August 2009), 2009.
Xu, J., Grumbinde, R. E., Shrestha, A., Eriksson, M., Yang, X., Wang, Y., and Wilkes, A.: The Melting Himalayas: Cascad-ing Effects of Climate Change on Water, Biodiversity, and Livelihoods, Conserv. Biol., 23, 520–530, doi:10.1111/j.1523-1739.2009.01237.x, 2009.
Yao, T., Pu, J., and Liu, S.: Changing glaciers in High Asia, in: Glacier science and environmental change, edited by: Knight, P.G., Wiley, Oxford, United Kingdom, 275–282, 2006.
Yao, T., Pu, J., Lu, A., Wang, Y., and Yu, W.: Recent glacial retreat and its impact on hydrological processes on the Tibetan Plateau, China, and surrounding regions, Arct. Antarct. Alp. Res., 39, 642–650, doi:10.1657/1523-0430(07-510)[YAO]2.0.CO;2, 2007.