O R I G I N A L R E S E A R C H A R T I C L E
Open Access
Which health technologies should be funded?
A prioritization framework based explicitly on
value for money
Ofra Golan
1*†and Paul Hansen
2†Abstract
Background:Deciding which health technologies to fund involves confronting some of the most difficult choices in medicine. As for other countries, the Israeli health system is faced each year with having to make these difficult decisions. The Public National Advisory Committee, known as‘the Basket Committee’, selects new technologies for the basic list of health care that all Israelis are entitled to access, known as the‘health basket’. We introduce a framework for health technology prioritization based explicitly on value for money that enables the main variables considered by decision-makers to be explicitly included. Although the framework’s exposition is in terms of the Basket Committee selecting new technologies for Israel’s health basket, we believe that the framework would also work well for other countries.
Methods:Our proposed prioritization framework involves comparing four main variables for each technology: 1. Incremental benefits, including‘equity benefits’, to Israel’s population; 2. Incremental total cost to Israel’s health system; 3. Quality of evidence; and 4. Any additional‘X-factors’not elsewhere included, such as strategic or legal factors, etc. Applying methodology from multi-criteria decision analysis, the multiple dimensions comprising the first variable are aggregated via a points system.
Results:The four variables are combined for each technology and compared across the technologies in the‘Value for Money (VfM) Chart’. The VfM Chart can be used to identify technologies that are good value for money, and, given a budget constraint, to select technologies that should be funded. This is demonstrated using 18 illustrative technologies.
Conclusions:The VfM Chart is an intuitively appealing decision-support tool for helping decision-makers to focus on the inherent tradeoffs involved in health technology prioritization. Such deliberations can be performed in a systematic and transparent fashion that can also be easily communicated to stakeholders, including the general public. Possible future research includes pilot-testing the VfM Chart using real-world data. Ideally, this would involve working with the Basket Committee. Likewise, the framework could be tested and applied by health technology prioritization agencies in other countries.
Keywords:Health technology, Prioritization, Basket committee, Multi-criteria decision analysis, Points system, Value for money
* Correspondence:[email protected]
†Equal contributors 1
Unit for Genetic Policy & Bioethics, The Gertner Institute for Epidemiology & Health Policy Research, Tel Hashomer, Israel
Full list of author information is available at the end of the article
Israel Journal of
Health Policy Research
© 2012 Golan and Hansen; licensee BioMed Central Ltd. This is an Open Access article distributed under the terms of the Creative Commons Attribution License (http://creativecommons.org/licenses/by/2.0), which permits unrestricted use, distribution, and reproduction in any medium, provided the original work is properly cited.
Background
No health system in the world has sufficient resources to be able to afford all available health care technologies
– i.e. pharmaceuticals, medical procedures, equipment,
devices and health services. Inevitably, therefore, tech-nologies must be prioritized. Deciding which technolo-gies to fund (and which not to) involves confronting some of the most difficult choices in medicine.
As for other countries, the Israeli health system, which is committed to an explicit prioritization process for new technologies, is faced each year with having to make these difficult decisions. The National Health Insurance Law determines a basic list of health care that all Israelis
are entitled to access, known as the ‘health basket’ [1].
New technologies are added to the health basket once a year depending on the funds available, which is just a small fraction of the total amount requested for new technologies. For example, in 2010 the Committee had to decide how to allocate a budget of 300 million shekels (approximately US$85 million) across 430 candidate
technologies–mostly pharmaceuticals, and with a
com-bined total cost of more than a billion shekels –
result-ing in 61 beresult-ing added to the health basket [2].
The Israeli mechanism for updating the health basket comprises two main elements. First, health technology assessments are performed by the Health Technologies Forum at the Ministry of Health. The added value of each technology submitted for addition to the basket is assessed with respect to its clinical, epidemiological and economic characteristics, including its predicted impact on the available budget. Second, and as discussed in greater detail in the Discussion section below, informed by these assessments, the Public National Advisory
Committee, known as ‘the Basket Committee’, selects
new technologies for the basket based on the application
of pre-defined criteria related to the technologies’costs
and benefits as well as ethical and legal considerations [3,4]. This prioritization process is considered by many health policy analysts, both in Israel and abroad, to be internationally ground-breaking [1,5-7]. It is unique with respect to its comparison of all proposed technologies together (numbering in the hundreds, as in the example above) subject to a budget constraint, and for its integra-tion of professionally-performed technology assessments with pre-defined criteria and ethical and legal considera-tions [5].
The criteria used by the Basket Committee [8] are mostly universal, as we established in an earlier study [9] in which we surveyed the literature (using PubMed and Google) to discover the main criteria and other consid-erations for prioritizing new technologies in use inter-nationally. Encompassing 11 countries and the US state of Oregon, we were able to distinguish three main groups of criteria: need, appropriateness and clinical
benefits; efficiency (including cost-effectiveness); and equality, solidarity and other ethical or social values. As well, the quality of clinical evidence and factors related to strategic issues and procedural justice were explicitly considered in several countries.
Although these criteria and other considerations are qualitatively similar across countries, their relative im-portance is different, reflecting international differences in how the inevitable conflicts and trade-offs between competing moral principles are dealt with. The Basket Committee is mandated to resolve such conflicts and trade-offs between competing moral principles based on the value judgments of its members. According to the
Ministry of Health, “The criteria which guide the
Com-mittee’s work are nothierarchical and notequivalent in
their importance. The criteria should be used as a quali-tative (and not quantiquali-tative) guideline for the
Commit-tee’s decisions” (p. 8) [8]. However, no guidance is
offered about how to weight and balance the criteria and other considerations relative to each other [10].
“For a set of moral considerations to be useful to deci-sion makers, some guidance on weighting of different
considerations needs to be given.” (p. 57) [11]. This
re-quirement, or, conversely, the absence of such guidance for decision-makers internationally, has been pointed out many times by researchers [10,12-16]. Stafinski et al. [16] assembled a comprehensive inventory of decision-making processes used in 20 countries (not including
Is-rael). “While information requirements of all processes
appeared substantial and decision-making factors com-prehensive, the way in which they were utilized was often unclear, as were approaches used to incorporate
social values or equity arguments into decisions.”(p. 476).
Although cost-effectiveness evidence is the main consid-eration for prioritization agencies such as, for example, the UK’s National Institute for Health and Clinical Excel-lence, other factors are also taken into account [17]; however, it is not clear how such factors are incorporated in practice [15]. The advisability of there being more structure in the decision-making processes employed by the Israeli Basket Committee is suggested by a forth-coming review of the Committee’s decisions and the reported comments of its members [18].
Informed by our earlier study’s results [9], this article
introduces a framework for health technology
prioritization based explicitly on value for money that enables the main variables considered by decision-makers such as the Basket Committee to be explicitly included. The main challenge addressed by what we
refer to as the ‘Value for Money Chart’ is how to
com-bine these variables in a transparent and intuitively appealing way that helps decision-makers to focus on the inherent tradeoffs when choosing new technologies subject to a budget constraint. Although our exposition
Golan and HansenIsrael Journal of Health Policy Research2012,1:44 Page 2 of 14
of the framework is couched in terms of the Basket Committee selecting new technologies for Israel’s health basket, we believe that the framework would also work well for other countries as well as for other levels of health technology prioritization (e.g. regional or service providers).
Methods
Informed by the results of our earlier study [9] men-tioned above, our proposed framework involves compar-ing four main variables for each technology (from a societal perspective): 1. Incremental benefits, including
‘equity benefits’, to Israel’s population; 2. Incremental
total cost to Israel’s health system; 3. Quality of evidence;
and 4. Any additional‘X-factors’not elsewhere included,
such as strategic or legal factors, etc. It is important to appreciate that these first two variables are at the
aggre-gate level for each technology – i.e. in terms of the
effects of the overall intervention involving the technol-ogy on Israel’s population and health system respectively
– rather than at a disaggregated level (e.g. per patient
treated). Each of the four variables is now explained in turn.
Incremental benefits, including‘equity benefits’, to Israel’s population
Health technologies have three fundamental purposes: to save lives, to prolong lives, and to improve (or
pre-serve) health-related quality-of-life (HRQoL); in
addition, health resources are used to reduce health
in-equalities [11]. Thus, the‘incremental benefits, including
equity benefits, to Israel’s population’ potentially
avail-able from each technology has four main dimensions: life-saving, life-prolongation, HRQoL improvements,
and‘equity benefits’.
‘Equity benefits’relates to the various aspects of equity
that ought to be taken into account when assessing health technologies [19]. Consistent with our earlier study [9], two main aspects (sub-dimensions) are included in our proposed framework: the extent to which, if the technology were not to be funded, patients would be denied treatment due to a lack of alternative treatments or difficulties accessing them; and the exist-ence of other important equity-related social or ethical benefits, such as the technology being targeted at
spe-cific populations with prima facie special claims (e.g.
children or minorities) or serving to reduce health gaps (inequalities), etc.
It should be clear from the discussion above that this
first variable in the framework,‘incremental benefits,
in-cluding equity benefits, to Israel’s population’, is
multi-dimensional. In order to be able to compare this variable against the framework’s three other variables (explained
below)–for which, as discussed below, uni-dimensional
measures exist–some means of aggregating the
dimen-sions in a way that reflects their relative importance and quantifies tradeoffs so that a uniform measure (index) of incremental benefits can be created is required.
An obvious way of aggregating the three dimensions of life-saving, life-prolongation and HRQoL improve-ments is to use Quality-Adjusted Life Years (QALYs).
However, for new health technologies QALY data may
not be available; and this ‘data problem’ is magnified if,
as is the case for Israel’s Health Basket, there are many technologies to be evaluated at once. A practical alterna-tive to using QALYs is to focus directly on the under-lying dimensions themselves (albeit their data may be less than perfect too), while also recognizing that each dimension comprises various sub-dimensions. Thus, the life-prolongation dimension incorporates increases in life expectancy and the HRQoL at which the additional life years are experienced; the HRQoL-improvements di-mension incorporates the magnitude of the HRQoL gains, their duration, and baseline HRQoL (‘need’).
Whichever of these two possible approaches is used, some means of aggregating either QALYs gained with
‘equity benefits’ (itself multi-dimensional) or the
under-lying dimensions is required. A common methodology from the field of multi-criteria decision analysis is to use
a points system (sometimes also referred to as a‘scoring’,
‘linear’or‘point-count’system).
A points system is a schedule of ‘point values’ (or
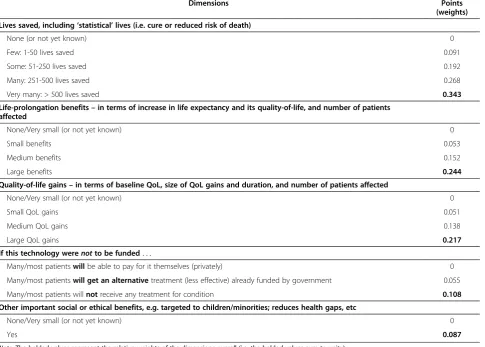
‘weights’) representing both the relative importance of the dimensions and their degree of achievement; an example for ranking new technologies that we developed in our earlier study [9] appears in Table 1, where the point values were derived from a convenience sample of respondents (discussed later below) and are reported here for illustra-tive purposes only. Points systems, which have been found
to be accurate in thousands of ‘health’ and ‘non-health’
applications [20], are widely used for diagnostic and treatment-based decision-making [21]. Other health appli-cations include prioritizing patients within specific elective services in the UK, New Zealand and Canada [22] and al-locating transplant organs by the United Network of Organ Sharing [23]. In the present context, using a points system involves rating each technology according to its performance on each dimension and then summing the
corresponding point values to get a‘total score’ by which
the technologies are ranked. Later in this section we ex-plain how to derive point values.
Incremental total cost to Israel’s health system
A technology’s ‘incremental total cost to Israel’s health
system’(i.e. as explained earlier, at the aggregate level of
the overall intervention involving the technology) can be measured in net present value (NPV) terms. This NPV includes all expected future spending, net of any cost
Golan and HansenIsrael Journal of Health Policy Research2012,1:44 Page 3 of 14
savings to the health system, over the intervention’s
life-time –i.e. the same lifetime over which the incremental
benefits referred to above are recognized. Alternatively–
as in our illustration in the next section–both the costs
and benefits could be in per annum terms. All else being equal, a technology’s incremental total cost to Israel’s health system will be positively related to the interven-tion’s time horizon and also to the number of patients to
be treated, which depends on how eligibility is defined–
which in turn determines the incremental benefits pos-sible from the technology.
Quality of evidence
Especially fornewtechnologies, there are likely to be
sig-nificant differences between technologies with respect to the quality of their clinical evidence. For example, if two technologies are assessed as having the same incremen-tal benefits (the first variable above), but one assessment is based on higher quality evidence than the other, then
they ought to be differentiated in this regard – so that
the technology with the higher quality evidence receives higher priority (all else being equal).
Several grading schemes for assessing quality of evi-dence [24-26] are potentially available, of which the GRADE system [24] is perhaps the best known. GRADE,
which defines quality of evidence as “the extent to which
we can be confident that an estimate of effect is correct” (p. 1490), incorporates four key elements: study design, study quality, consistency (the similarity of effect esti-mates across studies), and directness (the extent to which the people, interventions and outcome measures in the studies are similar to those of interest). In general, how-ever, caution should be exercised when applying grading
schemes.“It should be noted that not all the schemes take
into account the generalizability of the findings of the re-view to routine clinical practice. This should always be a consideration when drawing up the implications or if
making recommendations.”(p. 82) [27].
Any additional‘X-factors’not elsewhere included, such as strategic or legal factors, etc
This last variable in the prioritization framework is, in effect, a catchall for any residual special circumstances
of a priori uncertain importance that ought to be
Table 1 Illustrative points system for the incremental-benefits variable
Dimensions Points
(weights)
Lives saved, including‘statistical’lives (i.e. cure or reduced risk of death)
None (or not yet known) 0
Few: 1-50 lives saved 0.091
Some: 51-250 lives saved 0.192
Many: 251-500 lives saved 0.268
Very many: > 500 lives saved 0.343
Life-prolongation benefits–in terms of increase in life expectancy and its quality-of-life, and number of patients affected
None/Very small (or not yet known) 0
Small benefits 0.053
Medium benefits 0.152
Large benefits 0.244
Quality-of-life gains–in terms of baseline QoL, size of QoL gains and duration, and number of patients affected
None/Very small (or not yet known) 0
Small QoL gains 0.051
Medium QoL gains 0.138
Large QoL gains 0.217
If this technology werenotto be funded. . .
Many/most patientswillbe able to pay for it themselves (privately) 0
Many/most patientswill get an alternativetreatment (less effective) already funded by government 0.055
Many/most patients willnotreceive any treatment for condition 0.108
Other important social or ethical benefits, e.g. targeted to children/minorities; reduces health gaps, etc
None/Very small (or not yet known) 0
Yes 0.087
Note: The bolded values represent the relative weights of the dimensions overall (i.e. the bolded values sum to unity).
Golan and HansenIsrael Journal of Health Policy Research2012,1:44 Page 4 of 14
recognized. This variable is meant to be implemented
simply as a‘flag’to alert decision-makers that such
add-itional X-factors – which could be positive or negative
(i.e. supportive of the technology being added to the
health basket, or not) – ought to be considered, on a
technology-by-technology basis. For example, the tech-nology of contraceptives for teenage girls involves unique religious, ethical and social considerations that most
people would probably agree ought to be considered.a
There would be no need to recognize such X-factors if the first three variables discussed above (incremental benefits, incremental costs, quality of evidence) perfectly captured all relevant considerations for prioritizing tech-nologies. In practice, though, this is unlikely, as there will almost always be particular technologies for which there are additional factors that ought to be considered. The key point is that if decision-makers think that a given technology’s X-factors should, in effect, over-ride its performance on the three other variables with respect to being selected or rejected for the basket then the rea-sons for doing so should be made explicit.
Creating a points system for the incremental-benefits variable
As discussed earlier, ‘incremental benefits, including
equity benefits, to Israel’s population’comprises multiple
dimensions that are aggregatable into a single measure using a points system. An example of a points system developed in our earlier study [9] appears in Table 1. The reported point values, which were derived from a convenience sample recruited through the first author’s
professional networks,b are applied for illustrative
pur-poses in the next section. Were the framework being used by the Basket Committee, the points system’s
dimensions and their ‘performance’ levels would likely
need to be refined; likewise, the point values–the
deter-mination of which is explained next –would reflect the
Committee’s preferences.
Thus, after a points system’s dimensions and levels have been specified, their point values, reflecting the rela-tive importance of the dimensions to decision-makers, need to be determined. Several methods and software for implementing them are available, as surveyed in [15,28] and [29] respectively. Methods that involve
decision-makers expressing a choice between the alternatives of
interest, such as conjoint analysis (also known as‘discrete
choice experiments’[30]) which has been recommended
as the best overall approach for valuing health benefits
[31], are generally favored. “The advantage of
choice-based methods is that choosing . . . is a natural human
task at which we all have considerable experience, and
furthermore it is observable and verifiable.”(p. 145) [32].
An example of a choice-based methodology is the PAPRIKA method [33]. PAPRIKA, which is an
acro-nym for ‘Potentially All Pairwise RanKings of all
possible Alternatives’, and software for implementing
the method known as‘1000Minds’[34] were co-invented
by the second author (from whom or via [34] the software is available for free to unfunded academic users). PAP-RIKA and 1000Minds were used in our earlier study [9], and also here in our prioritization framework. Other appli-cations of the method and software include prioritizing patients for elective surgery [33,35,36], referring patients for rheumatology services [37], classifying individuals by their risks of developing rheumatoid arthritis [38], and measuring patients’responses in clinical trials for chronic gout [39].
The PAPRIKA method involves decision-makers –
Basket Committee members and/or their constituenciesc
if the Committee were to use the framework – using
their judgments to pairwise rank a series of hypothetical technologies with respect to their relative priority for addition to the health basket. The pairs of hypothetical technologies, which are presented in random order, are defined on two dimensions at-a-time so that decision-makers are forced to confront a trade-off between the dimensions with respect to their relative importance for prioritizing technologies. An example of a pairwise-ranking question (a screen from the 1000Minds soft-ware) appears in Figure 1.
Although it is possible for decision-makers to answer
the questions individually (with their results ‘averaged’),
based on the second author’s experience in similar appli-cations [36], we believe it is better to have decision-makers answer the questions as a group by having them vote on each question and discuss any significant disagree-ments and reach consensus (not necessarily unanimity).
The PAPRIKA method ensures that the number of questions that decision-makers have to answer is mini-mized by, each time a question is answered, eliminating
Figure 1Example of a pairwise-ranking question for determining point values.
Golan and HansenIsrael Journal of Health Policy Research2012,1:44 Page 5 of 14
all other possible questions that are implicitly answered as corollaries of those already answered. This is achieved
via the method’s application of the ‘transitivity’property;
for example, if decision-makers rank hypothetical
tech-nology ‘A’ ahead of technology ‘B’ and also ‘B’ahead of
technology‘C’, then, logically (by transitivity),‘A’must be
ranked ahead of ‘C’ (and so the 1000Minds software
would not ask a question pertaining to this third pair-wise ranking). The number of questions answered by decision-makers depends on the number of dimensions and levels in the points system. The points system in Table 1, for example, requires decision-makers to answer about 40 questions involving trade-offs between two dimensions at-a-time. Based on the answers, the
1000Minds software uses mathematical methods
(explained in detail in [33]) to calculate the point values (reflecting the relative importance of the dimensions to decision-makers).
After each technology has been rated on the points system’s dimensions, the corresponding point values are
summed to get a ‘total score’ for each technology.
Equipped thus with a single value for the incremental-benefits variable for each technology, plus a value for each of the three other variables (compiled separately) included in the framework, the four variables are ready
to be combined in what we refer to as the ‘Value for
Money Chart’. This is presented in the next section.
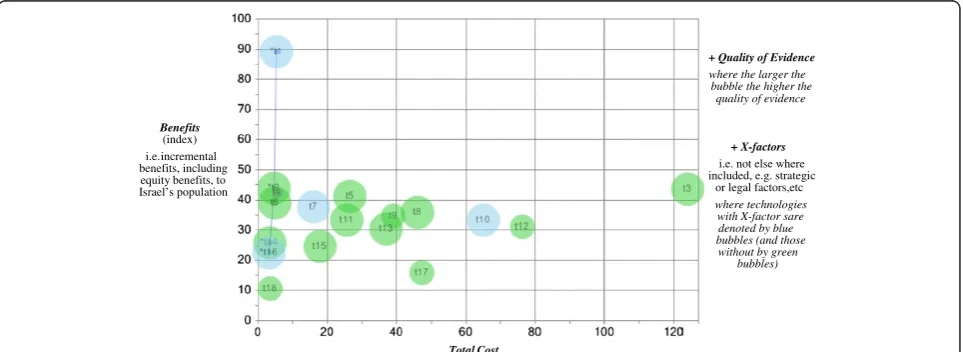
Results
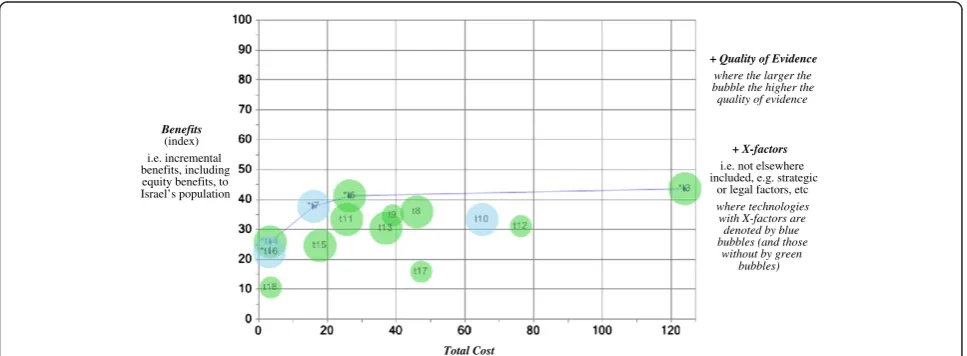
The four variables discussed above for each technology can be displayed in the Value for Money (VfM) Chart, as illustrated in Figure 2. Although the VfM Chart is cap-able of representing potentially any number of technolo-gies (limited only by the chart’s size), for simplicity and so that the chart can be easily read on a journal page, we
have restricted ourselves to 18 illustrative technologies.
The technologies’names corresponding to their labels in
Figure 2 and their underlying data, including their rat-ings on the illustrative points system (Table 1), are reported in Table 2.
Some of these technologies were chosen for inclusion here because of the Israeli public’s interest in them, and others because they represent a diverse range of charac-teristics. They are based on realistic data that were
pre-sented to or determined by the various Basket
Committees mostly over the period 2005-8.dEach
tech-nology’s‘performance’on each dimension, as well as the
quality of evidence, were determined by the first author (OG) from her understanding of the data and, ultim-ately, her judgment. Accordingly, it should be recognized that the 18 technologies are presented solely for illustra-tive purposes and should not be regarded as the same as actual technologies discussed by the Basket Committee (various years); and therefore it is not appropriate nor feasible to compare the Committee’s decisions with the illustrative ones presented here.
As can be seen in Figure 2, the vertical axis of the VfM Chart displays each technology’s total score (as explained
in the previous section), reflecting its‘incremental
bene-fits, including equity benebene-fits, to Israel’s population’ –as
produced here (for illustrative purposes) by applying the points system from our earlier study [9] (Table 1) to the
technologies’ ratings (Table 2). The horizontal axis
dis-plays each technology’s‘incremental total cost to Israel’s
health system’. The size of the bubble used to represent
each technology is in proportion to the ‘quality of
evidence’. Finally, a blue bubble (or lighter shade if
the chart is in black and white) indicates ‘any additional
‘X-factors’ not elsewhere included, such as strategic or
legal factors, etc.’
+ Quality of Evidence
where the larger the bubble the higher the
quality of evidence
+ X-factors
i.e. not else where included, e.g. strategic
or legal factors,etc where technologies
with X-factor sare denoted by blue bubbles (and those without by green
bubbles)
Benefits
(index) i.e. incremental benefits, including equity benefits, to Israel’s population
Total Cost
Figure 2Value for money chart, with 18 illustrative technologies (see Table 2 for their names).
Golan and HansenIsrael Journal of Health Policy Research2012,1:44 Page 6 of 14
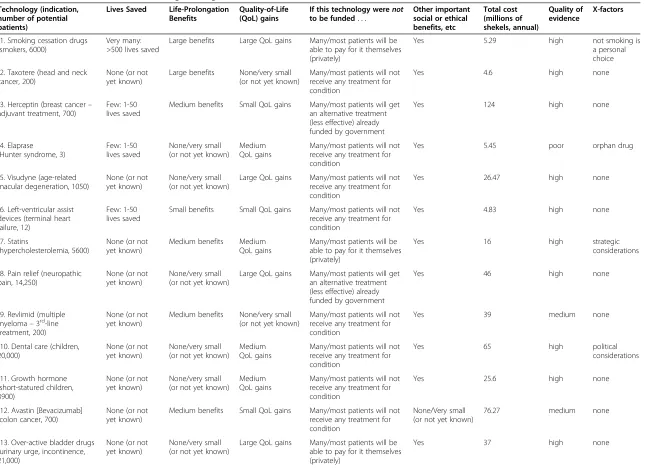
Table 2 Data for the 18 illustrative technologies in Figures 2 and 3
Technology (indication, number of potential patients)
Lives Saved Life-Prolongation Benefits
Quality-of-Life (QoL) gains
If this technology werenot to be funded. . .
Other important social or ethical benefits, etc Total cost (millions of shekels, annual) Quality of evidence X-factors
t1. Smoking cessation drugs (smokers, 6000)
Very many: >500 lives saved
Large benefits Large QoL gains Many/most patients will be able to pay for it themselves (privately)
Yes 5.29 high not smoking is
a personal choice
t2. Taxotere (head and neck cancer, 200)
None (or not yet known)
Large benefits None/very small (or not yet known)
Many/most patients will not receive any treatment for condition
Yes 4.6 high none
t3. Herceptin (breast cancer– adjuvant treatment, 700)
Few: 1-50 lives saved
Medium benefits Small QoL gains Many/most patients will get an alternative treatment (less effective) already funded by government
Yes 124 high none
t4. Elaprase (Hunter syndrome, 3)
Few: 1-50 lives saved
None/very small (or not yet known)
Medium QoL gains
Many/most patients will not receive any treatment for condition
Yes 5.45 poor orphan drug
t5. Visudyne (age-related macular degeneration, 1050)
None (or not yet known)
None/very small (or not yet known)
Large QoL gains Many/most patients will not receive any treatment for condition
Yes 26.47 high none
t6. Left-ventricular assist devices (terminal heart failure, 12)
Few: 1-50 lives saved
Small benefits Small QoL gains Many/most patients will not receive any treatment for condition
Yes 4.83 high none
t7. Statins
(hypercholesterolemia, 5600)
None (or not yet known)
Medium benefits Medium QoL gains
Many/most patients will be able to pay for it themselves (privately)
Yes 16 high strategic
considerations
t8. Pain relief (neuropathic pain, 14,250)
None (or not yet known)
None/very small (or not yet known)
Large QoL gains Many/most patients will get an alternative treatment (less effective) already funded by government
Yes 46 high none
t9. Revlimid (multiple myeloma–3rd-line treatment, 200)
None (or not yet known)
Medium benefits None/very small (or not yet known)
Many/most patients will not receive any treatment for condition
Yes 39 medium none
t10. Dental care (children, 20,000)
None (or not yet known)
None/very small (or not yet known)
Medium QoL gains
Many/most patients will not receive any treatment for condition
Yes 65 high political
considerations
t11. Growth hormone (short-statured children, 3900)
None (or not yet known)
None/very small (or not yet known)
Medium QoL gains
Many/most patients will not receive any treatment for condition
Yes 25.6 high none
t12. Avastin [Bevacizumab] (colon cancer, 700)
None (or not yet known)
Medium benefits Small QoL gains Many/most patients will not receive any treatment for condition
None/Very small (or not yet known)
76.27 medium none
t13. Over-active bladder drugs (urinary urge, incontinence, 21,000)
None (or not yet known)
None/very small (or not yet known)
Large QoL gains Many/most patients will be able to pay for it themselves (privately)
Yes 37 high none
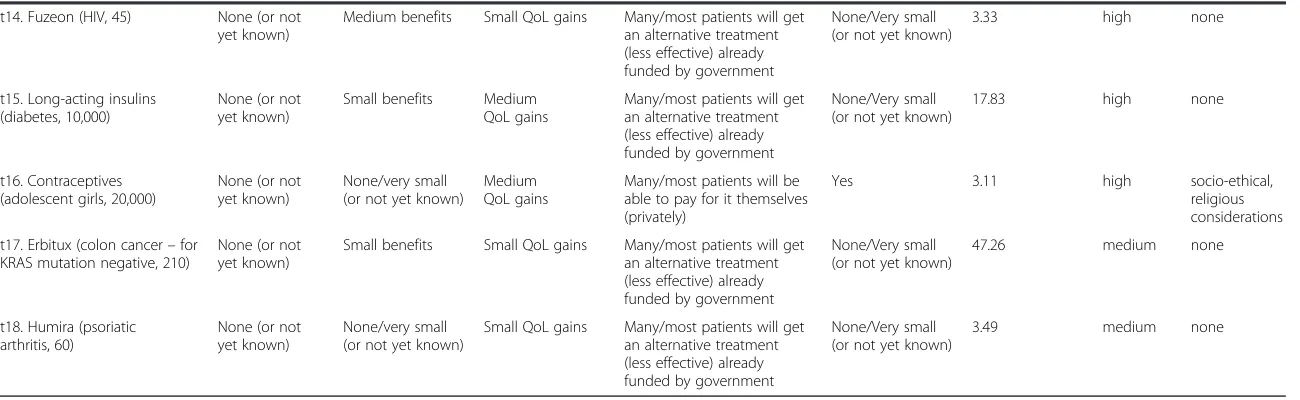
Table 2 Data for the 18 illustrative technologies in Figures 2 and 3(Continued)
t14. Fuzeon (HIV, 45) None (or not yet known)
Medium benefits Small QoL gains Many/most patients will get an alternative treatment (less effective) already funded by government
None/Very small (or not yet known)
3.33 high none
t15. Long-acting insulins (diabetes, 10,000)
None (or not yet known)
Small benefits Medium QoL gains
Many/most patients will get an alternative treatment (less effective) already funded by government
None/Very small (or not yet known)
17.83 high none
t16. Contraceptives (adolescent girls, 20,000)
None (or not yet known)
None/very small (or not yet known)
Medium QoL gains
Many/most patients will be able to pay for it themselves (privately)
Yes 3.11 high socio-ethical,
religious considerations
t17. Erbitux (colon cancer–for KRAS mutation negative, 210)
None (or not yet known)
Small benefits Small QoL gains Many/most patients will get an alternative treatment (less effective) already funded by government
None/Very small (or not yet known)
47.26 medium none
t18. Humira (psoriatic arthritis, 60)
None (or not yet known)
None/very small (or not yet known)
Small QoL gains Many/most patients will get an alternative treatment (less effective) already funded by government
None/Very small (or not yet known)
3.49 medium none
Golan
and
Hansen
Israel
Journal
of
Health
Policy
Research
2012,
1
:44
Page
8
o
f
1
4
http://ww
w.ijhpr.org/co
Which technologies are good value for money?
Decision-makers (e.g. the Basket Committee) should focus their attention first on the technologies in the VfM
Chart’s top-left quadrant – with high Benefits and low
Total Cost – while also being mindful of each
technol-ogy’sQuality of Evidenceand any X-factors. These
tech-nologies represent relatively good value for money. In
contrast, technologies in the bottom-right quadrant –
with low Benefits and highTotal Cost –represent poor
value for money.
Possible acceptable tradeoffs between theBenefits and
Total Costvariables on the chart’s axes are in a
nor-east-erly/sou-westerly direction, conditional on Quality of
Evidence and X-factors. In other words, higher Total
Costcan be compensated for by higher Benefits, all else
(i.e. Quality of Evidence and X-factors) being equal. In
this respect,‘best value’candidate technologies are
iden-tified by the (upward-sloping) frontier in the VfM Chart (see Figure 2 again and also Figure 3 later below). This
frontier, known as the ‘Pareto (efficiency) frontier’,
iden-tifies ‘dominant’ technologies in the sense that,
com-pared to them, no other technologies have both lower
Total Cost and higher Benefits. (In contrast, the further
away a technology is from the frontier in a sou-easterly direction, the lower is its value for money.)
The VfM Chart is useful for comparing
technolo-gies’ effectiveness, affordability and efficiency (i.e.
cost-effectiveness). That is, all else being equal, the closer a technology is to the vertical axis, the more affordable it
is in terms of having a lowerTotal Cost; the further away
a technology is from the horizontal axis, the more
effect-ive it is in terms of having higherBenefits. The steeper is
the ray that can be drawn from the chart’s origin to each
technology, the more‘efficient’the technology is in terms
of having a higherBenefits / Total Costratio.
Which technologies should be funded?
Prioritizing technologies involves the Basket Committee mulling over alternative affordable combinations of the technologies represented in the VfM Chart to arrive at
what the Committee considers to be the‘optimal
portfo-lio’ of technologies. In essence, the Committee should
aim to maximize the aggregate Benefits from the
tech-nologies to be added to the health basket subject to the
budget constraint and given the technologies’Total Cost,
Quality of Evidence and X-factors. This involves a
process of trial-and-error.eHowever, for some
technolo-gies it is likely to be relatively easy for the Committee to decide whether they should be added to the health bas-ket or not, whereas other technologies will require more deliberation.
For example, with reference to the illustrative tech-nologies displayed in the VfM Chart in Figure 2, it is easy to imagine that decision-makers would immediately select smoking cessation drugs (t1) and Taxotere (t2)
(for the technologies’names see Table 2). No other
tech-nologies are better (have higher Benefits) and these two
are amongst the cheapest available (lowest Total Costs)
– assuming X-factors for smoking cessation drugs do
not militate against this technology’s selection.
Conceiv-ably, the Committee might choose Elaprase (t4), despite
its poorQuality of Evidence, due to its highBenefits
rela-tive to Total Cost (arguably, this is consistent with the
practice of Israeli Basket Committees of selecting life-saving orphan drugs).
The next three technologies with the highest Benefits
are Herceptin (t3), Visudyne (t5) and left-ventricular as-sist devices (t6). However, Herceptin has only marginally
higherBenefits than these two other technologies but is
approximately 98 million and 119 million shekels more expensive respectively. Therefore, given these data, it
Benefits (index) i.e. incremental benefits, including equity benefits, to Israel’s population
Total Cost
+ X-factors i.e. not elsewhere included, e.g. strategic
or legal factors, etc
where technologies with X-factors are denoted by blue bubbles (and those
without by green bubbles) + Quality of Evidence
where the larger the bubble the higher the quality of evidence
Figure 3Value for money chart, after 4 technologies have been selected.
Golan and HansenIsrael Journal of Health Policy Research2012,1:44 Page 9 of 14
would be understandable if the Committee decided not to add Herceptin to the basket immediately but to re-consider it later (provided there is sufficient budget). With respect to choosing between Visudyne (t5) and left-ventricular assist devices (LVAD) (t6), it is easy to imagine decision-makers preferring LVAD (and adding it
to the basket) as it has only marginally lower Benefits
than Visudyne (t5) but is 21.6 million shekels cheaper. (It’s also worthwhile noting that LVAD was expected to save the lives of 12 patients facing imminent death, whereas Visudyne would reduce the risk of blindness for about 1000 people).
These first four additions to the basket (costing just 20.2 million shekels) would leave the Committee with
the ‘abridged’ VfM Chart in Figure 3. Clearly, the new
Pareto frontier – consisting of contraceptives (t16),
Fuzeon (t14), Statins (t7), Visudyne (t5) and Herceptin
(t3) – is closer to the diagonal than initially (Figure 2),
which means that for these technologies the Committee is likely to find thinking about acceptable tradeoffs
be-tween Benefits and Total Cost (as always, subject to
Quality of Evidence and X-factors) more challenging.
The Committee could decide to add all of these
tech-nologies or just some of them–for example, the
Com-mittee would again be confronted with deciding whether
or not to select Herceptin (t3) (still with the highest
Ben-efits but also the highest Total Cost by a considerable
margin). For the sake of keeping the exposition here simple, suppose that the Committee selected all five technologies on the new frontier (including Herceptin, and costing 172.9 million shekels in total). This decision
would result in another Pareto frontier (not shown) –
consisting of Humira (t18), long-acting insulins (t15), growth hormones (t11), Revlimid (t9), pain relief (t8). And so the prioritization process would continue, with the Committee performing its deliberations until the
budget is exhausted.f
Discussion
Most decision-makers charged with prioritizing health
technologies, including Israel’s Basket Committee,
already consider the four variables included in the VfM Chart, but, because of the complexity involved, typically not in such a systematic and transparent fashion. It is important to appreciate that our proposed framework is
not intended to replace decision-makers’ value
judg-ments in any way. On the contrary, the VfM Chart is intended to serve as a decision-support tool that is very
much based on decision-makers’value judgments.
This dependence on decision-makers’value judgments
can be appreciated by recognizing that, first of all, to
construct the VfM Chart decision-makers’ must reveal
their preferences about the relative importance of the dimensions comprising the points system for the
incremental-benefits variable (as explained earlier, by answering the pairwise-ranking questions). In addition, decision-makers need to rate each technology according to its performance on the points system’s dimensions. Naturally, such rating exercises can be difficult because of the uncertainties involved, and so decision makers are likely to need to deliberate. For example, with reference to Table 2 again, should the impact of growth hormone on the HRQoL of short-statured children be rated as a
‘medium’ or ‘large’gain? Is prolonging a cancer patient’s
life by 5 months a‘medium’,‘small’or perhaps even‘large’
benefit? Moreover, such uncertainties are magnified by the criticism that can be easily directed at these
perform-ance levels (‘small’, ‘medium’ and ‘large’): that they are
overly simplistic and not descriptive enough. For real-world applications the points system’s dimensions and levels would need to be refined for the prioritization exer-cise in hand.
Obviously, the total scores calculated for the
incremental-benefits variable of the affected technologies
are sensitive to how they are rated by decision-makers.g
Especially for new technologies, such uncertainties will almost always be compounded by deficiencies in the data available for forming judgments. Sensitivity analysis should be performed with respect to any controversial ratings to see what difference, if any, they make to the final decision about whether to add a technology to the basket or not. For each technology that looks like being rejected, and for which there is significant uncertainty surrounding any of its variables, decision-makers should
ask themselves: “What would it take for this technology
to be in contention (e.g. on or near the VfM Chart’s
Par-eto frontier), and how realistic is such a scenario?” The
VfM Chart enables such‘what-if’experiments to be
per-formed systematically.
The final respect in which the framework depends on
decision-makers’ value judgments concerns the
prioritization decisions themselves. As for all tools, how the VfM Chart is applied is at the discretion of
decision-makers. They–rather than the tool–are ultimately
re-sponsible for deciding which technologies are selected. The VfM Chart simply displays the main variables for consideration and makes explicit the potential tradeoffs between the variables on the chart’s axes, where higher
Total Costcan be compensated for by higherBenefits. It
is up to decision-makers to determine the appropriate
‘rate of exchange’ between Total Cost and Benefits and
also how to weigh the impact ofQuality of Evidenceand
X-factors,all of which depend on value judgments.
TheX-factors variable, in particular, serves as a
poten-tial‘over-ride’mechanism for enabling a particular
tech-nology to be prioritized ahead of others that are otherwise superior on the three other variables included in the VfM Chart. A well-known Israeli example is dental
Golan and HansenIsrael Journal of Health Policy Research2012,1:44 Page 10 of 14
care for children (similar to t10 in Table 2 and Figures 2 and 3), which was introduced to the 2010 Basket Com-mittee with a strict demand from the Deputy Health Minister, approved by the Cabinet, that it be added to the health basket, regardless any other considerations [40]. If decision-makers (or their political masters) choose to
invoke suchX-factors, they are, in effect, forced to
expli-citly explain why such a technology – with high Total
Costand/or lowBenefitsand/or poorQuality of Evidence
relative to other technologies–ought to be added to the
health basket in preference to others. The VfM Chart ensures such decisions are transparent (and auditable).
As mentioned in the Methods section, points systems have been widely used for diagnostic and treatment-based decision-making and for prioritizing patients for specific elective services. Somewhat surprisingly, points systems have not been so widely used for prioritizing technologies, though there appears to be increasing interest in doing so (e.g. see the references in [41]), in-cluding, for example, a recent report that argued for their greater use in the NHS [15]. One possible reason for this may be because, unlike diagnosing or prioritizing patients, prioritizing health technologies involves cost comparisons across technologies. Our proposed frame-work deals with this issue by including in the points sys-tem only dimensions related to the technologies’ incremental benefits, and then introducing their incre-mental costs to the prioritization exercise later when the
VfM Chart is created.h
By focusing on each technology at the aggregate level
– i.e. in terms of the effects of the overall intervention
involving the technology on Israel’s population and
health system respectively – the framework avoids the
problems associated with using Incremental Cost-Effectiveness Ratios (ICERs) to prioritize technologies. Allocating a budget across possible interventions in
re-verse order of the technologies’costs per QALY results
in the maximization of QALYs only if two conditions are satisfied: (1) that interventions are sufficiently divisible for the technologies to be purchased in incremental units, and (2) that interventions are subject to constant returns to scale (so that changing how much of a tech-nology is used affects the resulting health benefits by the same proportion) [42]. These two conditions seldom
hold [43] –in which case, ICERs convey nothing about
how affordable interventions are. Affordability is import-ant information when allocating a budget; for example, a technology with a very low cost per QALY might be
used to treat such a large number of people that itstotal
cost is unaffordable (e.g. potentially in excess of the budget). Stephen Birch and Amiram Gafni recommend an alternative conceptual approach to using ICERs based
on “determin[ing] whether in choosing to use some of
[the available budget] for one particular intervention, the
health gains produced by this intervention exceed the health gains that are foregone by not using the same
resources for all other possible interventions.” (p. 49)
[44]. “Because this involves the direct consideration of
opportunity costs, measured in terms of health benefits foregone, it takes the form of a (non-monetary)
cost-benefit analysis.” (p. 2099) [45]. The VfM Chart is
con-sistent with this conceptual approach.
As well as using the VfM Chart to represent poten-tially any number of technologies under consideration at a point of time (e.g. when the Basket Committee meets annually), technologies from the past (funded and/or not funded) could be super-imposed for comparison
pur-poses. The VfM Chart could also be used in a‘dynamic’
manner consistent with Program Budgeting and Mar-ginal Analysis [46]: as new technologies arise they could be introduced to the VfM Chart and considered for funding while, at the same time, old technologies are identified for decommissioning. Such a longitudinal focus would assist with achieving greater decision-making consistency over time.
Our proposed framework is compatible with the prioritization process currently followed by the Israeli Basket Committee, as summarized at the beginning of the article. In more detail here, this process begins with a discussion about each individual technology on its
own – specifically, its contribution to patients’ health
and society overall, independent of its cost. Technologies deemed deserving of further consideration proceed to the next stage where, after including cost data from the
‘Technical Sub-committee’, they are compared, subject
to the budget constraint [8]. This prioritization stage comprises two rounds: in the first round, technologies that are judged not to be worthwhile given the budget constraint are discarded; and in the second round, the Committee compares the remaining technologies in order to choose those that should be added to the health basket and that can be afforded.
The approach used to make the final prioritization deci-sions over the last few years is that each Committee
member nominates his or her‘top ten’technologies.
Tech-nologies nominated by a majority of members are written on the board in the meeting room. Other technologies nominated by fewer members are also written on the board and flagged with a question mark (indicating less support). The costs of all the technologies on the board are summed. If the total exceeds the budget, then in theory all technologies on the board are included for discussion with respect to being dropped until the budget is met; but in practice usually only the question-marked technologies are considered. The order in which technologies are dis-cussed by the Committee can be critical, as the inclusion of one technology, given the budget constraint, necessarily means that one or more later candidates will be excluded.
Golan and HansenIsrael Journal of Health Policy Research2012,1:44 Page 11 of 14
We believe that the VfM Chart would be a useful decision-support tool at both rounds of the prioritization
stage outlined above, especially the second round.i All
technologies that make it through to the prioritization stage could be represented in the VfM Chart, which could serve as the focal point to the Committee’s delib-erations. In addition, the VfM Chart could be used as a powerful communication device to explain to stake-holders, including the general public, in an obvious vis-ual fashion why particular technologies were prioritized over others. Such explanations might reduce feelings of injustice suffered by patients whose required
technolo-gies were not added to the health basket–to the extent,
potentially, that even law suits might be averted.j
Conclusion
The Value for Money Chart introduced in this article is an intuitively appealing decision-support tool for helping decision-makers to focus on the inherent tradeoffs involved in health technology prioritization. Such delib-erations can be performed in a systematic and transpar-ent fashion that can also be easily communicated to stakeholders, including the general public. The VfM Chart could be used by agencies like the Israeli Basket
Committee that have to perform the‘super-human’
mis-sion of deciding which technologies to fund–a mission
that must be performed each year, within a short period of time and under conditions of intense public interest and pressure.
The framework introduced here has not yet been ap-plied in a real-world health technology prioritization ex-ercise, but it is intended to be. An obvious area for future research is pilot-testing the VfM Chart using real
data, thereby testing the framework’s usefulness. Ideally,
this would involve working with the Basket Committee–
including refining the points system for technologies’
in-cremental benefits to accurately reflect the preferences of Committee members and/or their constituencies. Like-wise, the framework could be tested and applied by health technology prioritization agencies in other countries.
Endnotes a
In addition, specific technologies could be similarly flagged if decision-makers have concerns about the
reli-ability of the technologies’cost estimates (e.g. inflated or,
alternatively, unrealistically low). b
The sample comprised 61 Israelis – specifically, 44
professionals or researchers in healthcare or related fields (including 10 physicians and 7 health journalists), 5
representatives of patients’ organizations, and 12
mem-bers of the general public–plus 13 researchers from the
Joint Center of Bioethics in Toronto, Canada [9].
c
The 1000Minds software can be used to survey the preferences of large numbers of people; and so, if appro-priate, the preferences of Israeli patients and taxpayers could be captured.
d
Since then the data for several of the technologies –
ones re-submitted to the Committee – have changed.
The illustrative technology‘dental care’ (for children) is
based on data presented to the 2010 Basket Committee as well as media reports [40].
e
Although, in theory, this optimization problem is
similar to the classic ‘0-1 Knapsack Problem’ in
Opera-tions Research [47], it cannot be solved analytically using dynamic programming because of the need, potentially,
to recognizeX-factors–ofa prioriuncertain importance
– on a technology-by-technology basis, in addition to
the three other variables. f
The prioritization and budget-allocation process out-lined here can be supported by the 1000Minds software mentioned earlier, which continuously keeps track of the total costs of the selected and unselected technologies as well as the remaining (unallocated) budget.
gThe sensitivity of technologies’
total scores to meas-urement issues can be alleviated, at least in part, by
introducing ‘mid’ levels with interpolated point values
(i.e. between the main levels). h
In our earlier study [9], we experimented with
includ-ing theTotal Costvariable as a dimension in the points
system via a survey analogous to the pairwise-ranking exercise explained earlier in the present article. Feedback from respondents revealed that this rendered the pairwise-ranking questions highly ambiguous (for an ex-planation, see section 4.3 of [9]). We concluded,
there-fore, that it is better to recognizeTotal Costand Benefits
as separate variables (as is usual in Cost-Benefit Analysis
in general). Likewise, not including Quality of Evidence
and X-factorsin the points system used to construct the
Benefits variable is justified by the likelihood that their
relative importance to decision-makers is idiosyncratic to the particular technology considered (unlike health-related benefits, which are more generic).
i
Some decision-makers suggested in personal commu-nications with the authors that the VfM Chart would also be helpful for the health technology assessments performed by the Health Technologies Forum.
j
For example, a petition brought to The High Court of Justice by multiple myeloma patients against the Minis-ter of Health and others (including the Basket Commit-tee) challenged the 2009 Basket Committee not to add the drug Revlimid for multiple myeloma (similar to t9 in Table 2 and Figures 2 and 3) [48]. The petitioners claimed they were discriminated against relative to other patients, especially people suffering from over-active bladders for which the Committee added a technology (similar to t13 in Table 2 and Figures 2 and 3) to the
Golan and HansenIsrael Journal of Health Policy Research2012,1:44 Page 12 of 14
health basket. The petition was denied by the High Court of Justice which found that the Committee had not violated the law and nor had there been a failure to meet the standard of reasonableness in the Committee’s considerations and decisions. In our opinion, given that the Committee’s decision was justified, had the technolo-gies under consideration been displayed on the VfM Chart, the decision and its justification, as well as the need to choose between Revlimid and medication for over-active bladder (if this pairwise choice had actually been necessary) would have been clearer and more understandable to stakeholders.
Abbreviations
VfM: Value for Money; HRQoL: Health-related quality-of-life; QALY: Quality-Adjusted Life Year; PAPRIKA: Potentially All Pairwise RanKings of all possible Alternatives; NHS: National Health Service; ICERs: Incremental Cost-Effective Ratios.
Competing interests
The first author (OG) declares she has no conflicts of interest. The second author (PH) owns the 1000Minds software referred to in the article, which he co-invented with Franz Ombler. Via their company 1000Minds Ltd, PH and FO earn income from software licenses, but they also make the software available for free to unfunded academic users (to-date >180 researchers and students worldwide).
Authors’contributions
The authors conceived of the article and wrote it together. Both authors read and approved the final manuscript.
Authors’information
Both authors have extensive experience and expertise in various aspects of prioritization decision-making; OG is a bioethicist and PH is a health economist. They started working together to develop the framework outlined in the article in 2008 when PH spent a sabbatical at The Gertner Institute for Epidemiology & Health Policy Research, where OG is a senior researcher.
Acknowledgements
We are grateful to Mrs Nina Hakak for research assistance, to Prof Avi Shtub for introducing us to the‘0-1 Knapsack Problem’, and to the many academics and policy-makers associated with health technology
prioritization in Israel with whom we have had useful discussions, especially Prof Boleslaw Goldman for his guidance and support. Thanks also to three anonymous referees and the journal editors.
Author details
1Unit for Genetic Policy & Bioethics, The Gertner Institute for Epidemiology & Health Policy Research, Tel Hashomer, Israel.2Department of Economics, University of Otago, Dunedin, New Zealand.
Received: 11 December 2011 Accepted: 17 July 2012 Published: 26 November 2012
References
1. Rosen B, Merkur S:Israel: Health system review.Health Syst Transit2009, 11:1–226.
2. Yasour Beit-Or M:The medications basket: the big winners–elderly and children [Hebrew].Ynet Health News5 January 2011.
3. Greenberg D, Siebzehner MI, Pliskin JS:The process of updating the National List of Health Services in Israel: Is it legitimate? Is it fair? Int J Technol Assess2009,25:255–261.
4. Tamir O, Rabinovich M, Shani M:Year 2006 update of the Israel National List of Health Services.Isr Med Assoc J2006,8:595–600.
5. Israeli A, Chinitz D:Updating the basket of health services [Hebrew]. Harefuah2003,142:100–102. 159.
6. Chinitz D, Shalev C, Galai N, Israeli A:The second phase of priority setting. Israel’s basic basket of health services: the importance of being explicitly implicit.BMJ1998,317:1005–1007.
7. Shani S, Yahalom Z:The Israeli model for managing the national list of health services in an era of limited resources.Law Policy2002, 24:133–147.
8. Israeli Ministry of Health:The Procedure of Updating the Health Services Basket–February 2010. [Hebrew] Jerusalem:; 2011 [http://www.health.gov.il/ hozer/sal_noal181010.pdf].
9. Golan O, Hansen P, Kaplan G, Tal O:Health technology prioritization: which criteria for prioritizing new technologies and what are their relative weights?Health Policy2011,102:126–135.
10. Sabik LM, Lie RK:Priority setting in health care: lessons from the experiences of eight countries.Int J Equity Health2008,7:4. 11. Nord E:Balancing relevant criteria in allocating scarce life-saving
interventions.Am J Bioethics2010,10:56–58.
12. Kenny N, Joffres C:An ethical analysis of international health priority-setting.Health Care Anal2008,16:145–160.
13. Holm S:Goodbye to the simple solutions: the second stage of priority setting in health care.BMJ1998,317:1000–1007.
14. Hoedemaekers R, Dekkers W:Justice and solidarity in priority setting in health care.Health Care Anal2003,11:325–343.
15. Devlin N, Sussex J:Incorporating Multiple Criteria in HTA. Methods and Processes. OHE Report. London: Office of Health Economics; 2011. 16. Stafinski T, Menon D, Philippon DJ, McCabe C:Health technology funding
decision-making processes around the world: the same, yet different. PharmacoEconomics2011,29:475–495.
17. National Institute for Health and Clinical Excellence:Social Value Judgements. Principles for the Development of NICE Guidance. London; 2008.
18. Golan O:Health resources allocation–addition of new healthcare technologies to the Health Basket. InIsraeli Bioethics and Health Law. Edited by Siegal G.: forthcoming.
19. Culyer AJ, Bombard Y:An equity framework for health technology assessments.Med Decis Making2012,32:428–441.
20. Hastie R, Dawes RM:Rational Choice in an Uncertain World. The Psychology of Judgment and Decision Making. California: Sage Publications; 2010. 21. Medal.org Limited:Medal.org website.[http://www.medicalalgorithms.com]. 22. MacCormick AD, Collecutt WG, Parry BR:Prioritizing patients for elective
surgery: a systematic review.ANZ J Surgery2003,73:633–642. 23. Persad G, Wertheimer A, Emanuel EJ:Principles for allocation of scarce
medical interventions.Lancet2009,373:423–431.
24. Atkins D, Best D, Briss PA, Eccles M, Falck-Ytter Y, Flottorp S, Guyatt GH, Harbour RT, Haugh MC, Henry D, Hill S, Jaeschke R, Leng G, Liberati A, Magrini N, Mason J, Middleton P, Mrukowicz J, O’Connell D, Oxman AD, Phillips B, Schünemann HJ, Edejer TT, Varonen H, Vist GE, Williams JW Jr: Zaza S for the GRADE Working Group: Grading quality of evidence and strength of recommendations.BMJ2004,328:1490–1494.
25. Harris RP, Helfand M, Woolf SH, Lohr KN, Mulrow CD, Teutsch SM, Atkins D, for the Methods Work Group, U.S. Preventive Services Task Force:Current methods of the US Preventive Services Task Force: a review of the process.Am J Prev Med2001,20:21–35.
26. Treadwell JR, Tregear SJ, Reston JT, Turkelson CM:A system for rating the stability and strength of medical evidence.BMC Med Res Methodol2006, 6:52.
27. Akers J, Aguiar-Ibáñez R, Baba-Akbari Sari A, Beynon S, Booth A, Burch J, Chambers D, Craig D, Dalton J, Duffy S, Eastwood A, Fayter D, Fonseca T, Fox D, Glanville J, Golder S, Hempel S, Light K, McDaid C, Norman G, Pierce C, Phillips B, Rice S, Rithalia A, Rodgers M, Sharp F, Sowden A, Stewart L, Stock C, Trowman R, Wade R, Westwood M, Wilson P, Woolacott N, Worthy G, Wright K:Systematic Reviews: CRD’s Guidance for Undertaking Reviews in Health Care. York, UK: NHS Centre for Reviews and Dissemination, University of York; 2009.
28. Belton V, Stewart TJ:Multiple Criteria Decision Analysis: An Integrated Approach. Boston: Kluwer; 2002.
29. Buckshaw D:Decision analysis software survey. OR/MS Today. 2010. 37http://www.orms-today.org/surveys/das/das.html.
30. McFadden D:Conditional logit analysis of qualitative choice behavior. In
Frontiers in Econometrics. Edited by Zarembka P. New York: Academic Press; 1973.
31. Ryan M, Gerard K, Amaya-Amaya M (Eds):Using Discrete Choice Experiments to Value Health and Health Care. Amsterdam: Springer; 2008.
Golan and HansenIsrael Journal of Health Policy Research2012,1:44 Page 13 of 14
32. Drummond MF, Sculpher MJ, Torrance GW, O’Brien BJ, Stoddart GL:Methods for the Economic Evaluation of Health Care Programmes. Oxford: Oxford University Press; 2005.
33. Hansen P, Ombler F:A new method for scoring multi-attribute value models using pairwise rankings of alternatives.J Multi-Crit Decis Anal
2008,15:87–107.
34. 1000Minds software. http://www.1000minds.com
35. Taylor W, Laking G:Value for money–recasting the problem in terms of dynamic access prioritisation.Disabil Rehabil2010,32:1020–1027. 36. Hansen P, Hendry A, Naden R, Ombler F, Stewart R:A new process for
creating points systems for prioritising patients for elective health services.Clin Govern Int J2012,17:200–209.
37. Fitzgerald A, De Coster C, McMillan S, Naden R, Armstrong F, Barber A, Cunning L, Conner-Spady B, Hawker G, Lacaille D, Lane C, Mosher D, Rankin J, Sholter D, Noseworthy T:Relative urgency for referral from primary care to rheumatologists: the priority referral score.Arthrit Care Res2010, 63:231–239.
38. Neogi T, Aletaha D, Silman AJ, Naden RL, Felson DT, Aggarwal R, Bingham CO III, Birnbaum NS, Burmester GR, Bykerk VP, Cohen MD, Combe B, Costenbader KH, Dougados M, Emery P, Ferraccioli G, Hazes JMW, Hobbs K, Huizinga TWJ, Kavanaugh A, Kay J, Khanna D, Kvien TK, Laing T, Liao K, Mease P, Ménard HA, Moreland LW, Nair R, Pincus T,et al:The 2010 American College of Rheumatology/European League Against Rheumatism classification criteria for rheumatoid arthritis: Phase 2 methodological report.Arthritis Rheum2010,62:2582–2591. 39. Taylor WJ, Singh JA, Saag KG, Dalbeth D, MacDonald PA, Edwards NL,
Simon LS, Stamp LK, Neogi T, Gaffo AL, Khanna PP, Becker MA, Schumacher HR Jr:Bringing it all together: a novel approach to the development of response criteria for chronic gout clinical trials.J Rheumatol2011, 38:1467–1470.
40. Even D:Israel to fund dental care for kids at expense of other treatments.Haaretz2009, www.haaretz.com/print-edition/news/israel-to-fund-dental-care-for-kids-at-expense-of-other-treatments-1.2140.
41. Tony M, Wagner M, Khoury H, Rindress D, Papastavros T, Oh P, Goetghebeur MM:Bridging health technology assessment (HTA) with multicriteria decision analyses (MCDA): field testing of the EVIDEM framework for coverage decisions by a public payer in Canada.BMC Health Serv Res
2011,11:329. doi:10.1186/1472-6963-11-329.
42. Weinstein M, Zeckhauser R:Critical ratios and efficient allocation.J Public Econ1973,2:147–157.
43. Birch S, Gafni A:Cost effectiveness/utility analysis. Do current decision rules lead us to where we want to be?J Health Econ1992,11:279–296. 44. Birch S, Gafni A:The biggest bang for the buck or bigger bucks for the bang: the fallacy of the cost-effectiveness threshold.J Health Serv Res Policy2006,11:46–51.
45. Birch S, Gafni A:Incremental cost-effectiveness ratios (ICERs): the silence of the lambda.Soc Sci Med2006,62:2091–2100.
46. Mitton C, Donaldson C:Priority Setting Toolkit: A Guide to the Use of Economics in Healthcare Decision Making. London: BMJ Books; 2004. 47. Freville A:The multidimensional 0-1 knapsack problem: an overview.Eur
J Oper Res2004,155:1–21.
48. HCJ 434/09:Davidov v.: The Minister of Health; 2009 [Hebrew] www.nevo. co.il/psika_word/elyon/09004340-w09.doc.
doi:10.1186/2045-4015-1-44
Cite this article as:Golan and Hansen:Which health technologies should be funded? A prioritization framework based explicitly on value for money.Israel Journal of Health Policy Research20121:44.
Submit your next manuscript to BioMed Central and take full advantage of:
• Convenient online submission
• Thorough peer review
• No space constraints or color figure charges
• Immediate publication on acceptance
• Inclusion in PubMed, CAS, Scopus and Google Scholar
• Research which is freely available for redistribution
Submit your manuscript at www.biomedcentral.com/submit
Golan and HansenIsrael Journal of Health Policy Research2012,1:44 Page 14 of 14