O R I G I N A L A R T I C L E
Open Access
Modelling the effect of different
agricultural practices on stream nitrogen
load in central Germany
Seifeddine Jomaa
1,2*, Sanyuan Jiang
3, Daniela Thraen
2,4and Michael Rode
1Abstract
Background:Understanding the response of nitrogen fluxes to changes in land use and agricultural practices is crucial for improving the instream water quality prediction. In central Germany, the expansion of bioenergy crops during the last decade led to an increase in fertiliser application rates. The purpose of this study is to investigate the effect of agricultural management changes on the stream nitrogen load of a drinking water reservoir catchment (Weida, 99.5 km2) using a hydrological water quality model.
Methods:The semi-distributed hydrological water quality model—the HYdrological Predictions for the Environment (HYPE)—was calibrated and validated successfully for discharge and nitrate-N concentrations during the period 1997–2003 (the lowest discharge Nash-Sutcliffe efficiency (NSE) was 0.78). Subsequently, stream nitrogen load of six different land use scenarios and their associated agricultural practice changes were compared to the baseline simulations of the period 2006–2009. Some of these scenarios were designed considering the increased cultivation of bioenergy crops.
Results:Results revealed that an increase in mineral fertiliser by 20 % for all crops augmented an increase of monthly stream nitrogen loads in the range of 2–6 % compared to the baseline simulations. Also, it was found that stream nitrogen load increased in scenarios where all or some crop areas were converted to maize and rape, which are the established bioenergy crops in Germany. The increase of nitrogen load resulting from these scenarios differed in terms of magnitude and their temporal patterns, reflecting the importance of timing, the amount of fertiliser applications, and harvesting periods. However, results showed that nitrogen load was reduced in situations when only organic farming or summer barley was used and when rape and maize cropping areas were converted to winter wheat. Conclusions:In this intensively used agricultural catchment, the simulated stream nitrate-N loads quickly responded to fertiliser application changes (increase/decrease). This rapid response could be explained by short residence time of the interflow and baseflow runoff components because of the hardrock geological properties of the catchment.
Keywords:HYPE model, Stream nitrogen load, Nitrate-N (NO3-N), Bioenergy, Land use change, Agricultural practices
Background
Bioenergy plants can play an important role in fulfilling the world’s increasing energy demand, by mitigating cli-mate change—mainly through the reduction of green-house gas (GHG) emissions—improving socio-economic
equity and preserving the biodiversity [1–3]. During the last decades, Germany has set the goal of adopting a modern, environment-friendly and sustainable supply of energy by expanding renewable energy [4]. This initiative is integrated with that of the European Union (EU), which, by 2020, aims to lower the GHG emissions and energy consumption by 20 % and also aims to cover 20 % of energy needs by using renewable energy [4, 5]. Within this framework, the member states of the EU have defined their own national targets and strategies. Among these, Germany is determined to increase the * Correspondence:[email protected]
1Department of Aquatic Ecosystem Analysis and Management, Helmholtz
Centre for Environmental Research—UFZ, Brueckstrasse 3a, 39114 Magdeburg, Germany
2Department of Bioenergy, Helmholtz Centre for Environmental
Research—UFZ, Permoserstrasse 15, 04318 Leipzig, Germany Full list of author information is available at the end of the article
share of its energy from renewable resources to achieve 18 % [6] and consequently reduce the GHG emissions by at least 40 %, by 2020, as compared to its use in 1990 [4]. In Germany, bioenergy represents the greatest con-tribution to all regenerative energy sources (about 66 % in 2012, where energy crops supply only a minor share of it) and will continue playing an essential role in future energy supply as well. However, to fulfil the increasing energy demands, sustainability is a key factor in develop-ing an appropriate national bioenergy industry, especially concerning the ability to produce enough biomass with-out environmental decline [7, 8].
The impact of bioenergy practices on water resources currently involves the conversion of agricultural land, originally used for food production, to grow bioenergy crops. In Germany, arable land that has been converted to grow bioenergy crops is about 21 % in 2012, and this share has been projected to achieve ranges of 24–29 % and 27–34 % by 2020 and 2030, respectively [9]. For in-stance, the area of land cultivated with maize (Zea mays)—which is well known as the best actual biogas feedstock—has increased considerably over the recent years in Germany [10], and it ranks as the third import-ant crop [11]. Agriculture is responsible for the largest contribution of non-point nitrogen source pollution in Germany [12, 13]. For the continued cultivation of bioe-nergy crops, feedstock production will require increased fertiliser input, which may have environmental implica-tions [14, 15]. For example, maize requires more fertili-sers than other crops [16], even though it can use the mineral and organic fertiliser effectively [17]. The effects of bioenergy crops on water quality are either positive or negative, and their magnitude depends on the local and regional factors, such as types of land use, topography, soils, climatic conditions, irrigation and agricultural management [18–20]. For instance, a study of the im-pact of switching a million hectares of pastures and hay lands to energy crops (mainly switchgrass and corn sto-ver) on the water quality in the Upper Mississippi River showed an ambivalent effect [19]. The energy crops significantly increased the suspended sediment and its associated instream total phosphorus, while it decreased the nitrate loads. This was attributed in part to the nitrogen uptake from the soil by the improved energy crops. Also, this was explained by the decreased nitrogen transport and reduction of denitrification losses because of the reduced flow and soil moisture, respectively [19]. However, the conversation of pastures to row crops (i.e. maize) increased the eroded suspended sediment, espe-cially after crop harvest, which in turn resulted in high instream phosphorus loading. Therefore, it was impera-tive to evaluate the agriculture land use changes result-ing from these bioenergy strategies and its effect on the regional water quality, especially in a region like central
Germany, an area where the land use was agriculture-dominant and had experienced increased biofuel pro-duction during the previous years.
Methods
Study areas
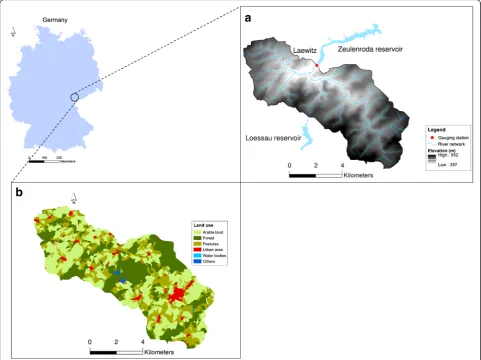
The selected catchment area for this study is Weida (99.5 km2), which is one small tributary of the Elbe river basin and is located in Thuringian state, in Germany (Fig. 1). The dominating land use classes of the Weida catchment area are arable land (40 %), forest (29 %) and pastures (26 %), which are all located in a low-mountain range (elevation between 357 and 552 m). Considering the whole catchment area, no clear spatial pattern of dominant land use can be observed; rather, the whole river basin is characterised by a mixture of the three most dominant land use classes (Fig. 1). The Weida river basin has one gauging station at the catchment outlet (Laewitz, Fig. 1), where discharge and nitrate-N concen-trations are measured. The Weida catchment feeds into the Zeulenroda and Weida drinking water reservoirs [35, 36]. These reservoirs are part of the Thuringia remote water supply system, which have also received variable
flow from the Loessau reservoir during the period 1994– 2004. It is located outside of the Weida catchment area (Fig. 1). The geology of Weida is dominated by clay, schists and eruptive rocks, where most of these rocks have low permeability [36]. This geological feature induces the quick flow to be the dominant runoff component in the Weida catchment. It has been reported that the bedrock range has developed from shallow rankers to well-developed cambisols and fluvisols in the stream valleys [35]. In this catchment area, sandy loam and silty loam are the most dominant soil classes (Table 1). In this study, five precipitation stations have been considered, where the mean annual precipitation rate is about 640 mm based on the measurement during the period 1988–2004. The mean annual temperature is about 7 °C in the Weida catchment. The long-term mean discharge at the outlet Laewitz gauging station is about 0.72 m3 s−1. In this catchment, nutrient inputs from agricultural land represent the main instream eutrophication sources. The dominant crops are
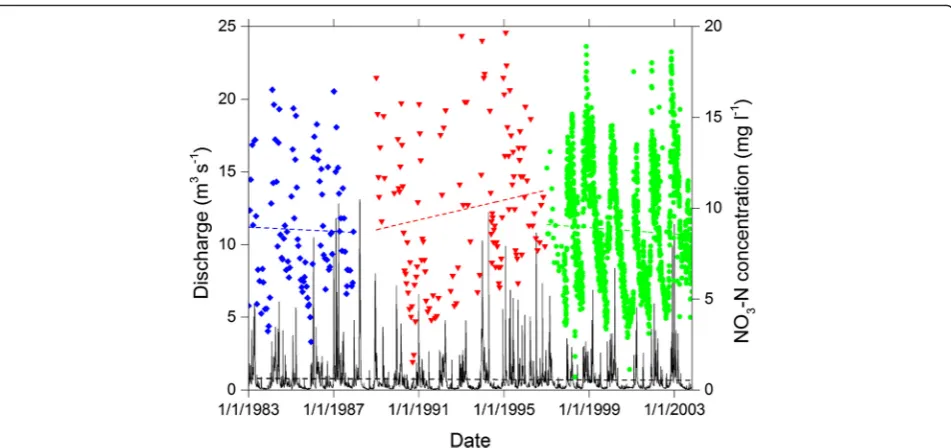
winter wheat, winter and summer barley, rape, maize and grassland. The average fertiliser application rates (organic and mineral) are listed in Table 2 [35]. In the Weida catchment, both discharge and nitrate-N concentration data are characterised by high seasonal variability, where higher values occur during the wet period (October–April) and lower values are observed during the dry period (May–September). The mean instream nitrate-N concentrations are 8.80, 9.93 and 8.76 mg l−1 for the periods 1983–1987, 1989–1996 and 1997–2003, respectively.
For model application in the Weida catchment, the pe-riods 1997–2003 and 2006–2009 were considered for model calibration and validation of discharge and nitrate-N concentrations. Measured daily discharge and daily (1996–2003) and weekly to bi-weekly (2006–2009) nitrate-N concentrations at the Laewitz gauging station were used for modelling purposes.
As mentioned above, the agriculture land represents about 66 % of the Weida catchment affecting the
instream water quality and in consequence the water qual-ity of the Weida-Zeulenroda-Loessau reservoir (Fig. 1). The historical discharge and nitrate-N concentration mea-surements during the period 1983–2003, at the Laewitz gauging station, show that the instream nitrogen concen-trations have increased after the reunification of Germany in 1990 compared to the previous periods (Fig. 2). How-ever, no clear trend has been observed for discharge dur-ing the entire period of 1983–2003 (black dashed line, Fig. 2). Nevertheless, at least three different stages can be easily distinguished for the instream nitrate-N tions. Constant to slightly reduced nitrate-N concentra-tions have been observed during the interval 1983–1987, with an average concentration of 8.80 mg l−1(blue dashed line, Fig. 2). An increase in concentration, however, has been measured for the period 1989–1996, with an average concentration of 9.93 mg l−1(red dashed line, Fig. 2). This was mainly explained by the rapid increase of fertiliser ap-plication to improve the crop yield. Subsequently, a con-stant phase appears again with an average concentration of about 8.91 mg l−1during the period 1997–2003 (green dashed line, Fig. 2). This can be explained by the adopted catchment management strategy during this period as detailed in Fig. 2. There are no accurate mea-surements in terms of fertiliser rates during the period 1990–1997, but it has been reported that fertiliser ap-plication had been increased, at least by 20 %, com-pared to the period 1983–1989.
In order to reduce the impact of diffuse nutrient leach-ing from the farmland in the reservoir, in 1997, the Thuringian Reservoir Administration (TTV) developed a catchment management strategy with the farmers. This consisted of encouraging the farmers to limit fertiliser application in their individual fields, which in turn would reduce instream nitrogen concentration. This procedure comprised of land use restrictions between the farmers and the TTV, which was based on legal rules and individual agreements. On the other hand, these land use restrictions were compensated financially by using field-specific measures [37]. Only a limited budget was available for compensation payments, and the TTV was therefore interested in optimising this agricultural management strategy. Thus, the water authority (TTV) intended to impose restrictions only where it was neces-sary and oversee whether the farmers were really keep-ing in line with their individual contracts. Therefore, the TTV supervised land use restrictions in the Weida catchment during the period 1997–2009 using the fol-lowing actions:
◦Recording the land use management of the individual fields
◦Inspecting the nitrogen application (amount and timing) of each individual field
Table 1Characteristics of the Weida catchment Weida
Area (km2) 99.5
Elevation (m a.s.l) 357–552
Land use
Arable land (%) 40.0
Forest (%) 29.0
Pastures (%) 26.0
Urban (%) 5.0
Population density 80
Geology (–) Clay schist and eruptive rocks
Soil (–) Sandy loam and silt loam
Main temperature (°C) 7
Mean annual precipitation (mm year−1) 640
Mean discharge (m3s−1) 0.72a
Mean specific discharge (l s−1km2) 7.24
Mean NO3˗N concentration (mg l−1) 8.81b a
Period considered is 1975–2004 b
Period considered is 1997–2003
Table 2The crop share of agricultural land area (%) and their annual nitrogen-fertiliser amount (kg N ha−1year−1) used during the baseline simulation
Crops Share (%) Organic N Mineral N Total N
Grassland 21 69.2 36.0 105.2
Winter wheat 25 46.3 130.5 176.8
Rape 19 58.4 145.8 204.2
Winter barley 13 48.6 125.0 173.6
Summer barley 12 35.4 62.1 97.5
◦High-resolution measurement of the nitrate-N concentrations and flow rate at the main inflow of the Zeulenroda reservoir (Laewitz gauging station)
Modelling approach
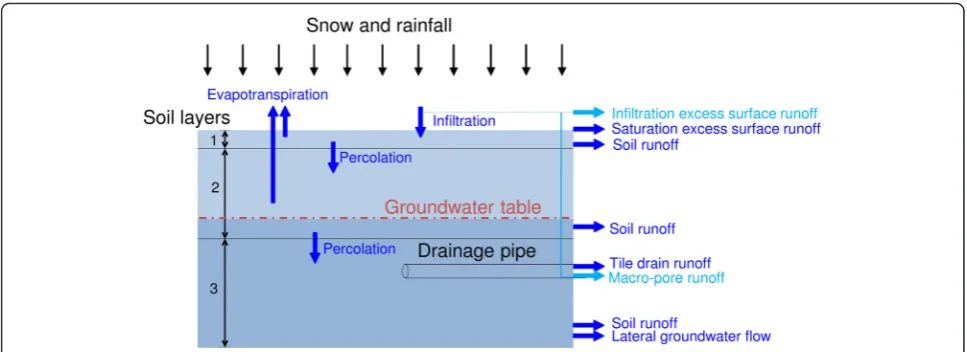
The continuous, semi-distributed and process-based hydrological water quality HYPE model has been used for this study. The HYPE model has been presented in details elsewhere (e.g. [28, 30]), so here, only a summary is given. The HYPE model has been developed based on the previous HBV-NP model [38, 39]. First, the model delineates the whole catchment into sub-basin systems based on the digital elevation model and stream net-work. Second, each sub-basin is divided into different soil-land use combinations (SLCs) by the overlapping soil and land use maps. Each SLC corresponds to a unique hydrological response unit (HRU). Each SLC is defined as a percentage of the sub-basin area and is not coupled with the geographical location. Different vegeta-tion types, such as forest and crop area, are simulated as separate land uses. In the HYPE model, the soil can be divided into a maximum of three layers, which can be specified with different thicknesses (Fig. 3). The model parameters are soil or land use-dependent, even as some model parameters are assumed to be general parameters for the whole catchment. Simulations start from a stand-ard initial state and a warming up period of typically 1 year, which is excluded from the model evaluation. The HYPE model simulates streamflow and nutrient concentrations in the water, such as inorganic and or-ganic nitrogen (IN and ON, respectively) and dissolved
and particulate phosphorus (SP and PP, respectively). In addition, it can compute the total nitrogen (TN) and total phosphorus (TP) as the sum of the relevant frac-tions. The dissolved organic carbon (DOC) and other nitrogen and phosphorus factions (e.g. humusN and humusP) can be also simulated within the soil, but the runoff leaving the soil contains only the nutrient frac-tions mentioned above. Conservative tracers can also be modelled. A more detailed description of the hydrologic and nitrogen processes of the HYPE can be found else-where [28, 30].
Model setup in the Weida catchment
The HYPE model (version 3.5.3) was set up for dis-charge and nitrate-N simulations at the Weida gauging station, at Laewitz, for the periods 1997–2003 and 2006–2009. The Weida catchment was divided into 37 sub-basins, and 16 SLCs were defined according to the model setup. Within each sub-basin, the areas with simi-lar land use and soil type were grouped together into a single SLC and the different SLCs within a sub-basin were not spatially distributed.
First, the HYPE model was calibrated for the period 1997–1999, and subsequently, it was validated for the periods 2000–2003 and 2006–2009. One year (1996) of warming up of the model was utilised, which was ex-cluded from the model evaluation. After validation of the model, the effects of different land use changes and agricultural management practices on the in-stream water quality were tested, using the appropri-ate scenarios.
The HYPE model parameters are general or coupled with soil type or land use. In addition, the model param-eters are connected to the physiographical characteris-tics of the catchment area and are not dependent on the division into sub-basins [28]. This feature was con-sidered in the development of the HYPE model to improve its transferability and increase its applicability in ungauged basins.
In order to minimise the equifinality problem during the calibration phase, only the most sensitive model pa-rameters have been optimised. The parameter identifica-tion procedure follows three steps. First, a manual sensitivity analysis is utilised for the identification of model parameters using a one-factor-at-a-time approach (OFAT) [31]. At this stage, the initial parameter values are estimated based on their physical meanings, the literature review of former model applications and the gained knowledge from the Weida catchment. Finally, the sensitive parameters obtained during the previous stage are optimised using the Parameter ESTimation (PEST) tool. In this step, reasonable initial guesses and ranges are defined by referring to the parameter settings in the applications of early versions of the HYPE model applications [28–31] and results from iterative manual calibrations. Detailed descriptions of parameter sensitiv-ity analyses and their uncertainty have been described elsewhere (e.g. [29, 31]).
Model evaluation
To evaluate the model performance, both statistical and graphical techniques were used as recommended in the literature (e.g. [40]). One of the quantitative statistical parameters chosen for evaluation of the model was the Nash-Sutcliffe [41] efficiency (NSE). The NSE reflected the capability of the model to represent the dynamic be-haviour of the measured parameter and quantified the relative magnitude of the residual variance compared to
the measured data variance. For testing the reasonability representation of the water and matter flux (loads) bal-ance by the HYPE model, another statistical parameter was used, which was the percentage bias (PBIAS). The NSE and PBIAS were determined using the following equations:
NSE¼1− Xn
i¼1
Yobsi −Ysimi
2
Xn
i¼1
Yobsi −Yobs
2; ð1Þ
PBIAS¼
Xn
i¼1
Ysimi −Yobsi
100 Xn
i¼1
Yobsi
; ð2Þ
where Ysimi and Yobsi are theith simulated and observed discharge, respectively; Ysim and Yobs are the mean values of the simulated and observed discharges, re-spectively; andnis the total number of observations.
The NSE varies between infinity and 1, with NSE = 1 being the optimal value. The optimal value of PBIAS is 0 (e.g. the water balance is 100 % captured). Low PBIAS in absolute values indicate accurate model simulation. Positive values indicate model overestimation bias, and negative values indicate model underestimation bias.
Baseline and scenario development
To investigate the effect of land use and crop changes on nitrogen instream load in the period 2006–2009, dif-ferent agricultural practice scenarios were designed. Some of these scenarios were developed considering the increase in bioenergy crops in the region, based on suit-ability and practicality. The definition of these scenarios was carried out in close collaboration with stakeholders and agricultural agencies to ensure a high degree of ac-ceptance by the farmers. The projected scenarios also covered a wide range of realistic and site-specific agri-cultural management practices that could increase or re-duce the nitrogen loads, as detailed a little further in the text. For consistent comparison between the different scenarios, each scenario was compared to the baseline simulations, which were the model predictions of the real situation during the considered period.
For the baseline simulation, the agricultural manage-ment practices that occurred in the period 2006–2009 were simulated by the HYPE model, using the administra-tive information derived from a survey conducted by the drinking water reservoir authority. For instance, the min-eral and organic fertiliser amounts and their correspond-ing application timcorrespond-ings were adjusted as inputs in the model based on the measured values obtained from the farmers as per the agreement with the TTV authority, as explained above. The predicted nitrate-N loads obtained from the baseline simulations were compared to six sce-narios. In the first scenario (denoted as S1), the fertiliser application for all crops was increased by 20 %. This sce-nario was designed to evaluate the nitrogen loads without the agricultural catchment management strategy, which was developed in 1997 by the TTV to reduce the instream nitrogen concentration that was observed during 1989– 1996, after the reunification of Germany. In other words, the S1 scenario was suggested to observe as to what extent the fertiliser restriction initiative could affect the nitrogen loads. Another scenario was developed based on the as-sumption that only organic farming is applied (no mineral fertiliser). This scenario, denoted as S2, was developed to answer the question—to what extent could the Zeulenroda drinking water reservoir be protected when only organic farming was applied to the entire agricultural lands? The third scenario (S3) was developed based on the assump-tion that all agricultural areas were converted to maize, which was well known as one of the biogas feedstock for bioenergy production. Also, the conversion of all crops to summer barley was considered as scenario 4 (S4). In scenario 5 (S5), the crop areas that were origin-ally occupied by rape and maize were converted to win-ter wheat. Here, it is worth mentioning that barley and winter wheat were known as two crops for bioethanol production. In the last scenario, the winter wheat and maize crop areas were converted to rape (S6), which was known as a biodiesel crop.
The comparison between each scenario and baseline predictions was conducted in terms of nitrate-N loads in monthly time steps. First, the daily nitrate-N load was cal-culated by multiplying the measured/simulated NO3-N
concentration with its corresponding accumulated daily discharge. Next, the measured monthly load (L) was estimated using the following interpolation method (equation 3), with continuous discharge measurements and regular sampling of nitrate-N concentrations [42]:
L¼ KX
n
i¼1
CiQi ð Þ
Xn
i¼1
Qi
Qr
; ð3Þ
whereKis a conversion factor accounting for the period of load estimation and measurement units, Ci is sample concentration, Qi is the flow at sample time and Qr is the mean flow for the period of interest (derived from a continuous flow record).
Results and discussion
Discharge simulations
dominant sandy loam soil (rrcs1), the maximum velocity in the stream channel (rivvel), the runoff coefficient for re-gional groundwater flow (rcgrw) and the decrease of evapotranspiration with the soil depth (epotdist). Similar controlling discharge simulation parameters were found in a previous study conducted in the meso-scale Selke catchment (463 km2), located in Sachsen-Anhalt state
(Germany), using the same HYPE model [31]. How-ever, the best optimised values differed between both catchments. This discrepancy in terms of best opti-mised parameters could be explained by the differ-ence in the climate forcing data, topographical and physiographical characteristics between the two catch-ment areas.
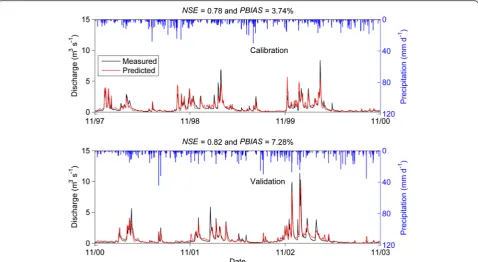
Fig. 4Measured and predicted discharge at the Laewitz gauging station for the calibration (1997–2000) and validation (2000–2003) periods. The HYPE model could reproduce significantly well the dynamical behaviour of the measured discharge (lowest NSE = 0.78). Also, the water balance was well captured by the model during the whole simulation periods (with highest PBIAS of about 7.28 %)
Table 3The most sensitive hydrological parameters, their physical meanings and their optimised values of the HYPE model for discharge and nitrate-N simulations
Parameter Physical meaning Sensitivity
rank Initial range
Optimized value cevp
Arable land Potential evapotranspiration rate (mmd °C 1 0.01 1.50 0.1038
rrcs1
Sand loamy Soil runoff coefficient for the uppermost soil layer (d 2 0.001 1 0.0400
rivvel Maximum velocity in the stream channel (ms 3 0.001 1 0.0560
rcgrw Runoff coefficient for regional groundwater flow (d 4 0.0001 0.1 0.0400
epotdist Decrease of evapotranspiration with soil depth (m 5 1 10 5.4169
denitr Denitrification rate in soil (d ) 1 0.001 0.1 0.0727
uptsoil1 Arable land Forest Grassland
Fraction of nutrient uptake in the uppermost soil layer ( ) 2
0.001 1.0 0.001 1.0 0.001 1.0
0.8000 0.8000 0.5000
fertdays Number of days that fertiliser applications occur counting from the first
application and forward using the same amount every day ( ) 3 10 150 60
denitw Parameter for the denitrification in water (kgm2d 4 1×10⁶ 0.1 1×10
wprod Production/decay of N in water (kgm–3 d–1) 5 0.0001 0.1 0.0670
1 ) –
1 ) – 1
) – 1 –
1 –
1 ) –
1 ) –
1 ) –
– –6
−
− −
− − −
− − − −
− −
−
−
Nitrate-N simulations
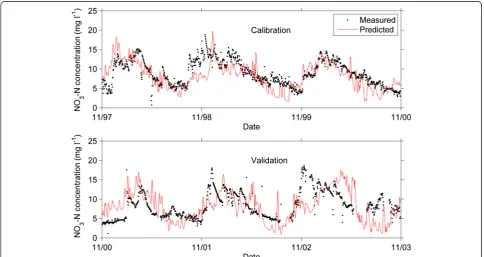
The HYPE model could reproduce the measured nitrate-N concentrations for the calibration and validation periods in a good manner (Fig. 5). The model could represent the dynamic behaviour as well as the order of magnitude of the measured nitrate-N concentrations. Also, the seasonal stream nitrogen concentration pattern, which was re-flected by an increase in winter followed by a decrease in summer, was reproduced well by the model. The most sensitive nitrate-N-related parameters were the denitrifica-tion rate in soil (denitr) and the fraction of nutrient uptake in the uppermost soil layer (uptsoil1) of the three domin-ant land use classes (i.e. arable land, forest and pastures). It is known that for the biogeochemical processes, denitrifi-cation and plant uptake are low in winter and high in sum-mer following the seasonal temperature patterns. The lower nitrate-N concentrations during low-flow conditions (in summer) are because of the lower nitrogen transport capacity and high retention (e.g. denitrification), and higher plant uptake because of the high temperature [31]. These findings reflect the capability of the HYPE model to represent the internal nitrogen processes and their dy-namic variations controlled by the climate and flow condi-tions. The rest of the sensitive parameters related to nitrogen processes are listed in Table 3.
Nitrogen load simulations
As discussed above, the HYPE model showed good cap-ability to reproduce the measured discharge and
nitrate-N concentrations during the calibration and validation periods (Figs. 4 and 5), resulting in good estimations of daily NO3-N loads (Fig. 6). The measured daily NO3-N
loads were reproduced well by the model during both calibration and validation periods (NSE = 0.64 and 0.67 for calibration and validations periods, respectively). The nitrate-N daily loads were slightly underestimated for the calibration phase (1997–2000), which was reflected by a PBIAS =−4.67 %. This under-prediction mainly oc-curred during the winter of year 1999, where some daily nitrate-N load peaks were under-predicted, which was probably because of the underestimation of peak flow during the same period (Fig. 4). During the validation period, however, the daily nitrate-N loads were overesti-mated (PBIAS = 8.12 %). This was mainly because of the overestimation of the low-flow conditions (e.g. recession curves of some events during the winter of 2003). The inconsistencies between simulated daily NO3-N loads
and their corresponding measured values were mainly attributed to the mismatches between the observed and predicted discharges, reflecting the importance of good hydrological simulation for representation of nitrate-N loads [31].
The results showed that by using a multi-objective calibration approach, 95 % of the posterior uncertainty intervals of the most sensitive hydrological parameters decreased compared to stepwise calibration (results not presented here), reflecting the usefulness of multi-objective calibration to improve hydrological parameter
identification. Additionally, a predictive analysis was implemented for discharge and nitrate-N concentration simulations using PEST [43] to investigate the effect of parameter non-uniqueness. Parameter uncertainty ana-lysis did not result in large predictive uncertainty, especially for discharge simulation (unpublished data) compared to nitrate-N concentration. However, it has to be noted that PEST is a local search algorithm. Thus, the results of parameter calibration (i.e. the stability of the final optimised values) and predictive uncertainty analysis depend greatly on parameter initial values and ranges defined at the beginning of the analysis. In the ongoing work, a global approach (i.e. Monte Carlo Markov chain) will be utilised for parameter and predic-tion uncertainty analyses [44].
Model transferability to the period 2006–2009
The HYPE model was successfully transferred and vali-dated temporally during the period 2006–2009 in terms of discharge and nitrate-N predictions using the same optimised parameters obtained for the period 1997– 2000. The share of crops and associated fertiliser appli-cation rates were taken from the collected field survey data by the TTV authority. Monitored agriculture prac-tice data for all fields were used as inputs to minimise the total uncertainty of the model application. Discharge simulation performance was slightly reduced in the period 2006–2009 compared to the previous period (1997–2003), where the NSE and PBIAS (for the period
2006–2009) were about 0.63 and 5.79 %, respectively (Fig. 7). The lower model performance could be ex-plained by the underestimation of the three high-flow events that occurred in September 2007, April 2008 and March 2009. The model, however, reproduced the dynam-ical behaviour of the measured nitrate-N concentrations well during the period 2006–2009. The discrepancies be-tween the measured and predicted discharges during the three extreme events resulted in the under-prediction of daily NO3-N load during these extreme events (Fig. 8a).
The predicted nitrate-N load of September 29, 2007, was about 3.917 kg d−1, much lower than the measured value, which was about 14.854 kg d−1. Overall, the HYPE model could represent the measured monthly nitrate-N loads (Fig. 8b) reasonably well, except for the three extreme events (September 2007, April 2008 and March 2009), as explained above. This monthly simulation was taken as a baseline for the comparison of the effects of land use and agriculture practice changes on stream nitrogen loads.
Effect of land use changes and agriculture management on instream water quality
fertiliser amounts augmented the monthly nitrate-N loads in the range of 2–6 % for the 3-year simulation period (Fig. 9a), except after the harvesting period, where the increase could achieve a range of 7–39 %. Nitrate-N concentrations were probably affected by the
amount of mineral NO3-N left in the soil after
har-vesting and continuing nitrogen mineralisation in late autumn and beginning of winter [45]. The chemical fer-tiliser and manure were divided and added to the two topsoil layers in the proportion set by the user, allowing Fig. 7Temporal validation of the HYPE model for discharge and nitrate-N concentrations in the period 2006–2009. The model could represent significantly well the hydrologic dynamical behaviour, except during some extreme events, which were underestimated resulting in reduction of NSE compared to the previous period 1997–2003. Also, the HYPE model could reproduce well the measured nitrate-N concentrations during the period 2006–2009
for simulation of different agriculture practices (such as tillage) [28].
The second scenario was designed considering only organic farming (S2). This scenario prompted the appli-cation of an average annual organic fertiliser in the range of 35.4–78.2 kg N ha−1 year−1 depending on the crop type (organic fertiliser rates were 69.2, 46.3, 48.6, 35.4, 78.2 and 58.4 for grassland, winter wheat, winter barley, summer barley, maize and rape, respectively). Results showed that the stream nitrate-N load reduced signifi-cantly during the entire simulation period, when only or-ganic farming (no chemical fertiliser) was applied (Fig. 9b). This reduction varied from 3 to 41 %, and the maximum decrease was observed during winter and spring compared to the baseline predictions (where min-eral and organic fertilisers were considered). It has to be noted that the efficiency of organic fertiliser is likely to be reduced by denitrification and volatile losses after its application. This process is highly influenced by plant uptake and weather conditions (temperature and rainfall patterns) and by the nitrogen turnover in the soil [45]. Thus, comparison between organic and mineral fertili-sers should consider these gaseous losses.
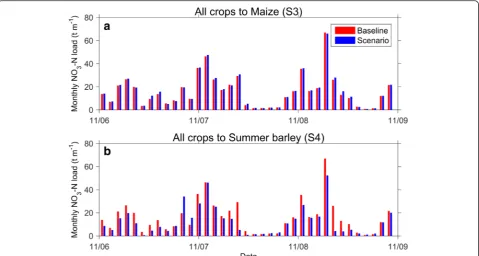
The scenario S3 assumes that all crops are converted to maize (Fig. 10a). This induced a constant annual fer-tiliser application of 190.8 kg N ha−1year−1(divided into 112.6 and 78.2 kg N ha−1for mineral and organic fertili-sers, respectively) for all crops. The results showed that
the nitrate-N load increased when all agricultural land (that were originally used by different crops) were con-verted to maize (Fig. 10a). The increase ranged between 1 and 5 %, except immediately after the application period (the first application was after ploughing and the second was 3 months after the sowing). After these two applications, the nitrogen load increased rapidly and achieved a range of 6–28 % compared to the baseline simulations. It was seen, experimentally, that the time of harvest affected the decomposition of maize residues [10]. Soil mineralisation can additionally be affected by soil moisture content, temperature and soil aeration. This may have a strong effect on nitrogen release after the harvest, when growing maize [10]. It was experimen-tally shown that nitrate-N leaching from grassland was five times less than from silage maize [45]. This suggests that further conversion of grassland, with high soil or-ganic matter content, to maize could increase nitrogen losses from land to water even on a regional scale [45].
nitrogen retention (e.g. denitrification processes) during the summer because of the high temperature. It has also been noted that the decrease of nitrogen load on the ac-count of scenario S4 (where all crops were converted to summer barley) was slightly reduced during the period August–October. This period corresponded to the after-harvesting phase of the summer barley and the early rainy autumn season, explaining an additional increase of leached nitrogen.
The results showed that converting bioenergy crops (i.e. rape and maize) to winter wheat (S5) reduced the average monthly nitrate-N loads of between 27 and 53 % compared to baseline predictions (Fig. 11a). The nitro-gen load, however, was increased only during the harvest period (June–August) within the range of 39–56 %. It is worth mentioning here that in Germany, the production of bioethanol is mostly carried out based on cereals (i.e. wheat, rye, barley and triticale). For instance, in 2011, about 80 % of the bioethanol production in Germany had been produced from grains and about 20 % from sugar beet [46].
When only the cropping areas of winter wheat and maize were converted to rape (S6), nitrate-N load was reduced (in the range of 6–19 %) during winter (November–March) and increased during spring and summer (17–60 %). The latter period corresponded to the second application of mineral fertilisers, which occurred 115 days after the
sowing of rape. It is known that rape requires a high rate of fertilisers (around 200 kg N ha−1year−1).
It has been reported in the literature that agricultural practices following field harvesting, such as ploughing time and ploughing type (i.e. how deep), may affect nitrogen losses from soil. The type and timing of the organic fertilisers can further affect nitrogen leaching considerably. For instance, it has been reported that deep ploughing of organic soils can lead to higher nitro-gen leaching than deep ploughing of sandy soils and soils poor in organic matter [47]. Based on a previous study [31], the Weida catchment is characterised by a high denitrification coefficient (0.0727 > 0.0228) com-pared to the Selke catchment located in Sachsen-Anhalt. This suggests that probably denitrification has prevented most of the nitrate-N from reaching the deeper ground-water. Also, the geology of the Weida catchment is char-acterised by clay schist and eruptive rocks, which leads to low groundwater flows.
Conclusions
nitrogen load. The effect of different land use and agri-cultural practice changes on the stream nitrogen load was investigated using a modelling scenario approach. The results revealed that the nitrogen loads could increase or reduce rapidly depending on the designed scenario. This rapid response could be explained by the short residence times of interflow and baseflow runoff components because of the hardrock geological proper-ties of the catchment. The nitrogen loads increased in the three scenarios where (i) mineral fertiliser was aug-mented by 20 %, (ii) all crops were converted to maize and (iii) winter wheat and maize were converted to rape. This induced either an increase of fertiliser application or increased cultivation of bioenergy crops, such as maize and rape, which were likely to increase stream nitrogen loads. On the other hand, the nitrogen load was reduced in scenarios where (i) only organic farming was practiced, (ii) only summer barley and rape were cropped and (iii) maize cropping areas were converted to winter wheat.
Also, these numerical investigations confirmed previ-ous experimental findings reported in the literature that management options such as fertiliser amounts and its time of application could increase or reduce nitrogen load very rapidly on soils with a high mineralisation po-tential (e.g. coarse-textured soils). Additional manage-ment options such as the choice of dominant crops
and its harvesting times could modify nitrogen load considerably.
There is a need for further detailed investigations of additional influencing factors (such as different crop ro-tation and different soil properties) on nitrogen leaching. Also, model uncertainties have to be considered for evaluating scenario effects. This is of significant import-ance of ongoing work.
Competing interests
The authors declare that they have no competing interests.
Authors’contributions
All authors designed the objectives and methods of the study. S. Jomaa, S. Jiang and MR collected the climatological, hydrological and agriculture practice datasets required for the model. DT helped to design the land use and agriculture changes. S. Jomaa and S. Jiang conducted the model setup and performed the simulations. S. Jomaa prepared the manuscript with contributions from all the co-authors. All authors read and approved the final manuscript.
Acknowledgements
The authors would like to thank Dagmar Fiedler and the guest editor Katja Bunzel for inviting us, writing an article based on our contribution to the“Biomass for energy: Lessons from bioenergy booms”in 2014 (http://www.ufz.de/biomass-lessons2014/index.php?de=33074, last accessed 11.8.2015). Moreover, we would also like to thank the reviewers for their valuable feedback and for helping to improve the final version of our article.
Author details 1
Department of Aquatic Ecosystem Analysis and Management, Helmholtz Centre for Environmental Research—UFZ, Brueckstrasse 3a, 39114 Magdeburg, Germany.2Department of Bioenergy, Helmholtz Centre for Environmental Research—UFZ, Permoserstrasse 15, 04318 Leipzig, Germany.
3Key Laboratory of Watershed Geographic Sciences, Nanjing Institute of
Geography and Limnology, Chinese Academy of Sciences, 73 East Beijing Road, Nanjing 210008, China.4Deutsches Biomasseforschugszentrum gGmbH, Torgauer Strasse 113, 04347 Leipzig, Germany.
Received: 22 September 2015 Accepted: 7 April 2016
References
1. Souza GM, Victoria RL, Joly RC, Verdade LM (2015) 72 Bioenergy & sustainability: bridging the gaps UNESCO. Scientific Committee on Problems of the Environment (SCOPE), Paris, in December 2013. http://rsb.org/pdfs/
reports/Bioenergy%20and%20Sustainability%20-%20Bridging%20the%20Gaps.pdf
2. Graham-Rowe D (2011) Agriculture: beyond food versus fuel. Nature 474:S6. doi:10.1038/474S06a
3. Robbins M (2011) Policy: fuelling politics. Nature 474:S22. doi:10.1038/474S022a 4. Fachagentur Nachwachsende Rohstoffe e.V. (FNR) (2013) Bioenergy: the
multifaceted renewable energy2013. Available http://mediathek.fnr.de/ media/downloadable/files/samples/f/n/fnr_brosch_re_bioenergie_2013_ engl._web.pdf (last accessed 26 May 2015)
5. Commission European for Renewable Energy, Road map renewable energies in the 21stcentury (2007), Building a more sustainable future 6. Fräss-Ehrfeld C (2009) Renewable energy sources: a chance to combat
climate change, Wolters Kluwer: law and business
7. Jackson RB, Jobbágy EG, Avissar R, Roy SB, Barrett DJ, Cook CW, Farley KA, le Maitre DC, McCarl BA, Murray BC (2005) Trading water for carbon with biological carbon sequestration. Science 310:1944. doi:10.1126/science.1119282 8. Editorial N (2007) Kill king corn. Nature 449:637. doi:10.1038/449637a 9. Fachagentur Nachwachsende Rohstoffe e. V. (FNR) (2012) Anbau
nachwachsender Rohstoffe 2012 auf 2,5 Millionen Hektar 2012. Available http://www.fnr.de/presse/pressemitteilungen/aktuelle-mitteilungen/aktuelle-nachricht/?tx_ttnews%5Btt_news%5D=5713&cHash=9c910b70ba 59c6d464ae217d5ca8e0da (last accessed 27 May 2015)
10. Müller J, Kayser M, Benke M (2011) Nitrate leaching following the cultivation of silage maize. http://www.uni-goettingen.de/de/nitrate-leaching-following-the-cultivation-of-silage-maize-/55661.html (last accessed 30 July 2015) 11. Offermann FHG, Kreins P, von Ledebur O, Pelikan J, Salamon P, Sanders J
(2010) Baseline 2009 to 2019: agri-economic projections for Germany. Landbauforschung - vTI Agriculture and Forestry Research 3:157 12. Schreiber H, Behrendt H, Constantinescu LT, Cvitanic I, Drumea D, Jabucar D,
Juran S, Pataki B, Snishko S, Zessner M (2005) Nutrient emissions from diffuse and point sources into the River Danube and its main tributaries for the period of 1998-2000-results and problems. Water Sci Technol 51:3–4
13. Hirt U, Venohr M, Kreins P, Behrendt H (2008) Modelling nutrient emissions and the impact of nutrient reduction measures in the Weser river basin, Germany. Water SciTechnol 58:11. doi:10.2166/wst.2008.833
14. Love BJ, Nejadhashemi AP (2011) Water quality impact assessment of large-scale biofuel crops expansion in agricultural regions of Michigan. Biomass Bioenergy 35:2200. doi:10.1016/j.biombioe.2011.02.041
15. Wu M, Demissie Y, Yan E (2012) Simulated impact of future biofuel production on water quality and water cycle dynamics in the Upper Mississippi river basin. Biomass Bioenergy 41:44. doi:10.1016/j.biombioe.2012.01.030
16. Pimentel D, Patzek T (2005) Ethanol production using corn, switchgrass, and wood; biodiesel production using soybean and sunflower. Nat Resour Res 14:65. doi:10.1007/s11053-005-4679-8
17. Maidl F-X, Sticksel E, Valta R (1999) Investigations for improved slurry utilization in maize. 1. Report: utilization of nitrogen, available in slurry by maize (silage and grain) using different application techniques. Ger J Agronomy 3:9 18. Dominguez-Faus R, Powers SE, Burken JG, Alvarez PJ (2009) The water
footprint of biofuels: a drink or drive issue? Environ Sci Technol 43:3005. doi: 10.1021/es802162x
19. Demissie Y, Yan E, Wu M (2012) Assessing regional hydrology and water quality implications of large-scale biofuel feedstock production in the upper Mississippi River Basin. Environ Sci Technol 46:9174. doi:10.1021/es300769k 20. Valipour M (2014) Land use policy and agricultural water management
of the previous half of century in Africa. Appl Water Sci. doi:10.1007/ s13201-014-0199-1
21. Arnold JG, Srinivasan R, Muttiah RS, Williams JR (1998) Large area hydrologic modeling and assessment. Part I: model development. J Am Water Resour Assoc 34:73. doi:10.1111/j.1752-1688.1998.tb05961.x
22. Arnold JG, Fohrer N (2005) SWAT2000: current capabilities and research opportunities in applied watershed modelling. Hydrol Process 19:563. doi:10.1002/hyp.5611
23. Rode M, Thiel E, Franko U, Wenk G, Hesser F (2009) Impact of selected agricultural management options on the reduction of nitrogen loads in three representative meso scale catchments in central Germany. Sci Total Environ 407:3459. doi:10.1016/j.scitotenv.2009.01.053
24. Vaché KB, Eilers JM, Santelmann MV (2002) Water quality modeling of alternative agricultural scenarios in the U.S. corn belt. J Am Water Resour Assoc 38:773. doi:10.1111/j.1752-1688.2002.tb00996.x
25. Powers SE, Ascough JC II, Nelson RG, Larocque GR (2011) Modeling water and soil quality environmental impacts associated with bioenergy crop production and biomass removal in the Midwest USA. Ecol Model 222:2430. doi:10.1016/j.ecolmodel.2011.02.024
26. Lautenbach S, Volk M, Strauch M, Whittaker G, Seppelt R (2013) Optimization-based trade-off analysis of biodiesel crop production for managing an agricultural catchment. Environ Model Softw 48:98. doi:10. 1016/j.envsoft.2013.06.006
27. Sarkar S, Miller SA (2014) Water quality impacts of converting intensively-managed agricultural lands to switchgrass. Biomass Bioenergy 68:32. doi:10.1016/j.biombioe.2014.05.026
28. Lindström G, Pers C, Rosberg J, Strömqvist J, Arheimer B (2010) Development and testing of the HYPE (Hydrological Predictions for the Environment) water quality model for different spatial scales. Hydrol Res 41:295. doi:10.2166/nh.2010.007
29. Jiang S, Jomaa S, Büttner O, Günter M, Michael R (2015) Multi-site identification of a distributed hydrological nitrogen model using Bayesian uncertainty analysis. J Hydrol 529:3. doi:10.1016/j.jhydrol.2015.09.009 30. Strömqvist J, Arheimer B, Dahne J, Donnelly C, Lindström G (2012) Water and
nutrient predictions in ungauged basins: set-up and evaluation of a model at the national scale. Hydrol Sci J 57:229. doi:10.1080/02626667.2011.637497 31. Jiang S, Jomaa S, Rode M (2014) Modelling inorganic nitrogen leaching in
nested mesoscale catchments in central Germany. Ecohydrology 7:1345. doi:10.1002/eco.1462
32. van Griensven A, Bauwens W (2003) Multiobjective autocalibration for semidistributed water quality models. Water Resour Res 39:1348. doi:10.1029/2003WR002284
33. Rode M, Suhr U, Wriedt G (2007) Multi-objective calibration of a river water quality model-Information content of calibration data. Ecol Model 204:129. doi:10.1016/j.ecolmodel.2006.12.037
34. Sivapalan M, Takeuchi K, Franks SW, Gupta VK, Karambiri H, Lakshmi V, Liang X, McDonnell JJ, Mendiondo EM, O’Connell PE, OKI T, Pomeroy JW, Schertzer D, Uhlenbrook S, Zehe E (2003) IAHS Decade on Predictions in Ungauged Basins (PUB), 2003–2012: shaping an exciting future for the hydrological sciences. Hydrol Sci J 48:857. doi:10.1623/hysj.48.6.857.51421 35. Fink M (2004) Regionale Modellierung der Wasser- und Stickstoff dynamik
als Entscheidungsunterstützung für die Reduktion des N-Eintrags am Beispiel des Trinkwassertalsperrensystems Weida- Zeulenroda, Thüringen. PhD thesis (in German) Jena Friedrich- Schiller-Universität, Chemisch-Geowissenschaftliche Fakultät, Jena, p 206
36. Hesser FB, Franko U, Rode M (2010) Spatially distributed lateral nitrate transport at the catchment scale. J Environ Qual 39:193. doi:10.2134/jeq2009.0031 37. Kralisch S, Fink M, Flügel WA, Beckstein C (2003) A neural network approach
for the optimisation of watershed management. Environ Model Softw 18: 815. doi:10.1016/S1364-8152(03)00081-1
38. Andersson L, Rosberg J, Pers BC, Olsson J, Arheimer B (2005) Estimating catchment nutrient flow with the HBV-NP model: sensitivity to input data. Ambio 34:521. doi:10.1579/0044-7447-34.7.521
39. Arheimer B, Löwgren M, Pers BC, Rosberg J (2005) Integrated catchment modeling for nutrient reduction: scenarios showing impacts, potential, and cost of measures. Ambio 34:513. doi:10.1579/0044-7447-34.7.513 40. Moriasi DN, Arnold JG, van Liew MW, Bingner RL, Harmel RD, Veith TL
(2007) Model evaluation guidelines for systematic quantification of accuracy in watershed simulations. Transactions of the ASABE, American Society of Agricultural and Biological Engineers 50:885–900
41. Nash JE, Sutcliffe JV (1970) River flow forecasting through conceptual models part I—a discussion of principles. J Hydrol 10:282. doi:10.1016/ 0022-1694(70)90255-6
43. Doherty J (2005) PEST: Model independent parameter estimation, user manual, 5th edn. Watermark Numerical Computing, Brisbane 44. Laloy E, Vrugt JA (2012) High-dimensional posterior exploration of
hydrologic models using multiple-try DREAM(ZS) and high-performance computing, Water Resour Res 48. doi: 10.1029/2011WR010608 45. Kayser M, Benke M, Isselstein J (2011) Little fertilizer response but high N
loss risk of maize on a productive organic-sandy soil. Agron Sustain Dev 31:709. doi:10.1007/s13593-011-0046-9
46. Naumann K, Oehmichen K, Zeymer M, Meisel K (2014) DBFZ Report Nr. 11: Monitoring Biokraftstoffsektor (2. Auflage), https://www.dbfz.de/fileadmin/ user_upload/DBFZ_Reports/DBFZ_Report11A_web.pdf. Accessed 20 Apr 2016
47. Müller U, Raissi F (2002) Arbeitshilfe für bodenkundliche Stellungnahmen und Gutachten im Rahmen der Grundwassernutzung. Niedersächsisches Landesamt für Bodenforschung, Hannover
Submit your manuscript to a
journal and benefi t from:
7 Convenient online submission 7 Rigorous peer review
7 Immediate publication on acceptance 7 Open access: articles freely available online 7 High visibility within the fi eld
7 Retaining the copyright to your article