effect on variant annotation
McCarthy
et al.
R E S E A R C H
Open Access
Choice of transcripts and software has a large
effect on variant annotation
Davis J McCarthy
1,2*, Peter Humburg
2, Alexander Kanapin
2, Manuel A Rivas
2, Kyle Gaulton
2,
The WGS500 Consortium, Jean-Baptiste Cazier
3and Peter Donnelly
1,2Abstract
Background: Variant annotation is a crucial step in the analysis of genome sequencing data. Functional annotation results can have a strong influence on the ultimate conclusions of disease studies. Incorrect or incomplete
annotations can cause researchers both to overlook potentially disease-relevant DNA variants and to dilute interesting variants in a pool of false positives. Researchers are aware of these issues in general, but the extent of the dependency of final results on the choice of transcripts and software used for annotation has not been quantified in detail.
Methods: This paper quantifies the extent of differences in annotation of 80 million variants from a whole-genome sequencing study. We compare results using the REFSEQand ENSEMBLtranscript sets as the basis for variant
annotation with the software ANNOVAR, and also compare the results from two annotation software packages, ANNOVARand VEP (ENSEMBL’s Variant Effect Predictor), when using ENSEMBLtranscripts.
Results: We found only 44% agreement in annotations for putative loss-of-function variants when using the REFSEQ and ENSEMBLtranscript sets as the basis for annotation with ANNOVAR. The rate of matching annotations for
loss-of-function and nonsynonymous variants combined was 79% and for all exonic variants it was 83%. When comparing results from ANNOVARand VEP using ENSEMBLtranscripts, matching annotations were seen for only 65% of loss-of-function variants and 87% of all exonic variants, with splicing variants revealed as the category with the greatest discrepancy. Using these comparisons, we characterised the types of apparent errors made by ANNOVARand VEP and discuss their impact on the analysis of DNA variants in genome sequencing studies.
Conclusions: Variant annotation is not yet a solved problem. Choice of transcript set can have a large effect on the ultimate variant annotations obtained in a whole-genome sequencing study. Choice of annotation software can also have a substantial effect. The annotation step in the analysis of a genome sequencing study must therefore be considered carefully, and a conscious choice made as to which transcript set and software are used for annotation.
Background
The advent of accessible and relatively inexpensive high-throughput sequencing technology has resulted in exten-sive sequencing of whole human genomes or exomes in a research setting and seems likely to lead to an explo-sion of genomic sequencing in a clinical context. While there remain challenges in unambiguously determining an individual’s genome or exome sequence [1,2], our focus here is on the downstream interpretation of that sequence. Let us take as a starting point a specified list of
*Correspondence: [email protected]
1Department of Statistics, University of Oxford, South Parks Road, Oxford, UK 2Wellcome Trust Centre for Human Genetics, University of Oxford, Roosevelt Drive, Oxford, UK
Full list of author information is available at the end of the article
positions, assumed to be correct, at which the nucleotides in the individual’s sequence differ from the human refer-ence sequrefer-ence. We will restrict our scope here to single nucleotide variants (SNVs) and short indels. A crucial step in linking sequence variants with changes in phenotype is variant annotation.
Variant annotation is the process of assigning functional information to DNA variants. There are many different types of information that could be associated with vari-ants, from measures of sequence conservation [3] to pre-dictions about the effect of a variant on protein structure and function [4-6]. Here we focus on the most fundamen-tal level of variant annotation, which is categorising each variant based on its relationship to coding sequences in
the genome and how it may change the coding sequence and affect the gene product.
The coding sequences of the genome are, broadly speaking, the genes: ‘gene’ has come to refer princi-pally to a genomic region producing (through transcrip-tion) polyadenylated mRNAs that encode a protein [7]. We refer to these polyadenylated mRNAs as ‘transcripts’, although the term transcript can refer to any RNAs pro-duced from the transcription of a genomic DNA sequence. Thus, there are non-coding transcripts that do not encode a protein, but nevertheless can have a function, for example in regulation. When considering transcripts in the context of genomic DNA sequences, a transcript is defined by its exons, introns and UTRs and their locations. Many separate transcripts may overlap any given position in the genome, and it is not uncommon for genes to have many different transcripts (or ‘isoforms’), of which they tend to express many simultaneously [8].
Our understanding of the protein-coding sequences in the genome is summarised in the set of transcripts we believe to exist. Thus, variant annotation depends on the set of transcripts used as the basis for annotation. The widely used annotation databases and browsers – ENSEMBL[9], REFSEQ[10] and UCSC [11] – contain sets of transcripts that can be used for variant annotation, as well as a wealth of information of many other kinds as well, such as ENCODE [12] data about the function of non-coding regions of the genome. A transcript set may therefore also contain information about regions of the genome that regulate expression of transcripts.
To annotate DNA variants we therefore require a set of transcripts that summarises our understanding of the genome. For each variant, we use a software tool to determine the likely effect of the variant based on the transcripts (or other genomic features) that overlap the variant’s position. One or more possible annotations for the variant can then be reported.
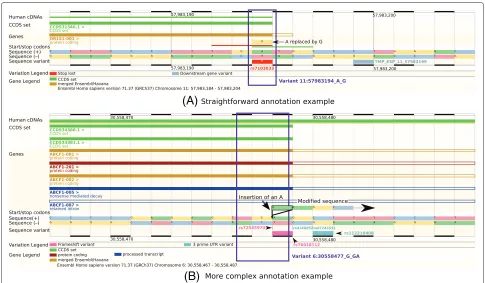
Variant annotation can be straightforward, as for the variant NC_000011.9:g.57983194A>G. Only two tran-scripts in the ENSEMBL transcript set, a Consensus Coding Sequence (CCDS) [13] transcript and a merged ENSEMBL/Havana (GENCODE) transcript [14,15], over-lap the variant and the annotation of the transcript is the same regardless of which transcript is used (Figure 1A). This variant is unambiguously a stop-loss variant, as the final codon is changed from TGA (stop codon) to TGG (tryptophan) [9,16], and both of the software tools that we use for the present study correctly annotate this variant as stop-loss.
Frequently, however, variant annotation is more com-plex. Typical pipelines are not well suited for handling a variant that could have one consequence for one script and a different consequence for a different tran-script. Even where a gene is relatively well defined and
does not overlap other genes, we may have many tran-scripts (isoforms of the gene) to choose from, often sup-ported by varying levels of evidence for their existence and structure. It is common for a gene to have multiple transcripts overlapping a given position in the genome, so given a set of transcripts a software tool has to choose which one to use. If it provides an annotation for the variant for each transcript, then the question becomes what annotation to report. If the software reports all pos-sible annotations from all pospos-sible transcripts then the user must decide how to prioritise different, competing annotations, or how to integrate them into downstream analysis. This issue is further exacerbated in the uncom-mon case of a single variant affecting multiple genes (each of which likely has multiple transcripts). Current annota-tion tools vary in approaches to reporting consequences of a variant in multiple genes at once. Choice of the under-lying set of transcripts used for annotation can give the user more control over transcript use. Transcript sets from different sources can have different characteristics. For example, both ENSEMBL and REFSEQcontain tran-scripts established from experimental evidence utilising automated annotation pipelines and manual curation, but their precise requirements for inclusion of transcripts dif-fer. The result is that the ENSEMBLtranscript set is larger than the REFSEQset (see Additional file 1), but the REF -SEQtranscript set is not simply a subset of the ENSEMBL transcript set.
(A)
(B)
Figure 1Annotation examples.These screenshots from the ENSEMBLweb browser [40] show two examples of variant annotation.(A)The variant NC_000011.9:g.57983194A>G (rs7103033) is relatively straightforward to annotate. It is the final base of the final exon in both transcripts at this position (a CCDS transcript (green) and a ‘merged’ ENSEMBL/Havana (GENCODE) transcript (gold)). The final codon has changed from TGA (stop codon) to TGG (tryptophan), so this is unambiguously a stop-loss variant. Using the ENSEMBLtranscript set, both ANNOVARand VEP correctly annotate this variant as stop-loss.(B)The variant NC_000006.11:g.30558477_30558478insA (rs72545970) is more difficult to annotate. It is the penultimate base of the exon for all but one of the transcripts shown. It is a single-base insertion, so could be annotated as a frameshift variant. Then again, it is an insertion in a stop codon, so could be a stop-loss variant. In fact, the final codon, TGA (stop codon), remains TGA with this variant (insertion of a single base A), so it is actually a synonymous variant. ANNOVARannotates it as frameshift insertion and VEP as stop-loss, when using ENSEMBLtranscripts. Each browser image consists of several tracks, which provide base-resolution information about the DNA sequence. Two tracks, ‘Sequence (+)’ and ‘Sequence (−)’, show the DNA sequence on the forward and reverse strands, respectively. Above these, a track shows start and stop codons, and above that, several tracks indicate the presence and structure of different transcripts (labelled as ‘Genes’ and ‘CCDS set’; transcripts are read from left to right). The ‘hollowed-out’ parts of transcripts indicate non-coding sequences. Below the DNA sequence, the track ‘Sequence variant’ shows known sequence variants from dbSNP [17] and the 1000 Genomes Project [18]. The ‘Variation Legend’ and ‘Gene Legend’ provide more information about features shown in different colours in the browser. CCDS, Consensus Coding Sequence; UTR, untranslated region.
for certain variants, but here we want to make the more general point using two very widely used annotation tools, that there is a large degree of discrepancy between any two annotation tools, and researchers need to be aware of this when choosing a tool and conducting analysis.
A third major issue complicating variant annotation is the question of how to deal with genes and pseu-dogenes. We have widely varying levels of information available for different genes. Should we treat variants in well-characterised genes in the same way as those in pseu-dogenes or non-genic regions of the genome? There is not currently a clear solution to this issue, although distinc-tions are usually made between annotadistinc-tions given from coding and non-coding transcripts. Again, careful choice of transcript set used for annotation can help.
Although there are many complications for variant annotation, we identify two major components:
1. Transcript set: a summary of information about genomic features, particularly the structure of transcripts (sequence and locations of exons, introns, UTRs and regulatory regions), used as the basis for determining the likely functional consequence of a variant.
We examine the effects of fixing one and then the other on a set of over 80 million SNVs and short indels from a large clinical sequencing project (see Methods). ANNO -VAR [24] is a popular annotation software tool, so we compare the results from ANNOVARwhen used with the REFSEQand ENSEMBL transcript sets. We also compare the annotation results from ANNOVARand another popu-lar annotation tool, VEP [25], the Variant Effect Predictor tool from ENSEMBL, when using the ENSEMBLtranscript set and characterise the sorts of differences in annota-tion between the two tools and the apparent errors that ANNOVARand VEP tend to make in annotation. Beyond issues specific to these particular transcript sets and soft-ware tools, we consider good practice for whole-genome annotation and problems that are yet to be solved.
Methods
Data generation
The data used in this paper come from the WGS500 Project, a collaboration between the University of Oxford, Oxford Biomedical Research Centre and Illumina, Inc, to sequence 500 genomes of clinical relevance. Samples were accepted from patients where positive findings would have immediate clinical translational relevance in terms of clinical diagnosis, prognosis, genetics coun-selling and reproductive options, or treatment selection. As seen in some of the published studies that partici-pated in the WGS500 project [26-32], this large umbrella project consists of many smaller sub-projects, focus-ing on particular diseases. All patients in this study gave written informed consent. The relevant research ethics committee (REC) reference numbers are: Central Oxfordshire Research Ethics Committee (05/Q1605/88), Hammersmith and Queen Charlotte’s and Chelsea REC (06/Q0406/151), NRES Committee South Central— Oxford B (12/SC/0381), NRES Committee South Central—Southampton A (12/SC/0044), NRES Commit-tee North West—Haydock (03/0/97 version 3), NRES Committee Yorkshire & The Humber—South Yorkshire (10/H1310/73), Oxfordshire Research Ethics Committee (06/Q1605/3), Oxfordshire Research Ethics Committee B (04.OXB.017; 09/H0605/3) and Oxfordshire Research Ethics Committee C (09/H0606/74; 09/H0606/5), River-side Research Ethics Committee (09/H0706/20) and Southampton and South-West Hampshire REC A (06/Q1702/99). The research conformed to the Helsinki Declaration and to local legislation.
We focus here on whole genomes of 276 individuals sequenced as part of the WGS500 project. The sam-ples included 80 patients with immune disease, 151 individuals from Mendelian disease studies (primarily parent–child trios) and 45 germ-line DNA samples from cancer patients. The sequencing was conducted using 100-bp paired-end protocols on either the Illumina HiSeq
2000 instrument [33] or the Illumina HiSeq 2500 in standard mode [34], with a mixture of v2.5 and v3.0 chemistries, to at least 25× average coverage. Sequence reads were generated using the Illumina Off-Line Base-caller (v1.9.3) [35] and mapped to the human reference genome GRCh37d5/hg19d5 using Stampy, predominantly versions 1.0.12_(r975) and 1.0.13_(r1160) [36]. Picard (picard-tools v1.67) was used to merge data and de-duplicate merged BAM files [37]. Variants were called from the aligned sequence reads using Platypus, version 0.1.9 [38]. The raw data for annotation are VCF (variant call format) files [39] containing information about the called variants.
In total, 80,995,744 unique variant calls were obtained from 276 individual genomes in the fifth freeze of the project’s data, and merged into a preliminary union file. We compare functional annotations for 80,981,575 vari-ants from the preliminary union file using transcript sets from different genome annotation databases and different annotation software tools, restricting ourselves to the set of variants for which an annotation was obtained using at least one transcript set or software tool.
Variant annotations
Variant annotations were obtained using the software tool ANNOVAR(version 2013Feb21), using both the REF -SEQ(release 57, January 2013) and ENSEMBL(version 69, October 2012) transcript sets [10,40]. We used the default transcript sets from REFSEQ and ENSEMBL. REFSEQ records are selected and curated from public sequence archives, so a REFSEQrecord represents a synthesis, by a person or group, reducing the redundancy in the database. The REFSEQ database does not contain all possible (or even all observed) transcripts or gene models, but those that it does annotate feature strong evidence for their existence, structure and (possibly) function. Of a total of 105,258 human transcripts in REFSEQrelease 57, 41,501 were used by ANNOVAR in the reported annotations for the variants in this study.
Similarly, ENSEMBL provides genome resources for chordate genomes with a particular focus on human genome data. ENSEMBLmakes available substantial and diverse transcript information, including the CCDS [13,41], Human and Vertebrate Analysis and Annota-tion (HAVANA) [42], Vertebrate Genome AnnotaAnnota-tion (Vega) [43], ENCODE data [12] and the GENCODE gene and transcript sets [15]. There are 208,677 transcripts in ENSEMBL version 69, of which 115,901 were used in reported annotations for this comparison.
relevant transcripts for a particular variant, then ANNO -VAR will return the annotation with the most severe consequence according to its rules of precedence.
Variant annotations were also obtained using version 2.7 of ENSEMBL’s VEP, based on the ENSEMBL version 69 transcript set. As VEP returns all possible annotations for each variant (given the transcripts present at each variant’s location in the genome), we prioritised annota-tions using a common-sense ranking of the ‘severity’ of the consequence of the variant (Additional file 1: Table S3) to make the VEP annotation results directly com-parable with those from ANNOVAR. This prioritisation for consequences from VEP is just one possible way to prioritise variants and this subjectivity could affect the extent of matching between annotations from ANNO -VAR and VEP. The most severe consequence for each variant was reported and compared to the ANNOVAR results.
Comparisons of variant annotations
We compared results across all annotation categories for the REFSEQ/ENSEMBL comparison. A comparison table (union_rfs_ens_comparison.tab[44]), was pro-duced with a custom Perl [45] script from VCF files containing ANNOVAR annotations when using REFSEQ and ENSEMBL transcripts and gene information for the transcript(s) used for each annotation. ANNOVARreports only the ‘most damaging’ annotation, but can return tran-script information for all trantran-scripts that would give the annotation reported. Subsequent statistical analysis was done inRversion 2.15.0 [46].
For the comparison of ANNOVARand VEP we focused on exonic variants (and especially loss-of-function (LoF) and nonsynonymous variants) for the ANNOVAR/VEP comparison as these are currently of the greatest interest in the majority of annotation applications in whole-genome sequencing (WGS) studies. A VCF file containing all variants for comparison with annota-tions from ANNOVAR was processed to obtain VEP annotations, and the results were processed with a custom Python [47] script to create a table of vari-ants (ANV_VEP_ens_comparison_best_annos.tab
[44]). The table provides annotation results obtained using ENSEMBLtranscripts with ANNOVARand VEP, and information on transcripts used. The table was then anal-ysed withR. We used the ENSEMBLWeb Browser (archive version of ENSEMBL 69) [40] and the UCSC Genome Browser [48] to inspect sets of variants identified to be of particular interest by comparing annotations using the DNA sequence and other information available in the browser. Source code for the analyses described here is available in the repository containing the data, along with a ‘README’ file that provides more details about the data and source code files.
Categories of variant annotations
To present, explain and discuss the results of our compar-isons we need to introduce the different types of anno-tations produced by the different annotation tools. We define four high-level categories of variants that are of particular interest for many functional studies:
1. Putative LoF variants:variants that are likely to cause a gene product to be subject to
nonsense-mediated decay and result in lost (or impaired) function of the gene. We include in this high-level category frameshift deletions, frameshift insertions, and stop-gain, stop-loss and (most) splicing variants. Where finer resolution splicing categories are available (for example from VEP and some other annotation tools), we classify variants in splice acceptor and splice donor sites as LoF and other splicing variants as generically exonic (defined below). ANNOVARdoes not provide subcategories of splicing variants, so for our study we include all splicing variants in the LoF high-level category. 2. Nonsynonymous and missense variants:variants
in exons that change the amino acid sequence encoded by the gene (but are not LoF), including single-base changes and nonframeshift indels. For this study we include VEP’s ‘splice_region_variant’ annotation in the missense high-level category as this reflects the fact that general splice region variants are usually of a similar level of interest as canonical missense variants.
3. Synonymous variants:variants located in exons that do not change the translated amino acid sequence. 4. Exonic variants:variants that fall anywhere in exons
or splicing regions, so this includes all variants in the LoF, nonsynonymous and synonymous high-level categories above.
The exact terms used to denote annotation categories dif-fer between ANNOVARand VEP, but the correspondence in terms is almost always clear (Additional file 1: Table S4). There are three exonic categories used by VEP (initiator codon variant, stop retained variant and other coding) for which there is no direct equivalent among the ANNOVAR categories.
Results and discussion
Same annotation tool, different transcript sets
medical studies. The match rate is also substantially lower than the overall match rate for variants in non-coding RNA and UTR regions, but there is better agreement for exonic and intronic variants. This observation accords with what we would expect: in areas of the genome where more is known about the protein-coding structure of the sequence, the annotations when using the two transcript sets agree more closely.
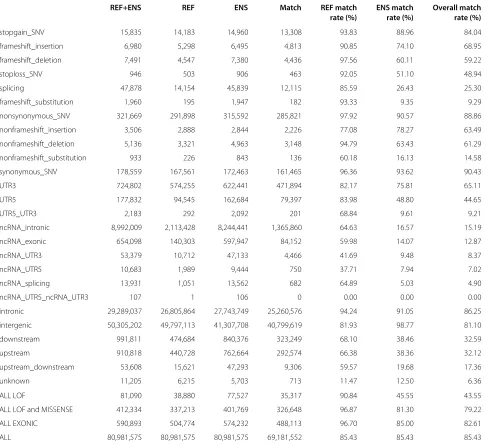
There are 590,893 variants given exonic annotations by ANNOVAR using REFSEQ or ENSEMBL (or both), of which 488,113 (83%) had precisely matching annotations when using the two different transcript sets (Table 1). The breakdown of matching variants by annotation reveals annotation categories showing greater and lesser differ-ence when using REFSEQ or ENSEMBL. The extent of annotation matching is also summarised by high-level cat-egory: LoF, LoF and missense (nonsynonymous), exonic and all annotated.
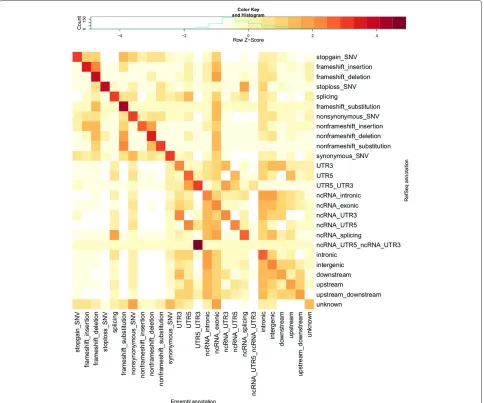
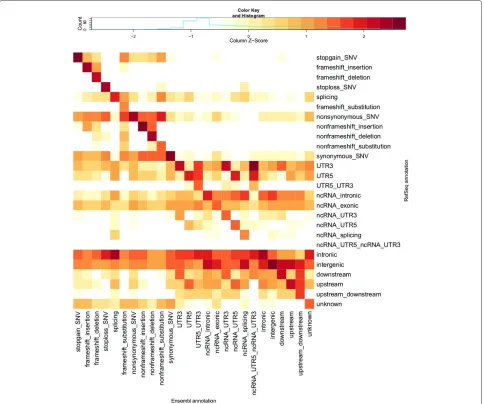
Visual comparison of transcript sets using REFSEQ- and ENSEMBL-normalised counts of variants with each com-bination of annotation terms from the two transcript sets highlights patterns in the differences in annotations pro-vided by REFSEQ and ENSEMBL (Figures 2 and 3). By ‘REFSEQ-normalised’, we mean that for each annotation term we consider all of the variants given that annotation using REFSEQacross all annotations using ENSEMBLand then normalise the count for each ENSEMBLannotation within the REFSEQannotation by subtracting the mean number of counts per ENSEMBL annotation and divid-ing by the standard deviation. We do this independently for each REFSEQannotation term. To obtain ‘ENSEMBL -normalised’ values we do precisely the same thing, but exchange the roles of the ENSEMBL and REFSEQ anno-tations. Thus, for a given annotation term for a given transcript set, we can see the relative breakdown of anno-tations obtained when using the other transcript set. The REFSEQ-normalised values (Figure 2) show good agree-ment for indels (frameshift and nonframeshift), stop-gain, stop-loss and nonsynonymous variants, that is, a large proportion of variants given a particular annota-tion when using REFSEQ also get that annotation when using ENSEMBL. The agreement is not as good for synony-mous and splicing variants, but we observe that variants given an exonic annotation when using REFSEQusually get the same annotation when using ENSEMBL. Look-ing at ENSEMBL-normalised values (Figure 3), we see generally lower matching rates. Agreement is good for variants called stop-gain, nonframeshift, nonsynonymous and synonymous by ENSEMBL, but variants annotated as frameshift, stop-loss and splicing are frequently given a different annotation when using REFSEQ.
The asymmetry in the differences in annotations between REFSEQand ENSEMBLis striking. We see many more exonic annotations, across all LoF, nonsynonymous
and synonymous categories, when using ENSEMBL tran-scripts (Table 1 and Additional file 1: Table S1). There are several thousand variants that are called exonic by ENSEMBL and yet are called as intergenic, intronic or in a non-coding RNA by REFSEQ. Conversely, there are only a few hundred exonic variants from REFSEQ that are annotated as intergenic, intronic or in non-coding RNA according to ENSEMBL. Using ENSEMBLhere would gain over 2,000 frameshift indels and over 1,000 stop-gain/stop-loss variants compared with using REFSEQ, which all LoF variants of substantial interest for follow-up. This asymmetry is not surprising when we consider the composition of the two transcript sets. The REFSEQ set contains 105,258 human transcripts in release 57, for which the protein-coding sequences cover approximately 1.07% of the genome (34 Mb). ANNOVAR actively used 41,501 of these transcripts for annotation of this set of variants. The ENSEMBL version 69 set contains 208,677 transcripts (192,635 on chromosomes 1 to 22, X and Y, excluding patches and alternate loci), covering approxi-mately 28% of the genome (892 Mb), including introns. The protein-coding sequences in the ENSEMBLtranscript set cover approximately 1.12% of the genome (35 Mb). Of these transcripts, 115,091 were actively used for the anno-tation of this set of variants, including the set of 92,776 transcripts containing protein-coding sequences.
This extent of discrepancy in annotations can be par-tially explained by the fact that a high proportion of REFSEQtranscripts have an equivalent or highly similar transcript in ENSEMBL, but in the other direction there are many transcripts in ENSEMBLthat do not appear to have a similar transcript in REFSEQ. ANNOVARreports the most severe consequence for a variant across all transcripts present at that position in the genome, so with more tran-scripts available when using ENSEMBLthere is an elevated chance of finding a more severe consequence for one of the ENSEMBLtranscripts. Examples of variants with strik-ing differences in annotation help to characterise the sorts of differences seen (Additional file 1: Figures S1 to S8). We saw no significant differences in annotation agreement rates across different variant frequencies (Additional file 1: Table S5a).
Same transcript set, different annotation tools
Table 1 Same software, different transcripts: REFSEQvs ENSEMBLby ANNOVARannotation category
REF+ENS REF ENS Match REF match ENS match Overall match rate (%) rate (%) rate (%)
stopgain_SNV 15,835 14,183 14,960 13,308 93.83 88.96 84.04
frameshift_insertion 6,980 5,298 6,495 4,813 90.85 74.10 68.95
frameshift_deletion 7,491 4,547 7,380 4,436 97.56 60.11 59.22
stoploss_SNV 946 503 906 463 92.05 51.10 48.94
splicing 47,878 14,154 45,839 12,115 85.59 26.43 25.30
frameshift_substitution 1,960 195 1,947 182 93.33 9.35 9.29
nonsynonymous_SNV 321,669 291,898 315,592 285,821 97.92 90.57 88.86
nonframeshift_insertion 3,506 2,888 2,844 2,226 77.08 78.27 63.49
nonframeshift_deletion 5,136 3,321 4,963 3,148 94.79 63.43 61.29
nonframeshift_substitution 933 226 843 136 60.18 16.13 14.58
synonymous_SNV 178,559 167,561 172,463 161,465 96.36 93.62 90.43
UTR3 724,802 574,255 622,441 471,894 82.17 75.81 65.11
UTR5 177,832 94,545 162,684 79,397 83.98 48.80 44.65
UTR5_UTR3 2,183 292 2,092 201 68.84 9.61 9.21
ncRNA_intronic 8,992,009 2,113,428 8,244,441 1,365,860 64.63 16.57 15.19
ncRNA_exonic 654,098 140,303 597,947 84,152 59.98 14.07 12.87
ncRNA_UTR3 53,379 10,712 47,133 4,466 41.69 9.48 8.37
ncRNA_UTR5 10,683 1,989 9,444 750 37.71 7.94 7.02
ncRNA_splicing 13,931 1,051 13,562 682 64.89 5.03 4.90
ncRNA_UTR5_ncRNA_UTR3 107 1 106 0 0.00 0.00 0.00
intronic 29,289,037 26,805,864 27,743,749 25,260,576 94.24 91.05 86.25
intergenic 50,305,202 49,797,113 41,307,708 40,799,619 81.93 98.77 81.10
downstream 991,811 474,684 840,376 323,249 68.10 38.46 32.59
upstream 910,818 440,728 762,664 292,574 66.38 38.36 32.12
upstream_downstream 53,608 15,621 47,293 9,306 59.57 19.68 17.36
unknown 11,205 6,215 5,703 713 11.47 12.50 6.36
ALL LOF 81,090 38,880 77,527 35,317 90.84 45.55 43.55
ALL LOF and MISSENSE 412,334 337,213 401,769 326,648 96.87 81.30 79.22
ALL EXONIC 590,893 504,774 574,232 488,113 96.70 85.00 82.61
ALL 80,981,575 80,981,575 80,981,575 69,181,552 85.43 85.43 85.43
This table summarises the number of annotations that match between the REFSEQand ENSEMBLresults for each category of annotation. It shows the number of variants given each type of annotation when using (i) either REFSEQor ENSEMBL(‘REF+ENS’; union), (ii) REFSEQ(‘REF’) and (iii) ENSEMBL(‘ENS’). It also shows the number of variants that have matching annotations (i.e. the same annotation when using both transcript sets; intersection) and the match rate for each transcript set, which expresses the proportion of matching annotations for an annotation term relative to the total number of annotations in the category from the particular transcript set, as a percentage. The final column shows the ‘Overall match rate’, which is the percentage of the variants with a given annotation when using either REFSEQor ENSEMBL(‘REF+ENS’) that have a matching annotation when using the two transcript sets. Categories are loosely ordered by the severity of effect, with LoF annotations listed before nonsynonymous, synonymous, non-exonic categories and so on. Within each loose group, categories are sorted in descending order of overall matching rate. The bottom four rows show the total degree of matching across all putative loss-of-function (LoF) categories, all LoF and missense categories, all exonic categories and, finally, all categories.
mean that annotations from both software tools are in the same high-level category of LoF, missense or synony-mous and other coding (with high-level categories defined in Additional file 1: Table S4). So if a variant received an annotation of frameshift from one tool and stop-gain from the other we would designate this as a category match as both are LoF annotations. Overall, we see only
a small difference in matching rates when we consider category matches as opposed to exact matches, with cat-egory matching rates approximately 1% higher than exact matching rates (Table 2).
Figure 2REFSEQ-normalised heatmap of annotation comparison.This heatmap shows scaled numbers of variants (log10transformation with offset of 1 applied) for all different combinations of ANNOVARcategories of annotations when using the ENSEMBLtranscript set (columns) and REFSEQtranscript set (rows). Values are Z-scaled (mean-centred, divided by standard deviation) by row (each row is scaled separately; contrast with Figure 3). The key above the heatmap shows the values indicated by different colours. This row-normalised heatmap allows us to see which categories of annotation are over-represented (relative to the total number of variants in the column/category) in the ENSEMBLannotations for each category (i.e. row) of REFSEQannotation. Ideally, all of the dark red squares would lie on the diagonal, with white squares on the off-diagonals, indicating complete agreement in the annotations from the two transcript sets. Compare with Additional file 1: Table S1, which provides the numbers used for this heatmap. Categories are ordered as per Table 1.
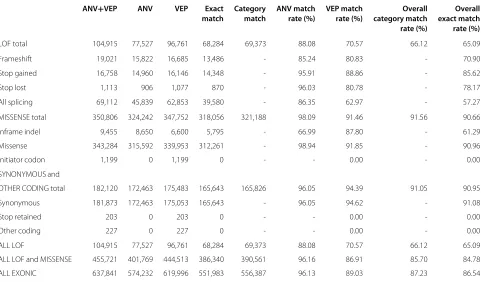
tools and 556,387 (87.2%) have category matching anno-tations. However, the match rate is substantially lower (65% for exact matches, 66% for category matches) for LoF annotations (Table 2). We observe that 89% of exonic variants from VEP get an exactly matching annotation from ANNOVAR and 96% of exonic variants according to ANNOVARget an exactly matching annotation from VEP. These percentages of agreement should not be taken to show that ANNOVAR is ‘more accurate’ than VEP – the difference between the tools for exonic variants is driven by the larger number of splicing annotations from VEP,
which is due to a difference in the definition of a splicing variant used by the two tools.
Figure 3ENSEMBL-normalised heatmap of annotation comparisons.This heatmap shows scaled numbers of variants (log10transformation with offset of 1 applied) for all different combinations of ANNOVARcategories of annotations when using the ENSEMBLtranscript set (columns) and REFSEQtranscript set (rows). Values are Z-scaled (mean-centred, divided by standard deviation) by column (each column is scaled separately; contrast with Figure 2). The key above the heatmap shows the values indicated by different colours. The column-normalised heatmap allows us to see which categories of annotation are over-represented (relative to the total number of variants in the column/category) in the REFSEQannotations for each category (i.e. column) of ENSEMBLannotation. Ideally, all of the dark red squares would lie on the diagonal, with white squares on the off-diagonals, indicating complete agreement in the annotations when using the two transcript sets. Compare with Additional file 1: Table S1, which provides the numbers used for this heatmap. Categories are ordered as per Table 1.
saw no significant differences in annotation agreement rates across different variant frequencies (Additional file 1: Table S5b).
To characterise the sorts of apparent errors or inconsis-tencies that commonly emerge in annotation by ANNO -VARand VEP, we investigated cases for which annotations from ANNOVARand VEP disagree. Although it is counter-intuitive (since the annotations were based on the same set of transcripts), ANNOVAR and VEP do not always use the same transcript for the annotation of a variant. This is a result of the interaction of different annotation
Table 2 Same transcripts, different software: ANNOVARand VEP annotations for exonic variants
ANV+VEP ANV VEP Exact Category ANV match VEP match Overall Overall match match rate (%) rate (%) category match exact match rate (%) rate (%)
LOF total 104,915 77,527 96,761 68,284 69,373 88.08 70.57 66.12 65.09
Frameshift 19,021 15,822 16,685 13,486 - 85.24 80.83 - 70.90
Stop gained 16,758 14,960 16,146 14,348 - 95.91 88.86 - 85.62
Stop lost 1,113 906 1,077 870 - 96.03 80.78 - 78.17
All splicing 69,112 45,839 62,853 39,580 - 86.35 62.97 - 57.27
MISSENSE total 350,806 324,242 347,752 318,056 321,188 98.09 91.46 91.56 90.66
Inframe indel 9,455 8,650 6,600 5,795 - 66.99 87.80 - 61.29
Missense 343,284 315,592 339,953 312,261 - 98.94 91.85 - 90.96
Initiator codon 1,199 0 1,199 0 - - 0.00 - 0.00
SYNONYMOUS and
OTHER CODING total 182,120 172,463 175,483 165,643 165,826 96.05 94.39 91.05 90.95
Synonymous 181,873 172,463 175,053 165,643 - 96.05 94.62 - 91.08
Stop retained 203 0 203 0 - - 0.00 - 0.00
Other coding 227 0 227 0 - - 0.00 - 0.00
ALL LOF 104,915 77,527 96,761 68,284 69,373 88.08 70.57 66.12 65.09
ALL LOF and MISSENSE 455,721 401,769 444,513 386,340 390,561 96.16 86.91 85.70 84.78
ALL EXONIC 637,841 574,232 619,996 551,983 556,387 96.13 89.03 87.23 86.54
This table summarises the number of annotations that match between the ANNOVARand VEP results (when using ENSEMBLtranscripts) for each exonic category of annotation. It shows the number of variants given each type of annotation by when using (i) either ANNOVARor VEP (‘ANV+VEP’; union), (ii) ANNOVAR(‘ANV’) and (iii) VEP (‘VEP’). It also shows the number of variants that have exact matching annotations (i.e. exactly the same annotation from both tools; intersection), and category-matching annotations (i.e. annotations from the two tools in the same high-level category – LoF, missense, synonymous and other coding – even if not an exact match). Columns six and seven show the match rate for each tool, which gives the percentage of matching annotations for an annotation term from ANNOVAR
and VEP, respectively, relative to the total number of annotations in the category from the particular software tool. Column eight gives the percentage of variants with annotations from ANNOVARand VEP in the same high-level category (overall category match rate). Column nine shows the overall exact match rate, which is the percentage of variants with an annotation from either ANNOVARor VEP (‘ANV+VEP’) that have an exactly matching annotation from the two tools. Here, the specific annotations from equivalent terms for ANNOVARand VEP have been aggregated to enable the comparison (see Additional file 1: Table S4). The final three rows of the table show aggregate counts and match rates for all loss-of-function categories, all LoF and missense categories and all exonic categories, respectively. Note that the all splicing category for VEP comprises 5,011 splice acceptor variants, 8,544 splice donor variants and 49,298 more general splice region variants. ANNOVAR, in contrast, only has one general splicing category, and does not distinguish between acceptor, donor and other splicing variants.
of splicing annotations), we discuss differences in anno-tation algorithms that are likely causes of differences in annotation, but detailed information on annotation algo-rithms is not available for ANNOVAR or VEP, even in online documentation [49,50].
Frameshift variants
We observed over 2,000 variants that are annotated as frameshift by either ANNOVARor VEP but not the other (Additional file 1: Table S6). Among these, we found that ANNOVARannotates over 300 variants as frameshift despite them being SNVs, so the ANNOVARannotation is unequivocally incorrect for these variants. For the major-ity of these variants, however, it is not possible to say con-clusively from manual inspection whether the ANNOVAR or VEP annotation is correct.
All of the variants that are annotated as frameshift by VEP but not by ANNOVAR are genuine indels and none are a multiple of three bases, so VEP looks to be correctly
Stop-gain variants
When we look at the variants annotated as stop-gain by ANNOVAR, but not by VEP (when the same transcripts are used), we see that the majority (437 of the 570) are given frameshift annotations by VEP (Additional file 1: Table S7). We saw above that ANNOVAR’s precedence rules can lead it to give a stop-gain annotation to an indel for which frameshift would otherwise be a reasonable annotation. Here too, all of the variants annotated as frameshift by VEP seem to be genuine frameshift variants (as they are indels that are not a multiple of 3 bp in size). These dis-crepancies, therefore, reflect a difference in precedence for reporting annotations, rather than a true difference between the annotation algorithms, and the ANNOVAR annotation (assuming it correctly identifies introduced stop codons) adds information of interest. There is a much smaller number of variants given missense (77) and synonymous (39) annotations by VEP (Additional file 1: Table S7a).
Manual inspection in the ENSEMBL Genome Browser of ten of those discrepant variants on chromosome 1 shows that for eight of the ten missense (from VEP) vari-ants, the VEP annotation looks correct (for two variants neither annotation looks correct; see Additional file 1: Table S10 for details of these variants). For other dis-crepant variants, manual inspection reveals that the VEP annotation looks correct more often than the ANNO -VAR annotation (see Additional file 1: ‘Supplementary Results’ for more details). When we look at variants anno-tated as stop-gain by VEP and either frameshift or non-frameshift by ANNOVAR, we see that approximately 20% (30 variants) of these are SNVs, which cannot be cor-rectly annotated as frameshift or nonframeshift (as these terms only apply to an insertion or deletion). Thus, the ANNOVARannotations for these particular variants can-not be correct, and must simply be a result of a software bug. For the remaining variants it is difficult to assess whether the ANNOVARor VEP annotation is better. Even after taking into account the differences in annotation caused by different precedence rules, the stop-gain anno-tations from VEP look more reliable than those from ANNOVAR.
Stop-loss variants
There are only small numbers of variants that are anno-tated as stop-loss by ANNOVAR and not by VEP, but almost all of these are annotated as frameshift by VEP. Inspection reveals that all of these variants are indeed indels that are not a multiple of three bases, therefore annotations of frameshift from VEP are reasonable. Look-ing closely at the variants reveals that there is a roughly even split between when the ANNOVARor the VEP anno-tation look better. There are only 16 variants that are annotated as stop-loss by VEP and as something else by
ANNOVARwhen the two tools use the same transcript for annotation (Additional file 1: Table S8).
Splicing variants
The category (or categories) of splicing variants is a source of many differences in annotations from different annota-tion software tools. Unlike most other categories of anno-tation, in the field there are still multiple notions of what entails a splicing variant. ANNOVARdefines just one broad category, splicing, for these variants: any variant withinx bp of a splicing junction receives the annotation splicing. The value ofxcan be specified by the user of ANNOVAR, and for our annotations here we used a broad definition of splicing by settingx = 6. In contrast, VEP uses three categories of splicing variant: (1) splice donor variant, a splice variant that changes the two-base region at the 5 end of an intron; (2) splice acceptor variant, a splice vari-ant that changes the two-base region at the 3 end of an intron and (3) splice region variant, a sequence variant in which a change has occurred within the region of the splice site, either within one to three bases of the exon or three to eight bases of the intron. VEP thus gives more useful information, through its subcategories of splicing variants, about the likely function of a variant. We also see that differences in annotation can arise simply as a result of differing definitions of what a splicing variant is, rather than any truly substantial differences in the algorithms producing the annotations. We investigated these differ-ences in annotation on variants where both tools used the same transcript for annotation, and annotations did not match, that is, a variant with a splicing annotation from ANNOVARdid not get an annotation of one of splice donor variant, splice acceptor variant or splice region variant, or the inverse.
VEP, and for these variants the VEP annotations look to be better.
Discussion
The results of our comparison of annotations obtained using REFSEQ and ENSEMBL transcript sets emphasise the importance of the choice of transcript set used for annotation. Applying the same annotation software with different transcript sets saw a matching rate of 44% for putative LoF annotations. Though not done here, tran-script sets from REFSEQand ENSEMBL(or other sources) can be restricted to a subset of transcripts to exclude low confidence annotations. Where a specific tissue of interest is known, annotation could be restricted to use only the set of transcripts known to be expressed in that tissue. Defining a targeted set of transcripts will not always be easy, but for sequencing studies where the cost of false positives (e.g. through follow-up experiments) is high, and where information on the expression of spe-cific transcripts exists, a set of high-confidence transcripts tailored to the study at hand may be preferable. Projects like GENCODE aim to provide a carefully curated tran-script set supported by experimental evidence [15,51-53], so through efforts such as these we may see annotation results converge as (ideally tissue-specific) transcript sets align across different repositories. For the time being, though, large differences remain.
Variant annotation remains challenging for current soft-ware tools: differing choices made in annotation packages on how to analyse, categorise and prioritise annotations for a variant lead to differing annotations from different tools, even when using the same set of transcripts as the basis for annotation. Differences in annotations from dif-ferent software tools (e.g. 64% overall agreement for LoF annotations) are not as large as those seen when using different transcript sets (44% overall agreement for LoF annotations), and are often caused by differences in the annotation categories defined by different tools. Never-theless, the extent of the differences seen show that, again, careful consideration must be given when choosing a soft-ware tool to make sure that it is well suited to the goals of the scientific investigation.
Standardising definitions of variants across the field, to reduce the scope for apparent differences in annota-tions returned by different software tools and to crystallise the (epistemic) meaning of terms used for annotations, could be of value. In our results here, for example, dif-fering definitions of splicing variants cause tens of thou-sands of annotation differences. The Sequence Ontology Project [54] may help with this. It would be beneficial for phase information to be used in annotating variants in close proximity, given, for example, the extent of ‘res-cue’ of LoF variants by nearby variants [55]. Currently, annotation tools typically do not associate any measure
of uncertainty with reported variant annotations. Such information could be useful for downstream analysis, especially for consideration when allocating resources for follow-up experiments on variants of interest. When a high level of certainty about the validity of an annotation is required, variants could be annotated with two software tools and variants with differing annotations flagged to be treated with caution.
In the comparison of annotation tools here, we restricted each tool to report just the most severe conse-quence annotation for each variant, to avoid comparisons becoming too unwieldy. However, VEP and other anno-tation tools can (and often by default do) report annota-tions for all transcripts, providing extra information that is often valuable. Adding this extra information, as with utilising phase information or tissue-specific transcripts, increases the challenges for data processing and interpre-tation by adding complexity to the treatment of variant annotation, but with good reason: this added complexity reflects the underlying biology, so taking this information into account potentially adds significant value to analyses of DNA variants.
Our understanding of the human genome continues to improve rapidly even as we gain a better apprecia-tion of the genome’s complexity. As a result, at some point we may see the variant annotations from different approaches converge. For the time being, though, we con-front an epistemic challenge (determining the meaning or function of variants observed) because our ontologi-cal foundations (knowledge and understanding of what all sequences in the genome actually do) remain unresolved or unclear. Thus, the choices of transcript set and software tool can have substantial effects on the annotation results obtained, and from there, large effects on all downstream aspects of the analysis of WGS data. Variant annotation is not yet a plug-and-play procedure and should not be treated as such.
In addition to different variant annotation approaches (of which there are more than we have compared here), there are different sequencing technologies, read map-pers and variant callers. Each of these can potentially have substantial impact on the final variants and annotations obtained, but comparison of other sources of variation is beyond the scope of this paper. We refer interested readers to systematic comparisons of other aspects of the next-generation sequencing pipeline, for example com-parisons of benchtop high-throughput sequencing tech-nologies [56], short-read mappers [57], variant callers [58] and variant-calling pipelines as a whole [59,60].
transcript set, we suggest researchers be aware of the impact of these choices, and hope our comparisons may inform such decisions.
Conclusions
We have quantified the extent of disparity in variant anno-tation when different transcript sets and different software tools are used. This comparison of annotations for 80 million human DNA variants revealed many substantial differences between annotations based on different tran-script sets and different software tools. The extent of differences in annotations was particularly large in anno-tation categories of most interest, namely, putative LoF and nonsynonymous variants. We found many more vari-ants with annotations in interesting categories when using ENSEMBLtranscripts compared with REFSEQtranscripts only. If it is important not to miss potential LoF variants, then there are advantages to using ENSEMBLtranscripts. If it is important to reduce false positives, then a care-fully curated set of transcripts tailored to the study at hand may be preferred. Even when using the same transcript set, different annotation software packages can provide substantially different annotations.
There are variants with potentially severe effects that are identified with one method and not another. We require consistent, accurate and reliable annotation of variants to support the use of WGS in making diagnostic and treat-ment decisions. The dependence of current annotation results on the set of transcripts and software used can be managed, with sufficient care, in the research context. However, more work is required to improve variant anno-tation for clinical use. The differences in annoanno-tation due to choice of transcript set and software package quantified here should be given due consideration when undertak-ing variant annotation in practice. Careful thought needs to be given to the choice of transcript sets and software packages for variant annotation in sequencing studies.
Additional file
Additional file 1: Supplementary material for ‘Choice of transcripts and software has a large effect on variant annotation’.This PDF file contains supplementary figures, supplementary tables and further details of the results of the annotation comparisons for which there was insufficient space in the main text.
Abbreviations
bp, base pair; CCDS, Consensus Coding Sequence; LoF, loss of function; Mb, megabase; miRNA, microRNA; SNV, single nucleotide variant; UTR, untranslated region; VEP, Variant Effect Predictor; WGS, whole-genome sequencing.
Competing interests
The WGS500 Project was funded in part by Illumina, Inc.
Authors’ contributions
DJM conducted the analysis and wrote the manuscript. PH, MAR and KG wrote alternative software for variant annotation, which was used to compare with ANNOVAR, and provided advice about the comparisons. AK processed raw
sequencing data, called variants and conducted the annotation using ANNOVAR. JBC supervised the analysis and wrote the manuscript. PD conceived of the study, directed the process and wrote the manuscript. The WGS500 Consortium provided the raw data. A list of WGS500 Consortium members and affiliations is provided in Additional file 1. All authors approved the final version of the manuscript.
Acknowledgements
The authors wish to thank the patients and their families for participating in this study. We are also grateful to Alistair Pagnamenta for helpful discussions and suggestions to improve the analysis and manuscript, and Gil McVean and Jenny Taylor for their comments on an earlier version of the manuscript. This work was supported by a Wellcome Trust Core Grant for the Wellcome Trust Centre for Human Genetics (090532/Z/09/Z). PD is supported by a Wellcome Trust Senior Investigator Award (095552/Z/11/Z). DJM is supported by a General Sir John Monash Scholarship from the General Sir John Monash Foundation, Australia. MAR is funded by a Clarendon Scholarship, NDM Studentship and Green Templeton College Award from the University of Oxford.
Author details
1Department of Statistics, University of Oxford, South Parks Road, Oxford, UK. 2Wellcome Trust Centre for Human Genetics, University of Oxford, Roosevelt
Drive, Oxford, UK.3Department of Oncology, University of Oxford, Roosevelt Drive, Oxford, UK.
Received: 7 October 2013 Accepted: 20 March 2014 Published: 31 March 2014
References
1. Green E, Guyer M, NHGR Institute:Charting a course for genomic medicine from base pairs to bedside.Nature2011,470:204–213. 2. Schrijver I, Aziz N, Farkas D, Furtado M, Gonzalez A, Greiner T, Grody W,
Hambuch T, Kalman L, Kant J, Klein R, Leonard D, Lubin I, Mao R, Nagan N, Pratt V, Sobel M, Voelkerding K, Gibson J:Opportunities and challenges associated with clinical diagnostic genome sequencing: a report of the association for molecular pathology.J Mol Diagn2012, 14:525–540.
3. Cooper G, Stone E, Asimenos G, NCS Program, Green E, Batzoglou S, Sidow A:Distribution and intensity of constraint in mammalian genomic sequence.Genome Res2005,15:901–913.
4. Kumar P, Henikoff S, Ng PC:Predicting the effects of coding non-synonymous variants on protein function using the SIFT algorithm.Nat Protoc2009,4:1073–1081.
5. Adzhubei IA, Schmidt S, Peshkin L, Ramensky VE, Gerasimova A, Bork P, Kondrashov AS, Sunyaev SR:A method and server for predicting damaging missense mutations.Nat Methods2010, 7:248–249.
6. Schwarz J, Rödelsperger C, Schuelke M, Seelow D:MutationTaster evaluates disease-causing potential of sequence alterations.Nat Methods2010,7:575–576.
7. Gingeras T:Origin of phenotypes: genes and transcripts.Genome Res 2007,17:682–690.
8. Djebali S, Davis C, Merkel A, Dobin A, Lassmann T, Mortazavi A, Tanzer A, Lagarde J, Lin W, Schlesinger F, Xue C, Marinov G, Khatun J, Williams B, Zaleski C, Rozowsky J, Röder M, Kokocinski F, Abdelhamid R, Alioto T, Antoshechkin I, Baer M, Bar N, Batut P, Bell K, Bell I, Chakrabortty S, Chen X, Chrast J, Curado J, et al:Landscape of transcription in human cells. Nature2012,489:101–108.
9. Flicek P, Amode M, Barrell D, Beal K, Brent S, Denise C, Clapham P, Coates G, Fairley S, Fitzgerald S, Gil L, Gordon L, Hendrix M, Hourlier T, Johnson N, Kähäri A, Keefe D, Keenan S, Kinsella R, Komorowska M, Koscielny G, Kulesha E, Larsson P, Longden I, William M, Muffato M, Overduin B, Pignatelli M, Pritchard B, Riat H, et al:Ensembl 2012.Nucleic Acids Res 2012,40:D84–D90.
10. Pruitt K, Tatusova T, Brown G, Maglott D:NCBI Reference sequences (RefSeq): current status, new features and genome annotation policy.Nucleic Acids Res2012,40:D130–D135.
B, Rosenbloom K, Smith K, Haussler D, Kent W:The UCSC genome browser database: update 2011.Nucleic Acids Res2011,39:D876–D882. 12. The ENCODE Project Consortium, Bernstein B, Birney E, Dunham I, Green
E, Gunter C, Snyder M:An integrated encyclopedia of DNA elements in the human genome.Nature2012,489:57–74.
13. Pruitt K, Harrow J, Harte R, Wallin C, Diekhans M, Maglott D, Searle S, Farrell C, Loveland J, Ruef B, Hart E, Suner M, Landrum M, Aken B, Ayling S, Baertsch R, Julio F, Cherry J, Curwen V, Dicuccio M, Kellis M, Lee J, Lin M, Schuster M, Shkeda A, Amid C, Brown G, Dukhanina O, Frankish A, Hart J, et al:The Consensus Coding Sequence (CCDS) project: identifying a common protein-coding gene set for the human and mouse genomes.Genome Res2009,19:1316–1323.
14. Searle S, Frankish A, Bignell A, Aken B, Derrien T, Diekhans M, Harte R, Howald C, Kokocinski F, Lin M, Tress M, Baren MV, Barnes I, Hunt T, Carvalho-Silva D, Davidson C, Donaldson S, Gilbert J, Kay M, Lloyd D, Loveland J, Mudge J, Snow C, Vamathevan J, Wilming L, Bren M, Gerstein M, Guigó R, Kellis M, Reymond A, et al:The GENCODE, human gene set.Genome Biol2010,11:P36.
15. Harrow J, Frankish A, Gonzalez J, Tapanari E, Diekhans M, Kokocinski F, Aken B, Barrell D, Zadissa A, Searle S, Barnes I, Bignell A, Boychenko V, Hunt T, Kay M, Mukherjee G, Rajan J, Gloria D, Saunders G, Steward C, Harte R, Lin M, Howald C, Tanzer A, Derrien T, Chrast J, Walters N, Balasubramanian S, Pei B, Tress M, et al:GENCODE: The reference human genome annotation for The ENCODE Project.Genome Res 2012,22:1760–1774.
16. Nirenberg M, Leder P, Bernfield M, Brimacombe R, Trupin J, Rottman F, O’Neal C:RNA codewords and protein synthesis, VII On the general nature of the RNA code.Proc Nat Acad Sci USA1965,53:1161–1168. [http://www.ncbi.nlm.nih.gov/pmc/articles/PMC301388]
17. Sherry S, Ward M, Kholodov M, Baker J, Phan L, Smigielski E, Sirotkin K: dbSNP: the NCBI database of genetic variation.Nucleic Acids Res2001, 29:308–311.
18. The 1000 Genomes Project Consortium:A map of human genome variation from population-scale sequencing.Nature2010, 467:1061–1073.
19. Wildeman M, van Ophuizen E, den Dunnen JT, Taschner PE:Improving sequence variant descriptions in mutation databases and literature using the Mutalyzer sequence variation nomenclature checker.Hum Mutat2008,29:6–13.
20. Habegger L, Balasubramanian S, Chen DZ, Khurana E, Sboner A, Harmanci A, Rozowsky J, Clarke D, Snyder M, Gerstein M:VAT: a computational framework to functionally annotate variants in personal genomes within a cloud-computing environment.Bioinformatics2012, 28:2267–2269. [http://bioinformatics.oxfordjournals.org/content/28/17/ 2267.abstract]
21. Hu H, Huff CD, Moore B, Flygare S, Reese MG, Yandell M:VAAST 2.0: improved variant classification and disease-gene identification using a conservation-controlled amino acid substitution matrix. Genet Epidemiol2013,37:622–634.
22. McKenna A, Hanna M, Banks E, Sivachenko A, Cibulskis K, Kernytsky A, Garimella K, Altshuler D, Gabriel S, Daly M, DePristo MA:The genome analysis toolkit: a MapReduce framework for analyzing next-generation DNA sequencing data.Genome Res2010, 20:1297–1303. [http://genome.cshlp.org/content/20/9/1297.abstract] 23. Cingolani P, Platts A, Coon M, Nguyen T, Wang L, Land S, Lu X, Ruden D:
A program for annotating and predicting the effects of single nucleotide polymorphisms, SnpEff: SNPs in the genome of Drosophila melanogasterstrain w1118; iso-2; iso-3.Fly2012,6:80–92. 24. Wang K, Li M, Hakonarson H:ANNOVAR: functional annotation of
genetic variants from high-throughput sequencing data.Nucleic Acids Res2010,38:e164.
25. McLaren W, Pritchard B, Rios D, Chen Y, Flicek P, Cunningham F:Deriving the consequences of genomic variants with the Ensembl API and SNP Effect Predictor.Bioinformatics2010,26:2069–2070. [http:// bioinformatics.oxfordjournals.org/content/26/16/2069.abstract] 26. Palles C, Cazier J, Howarth K, Domingo E, Jones A, Broderick P, Kemp Z,
Spain S, Guarino E, Guarino Almeida E, Salguero I, Sherborne A, Chubb D, Luis C, Ma Y, Kaur K, Dobbins S, Barclay E, Gorman M, Martin L, Kovac M, Humphray S, The Corgi Consortium, The WGS500 Consortium, Lucassen A, Holmes C, Bentley D, Donnelly P, Taylor J, Petridis C, et al:Germline mutations affecting the proofreading domains of POLE and POLD1
predispose to colorectal adenomas and carcinomas.Nature Genet 2013,45:136–144.
27. Sharma V, Fenwick A, Brockop M, Simon M, Goos J, Hoogeboom A, Brady A, Jeelani N, Lynch S, Mulliken J, Murray D, Phipps J, Sweeney E, Tomkins S, Wilson L, Bennett S, Cornall R, Broxholme J, Kanapin A, The WGS500 Consortium, Johnson D, Wall S, van der Spek P, Mathijssen I, Maxson R, Twigg S, Wilkie A:Mutations in TCF12, encoding a basic
helix-loop-helix partner of TWIST1, are a frequent cause of coronal craniosynostosis.Nat Genet2013,45:304–307.
28. Cossins J, Belaya K, Hicks D, Salih M, Finlayson S, Carboni N, Liu W, Maxwell S, Zoltowska K, Farsani G, Laval S, Seidhamed M, The WGS500 Consortium, Donnelly P, Bentley D, Simon M, Müller J, Palace J, Lochmüller H, Beeson D:Congenital myasthenic syndromes due to mutations in ALG2 and ALG14.Brain: J Neurol2013,136:944–956.
29. Babbs C, Roberts N, Luis S, Simon M, Ahmed M, Brown J, Sabry M, The WGS500 Consortium, Bentley D, Gil M, Donnelly P, Gileadi O, Ponting C, Higgs D, Buckle V:Homozygous mutations in a predicted endonuclease are a novel cause of congenital dyserythropoietic anemia type I.Haematologica2013,98:1383–1387.
30. Lise S, Clarkson Y, Perkins E, Kwasniewska A, Sadighi Akha E,
Schnekenberg R, Suminaite D, Hope J, Baker I, Gregory L, Green A, Allan C, Lamble S, Jayawant S, Quaghebeur G, Cader M, Hughes S, Armstrong R, Kanapin A, Rimmer A, Lunter G, Mathieson I, Cazier J, Buck D, Taylor J, Bentley D, Gilean M, Donnelly P, Knight S, Jackson M, et al:Recessive mutations in SPTBN2 implicateβ-III spectrin in both cognitive and motor development.PLoS Genetics2012,8:e1003074.
31. Martin HC, Kim GE, Pagnamenta AT, Murakami Y, Carvill G, Meyer E, Copley RR, Rimmer A, Barcia G, Fleming M, Kronengold J, Brown MR, Hudspith KA, Broxholme J, Kanapin A, Cazier JB, Kinoshita T, Nabbout R, The WGS500 Consortium, Bentley D, McVean G, Heavin S, Zaiwalla Z, McShane T, Mefford H, Shears D, Stewart H, Kurian MA, Scheffer IE, Blair E, et al:Clinical whole-genome sequencing in severe early-onset epilepsy reveals new genes and improves molecular diagnosis.Hum Mol Genet2014. [http://hmg.oxfordjournals.org/content/early/2014/01/ 25/hmg.ddu030.abstract]
32. Ceroni F, Simpson NH, Francks C, Baird G, Conti-Ramsden G, Clark A, Bolton PF, Hennessy ER, Donnelly P, Bentley DR, Martin H, Parr J, Pagnamenta AT, Maestrini E, Bacchelli E, Fisher SE, Newbury DF: Homozygous microdeletion of exon 5 in ZNF277 in a girl with specific language impairment.Eur J Hum Genet2014. 33. Illumina, Inc:HiSeq 2000/1000.2013. [http://www.illumina.com/
systems/hiseq_2000_1000.ilmn] Accessed 30 Jun 2013. 34. Illumina, Inc:HiSeq 2500/1500.2013. [http://www.illumina.com/
systems/hiseq_2500_1500.ilmn] Accessed 30 Jun 2013.
35. Illumina, Inc:Off-Line Basecaller (OLB).2013. [http://support.illumina. com/sequencing/sequencing_software/offline_basecaller_olb.ilmn] Accessed 30 Jun 2013.
36. Lunter G, Goodson M:Stampy: a statistical algorithm for sensitive and fast mapping of Illumina sequence reads.Genome Res2011, 21:936–939.
37. Picard.2013. [http://picard.sourceforge.net/]
38. Rimmer A, Mathieson I, Lunter G, McVean G:Platypus: an integrated variant caller.2012. [http://www.well.ox.ac.uk/platypus]
39. Danecek P, Auton A, Abecasis G, Albers CA, Banks E, DePristo MA, Handsaker RE, Lunter G, Marth GT, Sherry ST, McVean G, Durbin R, Group GPA:The variant call format and VCFtools.Bioinformatics2011, 27:2156–2158. [http://bioinformatics.oxfordjournals.org/content/27/15/ 2156.abstract]
40. Flicek P, Ahmed I, Amode M, Barrell D, Beal K, Brent S, Denise C, Clapham P, Coates G, Fairley S, Fitzgerald S, Gil L, Carlos G, Gordon L, Hourlier T, Hunt S, Juettemann T, Kähäri A, Keenan S, Komorowska M, Kulesha E, Longden I, Maurel T, William M, Muffato M, Nag R, Overduin B, Pignatelli M, Pritchard B, Pritchard E, et al:Ensembl 2013.Nucleic Acids Res2013,41:D48–D55. 41. Harte R, Farrell C, Loveland J, Suner M, Wilming L, Aken B, Barrell D,
Frankish A, Wallin C, Searle S, Diekhans M, Harrow J, Pruitt K:Tracking and coordinating an international curation effort for the CCDS project.Database: J Biol Databases Curation2012.
43. Ashurst J, Chen C, Gilbert J, Jekosch K, Keenan S, Meidl P, Searle S, Stalker J, Storey R, Trevanion S, Wilming L, Hubbard T:The vertebrate genome annotation (Vega) database.Nucleic Acids Res2005,33:D459–D465. 44. McCarthy DJ, Humburg P, Kanapin A, Rivas MA, Gaulton K, the WGS500
Consortium, Cazier JB, Donnelly P:Annotation comparison.2013. 45. The Perl Foundation:Perl Programming Language. Walnut, USA; 2013.
[http://www.perl.org/]
46. R Core Team:R: A Language and Environment for Statistical Computing. Vienna, Austria: R Foundation for Statistical Computing; 2013. [http:// www.R-project.org]
47. Python Software Foundation:Python Programming Language. Beaverton, USA; 2013. [http://www.python.org/]
48. Rhead B, Karolchik D, Kuhn RM, Hinrichs AS, Zweig AS, Fujita PA, Diekhans M, Smith KE, Rosenbloom KR, Raney BJ, Pohl A, Pheasant M, Meyer LR, Learned K, Hsu F, Hillman-Jackson J, Harte RA, Giardine B, Dreszer TR, Clawson H, Barber GP, Haussler D, Kent WJ:The UCSC genome browser database: update 2010.Nucleic Acids Res2010,38:D613–619. 49. Wang K:ANNOVAR: Functional annotation of genetic variants from
high-throughput sequencing data.2013. [http://www. openbioinformatics.org/annovar/]
50. Ensembl:Variant effect predictor.2013. [http://Sep2013.archive. ensembl.org/info/docs/tools/vep/script/vep_other.html]
51. Harrow J, Denoeud F, Frankish A, Reymond A, Chen C, Chrast J, Lagarde J, Gilbert J, Storey R, Swarbreck D, Rossier C, Ucla C, Hubbard T, Antonarakis S, Guigo R:GENCODE: producing a reference annotation for ENCODE.Genome Biol2006,7:S4.1–S4.9.
52. Coffey A, Kokocinski F, Calafato M, Scott C, Palta P, Drury E, Joyce C, Leproust E, Harrow J, Hunt S, Lehesjoki A, Turner D, Hubbard T, Palotie A: The GENCODE exome: sequencing the complete human exome.Eur J Hum Genet2011,19:827–831.
53. Derrien T, Johnson R, Bussotti G, Tanzer A, Djebali S, Tilgner H, Guernec G, Martin D, Merkel A, Knowles D, Lagarde J, Veeravalli L, Ruan X, Ruan Y, Lassmann T, Carninci P, Brown J, Lipovich L, Gonzalez J, Thomas M, Davis C, Shiekhattar R, Gingeras T, Hubbard T, Notredame C, Harrow J, Guigó R: The GENCODE v7 catalog of human long noncoding RNAs: analysis of their gene structure, evolution, and expression.Genome Res2012, 22:1775–1789.
54. Eilbeck K, Lewis S, Mungall C, Yandell M, Stein L, Durbin R, Ashburner M: The sequence ontology: a tool for the unification of genome annotations.Genome Biol2005,6:R44. [http://genomebiology.com/ 2005/6/5/R44]
55. MacArthur DG, Balasubramanian S, Frankish A, Huang N, Morris J, Walter K, Jostins L, Habegger L, Pickrell JK, Montgomery SB, Albers CA, Zhang ZD, Conrad DF, Lunter G, Zheng H, Ayub Q, DePristo MA, Banks E, Hu M, Handsaker RE, Rosenfeld JA, Fromer M, Jin M, Mu XJ, Khurana E, Ye K, Kay M, Saunders GI, Suner MM, Hunt T, et al:A systematic survey of loss-of-function variants in human protein-coding genes.Science 2012,335:823–828. [http://www.sciencemag.org/cgi/doi/10.1126/ science.1215040]
56. Loman N, Misra R, Dallman T, Constantinidou C, Gharbia S, Wain J, Pallen M:Performance comparison of benchtop high-throughput sequencing platforms.Nat Biotechnol2012,30:434–439. 57. Hatem A, Bozdag D, Toland A, Çatalyürek UV:Benchmarking short
sequence mapping tools.BMC Bioinformatics2013,14:184. 58. Yu X, Sun S:Comparing a few SNP calling algorithms using
low-coverage sequencing data.BMC Bioinformatics2013,14:274. 59. O’Rawe J, Jiang T, Sun G, Wu Y, Wang W, Hu J, Bodily P, Tian L, Hakonarson
H, Johnson W, Wei Z, Wang K, Lyon G:Low concordance of multiple variant-calling pipelines: practical implications for exome and genome sequencing.Genome Med2013,5:28.
60. Pabinger S, Dander A, Fischer M, Snajder R, Sperk M, Efremova M, Krabichler B, Speicher MR, Zschocke J, Trajanoski Z:A survey of tools for variant analysis of next-generation genome sequencing data.Brief Bioinform2013. [http://bib.oxfordjournals.org/content/early/2013/01/21/ bib.bbs086.abstract]
doi:10.1186/gm543
Cite this article as:McCarthyet al.:Choice of transcripts and software has a large effect on variant annotation.Genome Medicine20146:26.
Submit your next manuscript to BioMed Central and take full advantage of:
• Convenient online submission
• Thorough peer review
• No space constraints or color figure charges
• Immediate publication on acceptance
• Inclusion in PubMed, CAS, Scopus and Google Scholar
• Research which is freely available for redistribution