M E T H O D O L O G Y
Open Access
A multi-objective gene clustering
algorithm guided by apriori biological
knowledge with intensification and
diversification strategies
Jorge Parraga-Alava
1,2, Marcio Dorn
3and Mario Inostroza-Ponta
1**Correspondence: [email protected] 1Centre for Biotechnology and Bioengineering (CeBiB), Departamento de Ingeniería Informática, Universidad de Santiago de Chile, Av. Ecuador 3659, Santiago, Chile Full list of author information is available at the end of the article
Abstract
Background: Biologists aim to understand the genetic background of diseases, metabolic disorders or any other genetic condition. Microarrays are one of the main high-throughput technologies for collecting information about the behaviour of genetic information on different conditions. In order to analyse this data, clustering arises as one of the main techniques used, and it aims at finding groups of genes that have some criterion in common, like similar expression profile. However, the problem of finding groups is normally multi dimensional, making necessary to approach the clustering as a multi-objective problem where various cluster validity indexes are simultaneously optimised. They are usually based on criteria like compactness and separation, which may not be sufficient since they can not guarantee the generation of clusters that have both similar expression patterns and biological coherence.
Method: We propose a Multi-Objective Clustering algorithm Guided by a-Priori Biological Knowledge (MOC-GaPBK) to find clusters of genes with high levels of co-expression, biological coherence, and also good compactness and separation. Cluster quality indexes are used to optimise simultaneously gene relationships at expression level and biological functionality. Our proposal also includes intensification and diversification strategies to improve the search process.
Results: The effectiveness of the proposed algorithm is demonstrated on four publicly available datasets. Comparative studies of the use of different objective functions and other widely used microarray clustering techniques are reported. Statistical, visual and biological significance tests are carried out to show the superiority of the proposed algorithm.
Conclusions: Integrating a-priori biological knowledge into a multi-objective approach and using intensification and diversification strategies allow the proposed algorithm to find solutions with higher quality than other microarray clustering techniques available in the literature in terms of co-expression, biological coherence, compactness and separation.
Keywords: Multi-objective clustering (MOC), Gene expression data, External biological knowledge, Path-relinking (PR), Pareto local search (PLS)
Background
During the last two decades, the explosion in the increase of DNA microarray datasets available has promoted the application of machine learning methods for the understand-ing of the genomic data. A DNA microarray is used to collect information regardunderstand-ing gene expression level [1] under different conditions like a time series during a biological pro-cess, experiments of different tissue samples, among others [2]. This high-throughput technology has allowed a fast progress in biological and biomedical research [3], and it has facilitated the study of problems such as differential gene expression [4,5], patterns of genes with (dis)similar expression levels [6–8], prediction of response to treatment [9,10] and detection of gene mutations [11].
Clustering has proved to be a useful unsupervised learning technique for gene expres-sion data analysis [12]. The goal is to find a partition of genetics elements represented in the microarray intokdistinct groups, wherekis the number of clusters which may or may not be known in advance. It is expected that genetic elements such as gene, EST contigs, non-coding sequences, among others, with similar expression profiles be put into a single cluster [13] as a way to reveal hidden patterns. Carrying out clustering is not a trivial task, in fact this unsupervised learning technique currently remains a complex and challeng-ing task which was proved to be an NP-hard problem [14]. Clustering can also be seen as an optimisation problem [15] where a cluster index (objective function) is optimised to obtain clustering solutions of high quality.
Several clustering algorithms for gene expression data have been proposed during the last years [16–24]. They are based on guilt-by-association paradigm [25], i.e. groups of genetics elements which are associated, share similar expression profiles are more likely to share function. In recent years, this paradigm has been reformulated because the opti-misation of a single cluster quality index based on expression levels can cause some issues. The fact that two genetic elements have similar expression patterns can be because they share some functionality, but also because of noise, which may lead to the misidentifi-cation of biological relationships [26]. Because of the above, some authors used external biological knowledge [12,27] as another source of information about genetics elements as a way to address this situation and to find clusters with more biological coherence. Often external biological knowledge concerns the use of repositories such as the Gene Ontology Project (GO) [28] or Kyoto Encyclopedia of Genes and Genomes (KEGG) [29]. However, this biological knowledge can be partial, i.e. the information could be available only for a subset of the genetic elements. Clearly, using only a quality index based on external bio-logical knowledge will lead to a partition of the data with clusters previously discovered and thereby extract repetitive information.
The clustering problem can be naturally address as a muti-objective problem [30], where we want to improve objectives related to expression similarity and biological coherence (one or more sources). The multi-objective clustering (MOC) problem can be described as:
Pt
C∗=min
C∈Pt(C),t=1,. . .,m. (1) where is the set of all feasible clustering solutions, C is a clustering solution, and Pt,t=1,. . .,mis a set ofmdifferent objective functions (quality indexes), i.e. that clus-teringC∗⊆corresponds to clustering solutions that have the best optimisedmcriteria P[30,31].
In MOC problems, we have several clustering solutionsC∗that correspond to the opti-misation of objective functions that tend to be in conflict [32], i.e. improving one objective involves worsening another. Then, it is required to reach a “tradeoff ” where all objective functions (quality indexes) are satisfied to an acceptable degree which leads to find a set of best solutions called non-dominated solutions [30].
Non-dominated solutionsGiven two clustering solutionsC1andC2∈, solutionC1is
said todominatesolutionC2(denoted asC1≺C2) (minimisation) if and only if:
∀t:Pt(C1)≤Pt(C2)∧ ∃t:Pt(C1) <Pt(C2) (2)
Pareto optimal setPareto optimal setis defined as:
= {C∈: ∃C∈:C≺C} (3) Thus, a Pareto optimal setcorresponds to a set of non-dominated solutions, such that there is no other solution inthat dominates any of them.
Pareto frontThe Pareto FrontF∗corresponds to the image of Pareto optimal set, i.e. to the vectors of criterion functions (quality indexes) to.
respectively. The main contributions of this work are (1) the integration of informa-tion of genetic elements regarding their levels of expression and biological funcinforma-tions during the optimisation of cluster quality indexes, and (2) the proposal of ad-hoc local search strategies that exploit both the memory mechanism and neighbourhood principles of Path-Relinking (PR) and Pareto Local Search (PLS) respectively, using a multi-objective approach. This work is tested against state of the art algorithms in order to show the benefits of both: using a multi-objective approach to tackle the clustering of expression data and the method proposed is able to discover clus-ters with more stronger co-relation and common biological properties than literature alternatives.
Method
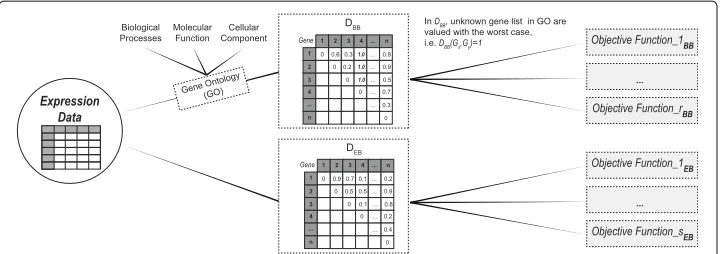
We call our method “Multi-Objective Clustering Guided by aPriori Biological Knowl-edge” (MOC-GaPBK). The method uses biological knowledge by the means of anno-tations of genetic elements with Gene Ontology (GO) terms. The integration of this biological knowledge is performed by the computation of the biology-based (DBB) and the expression-based (DEB) distances.
Biology-based distance (DBB) We use the Wang functional similarity (WS) [41]. It is an information content (IC) based metric which determines the similarity of two Gene Ontology (GO) terms based on both the location of these terms in the GO graph and their relation with their ancestor term. Given two elementsGxandGyannotated by GO term setsGO1 =
go11,go12,. . .,go1m
andGO2 =
go21,go22,. . .,go2m
respectively, their WS is represented asWSGx,Gy
with values that can vary between 0 to 1. For more detail on the computation of Wang similarity refer to [41]. We transform the Wang similarity into a distance measure using function4.
DBBGx,Gy=1−WSGx,Gy (4)
Expression-based distance (DEB) We usePearsoncorrelation coefficient (ρ). It is actu-ally a measure of similarity indicating how and how strongly level expression of two elements (Gx,Gy), formdifferent conditions, are related. We compute:
DEB
Gx,Gy
=1−ρ (Gx,Gy) (5) In Fig.1we show the incorporation process of the biological knowledge. First, we com-pute the distance matricesDEBandDBB. Then, each objective function is computed for two cases: (1) using biology-based distance (DBB) and (2) using expression-based distance (DEB). Thus, we will be simultaneously optimising expression level similarity and bio-logical functionality to discover clusters with high levels of co-expression and biobio-logical coherence.
Multi-objective clustering process
Algorithm 1Pseudo-code of MOC-GaPBK Algorithm
Input: Gene expression data.
Output: Non-dominated clustering solutions.
1: Calculate expression-based distance matrix (DEB) between each pair of genes.
2: Calculate biology-based distance matrix (DBB) between each pair of genes.
Start multi-objective clustering process
3: Setv=0.
4: Create initial population|P0| =N.
5: whilestopping criteria have not been satisfieddo
6: Select parents fromPv.
7: Create an offspring population|Qv| =N.
8: Rv=Pv∪Qv.
9: Rv=NON-DOMINATEDSORTING-CROWDINGDISTANCE(Rv)
10: Rv=F1.
Start intensification and diversification strategy
11: Apply Multi-objective Path-relinking (MOPR) onRv.
12: UpdateRv=NON-DOMINATEDSORTING-CROWDINGDISTANCE(Rv)
13: Apply Pareto Local Search (PLS) onRv.
14: UpdateRv=NON-DOMINATEDSORTING-CROWDINGDISTANCE(Rv)
End intensification and diversification strategy
15: CreatePv+1based onRvas follows:
16: if(|F1|<Nthen
17: Create a random populationPr.
18: SetPv+1=F1∪Pr.
19: else
20: SetPv+1=F1.
21: end if
22: Setv=v+1.
23: end while
End multi-objective clustering process
24: returnNon-dominated clustering solutions inRv.
Algorithm 1 shows the pseudo-code of theMOC-GaPBKalgorithm. First, it computes the expression (DEB) and biological distance (DBB) matrices (lines 1-2) in order to inte-grate the biological knowledge. Then the algorithm creates an initial populationP0 of
Fig. 1Schematic representation of the integration of biological knowledge to MOC-GaPBK
F2to non-dominated solutions remaining after eliminating those withF1. The process is
repeated until it sorts all solutions inRv. Then, inRv, only those non-dominated solutions, that is, the solutions ranked asF1, are maintained (lines 9-10). TheRvpopulation is used as input for the intensification and diversification strategies (lines 11-14). The next pop-ulationPv+1is created by selecting the solutions labeled asF1inRv(line 20). If|F1|<N,
the algorithm complements the population with random solutionsPr,Pv+1 = F1∪Pr (lines 16-18). On each generation the algorithm evaluates whether it reaches either of the two stopping criteria: (1) when the number of generations is reached and (2) when during a certain number of generations have passed without changes in the values of the objec-tive functions of the solutions in the Pareto frontier. Finally, the algorithm returns the set of non-dominated solutions (Pareto Front) inRv(line 24).
Chromosome encoding
We use an integer encoding to represent a solution. Each number represents a cluster medoid which is the most central element located in a cluster, i.e. whose sum of the dis-tances to another element of the cluster is minimum [44]. Each chromosomechhas the same length as the number of clustersK, and each positionchican have an integer value from 1 ton, nbeing the number of elements in the dataset. For instance, in case of a dataset with 100 elements, the chromosome [1 6 19 83 14 3] represents six clusters with 1, 6, 19, 83, 14, and 3 as the centre of each clusters.
Initial population
The initial population is generated as follows: first, the 50% of chromosomes is randomly created. Second, the remaining 50% is created based on a single genetic algorithm (SGA) which uses an integer encoding to represent a solution,k-1 point crossoverand controller-random mutationas evolutionary operators. Here, we optimise the PBM [45] index which is calculated using the distances between the points and their barycenters and the dis-tances between the barycenters themselves. This initialisation helps the convergence because it gives to the multi-objective clustering algorithm good initial solutions.
Selection
Crossover and mutation
We use a (k-1)-point crossover, and a controller-random mutation [46] as evolution-ary operators. In the crossover,k-1 points on both individuals (parents) are randomly selected. All cluster medoid between those points are swapped between the two individu-als. In controller-random mutation, a random position is selected from the chromosome and the corresponding element is replaced by a randomly chosen element that is not in the chromosome.
Objective functions
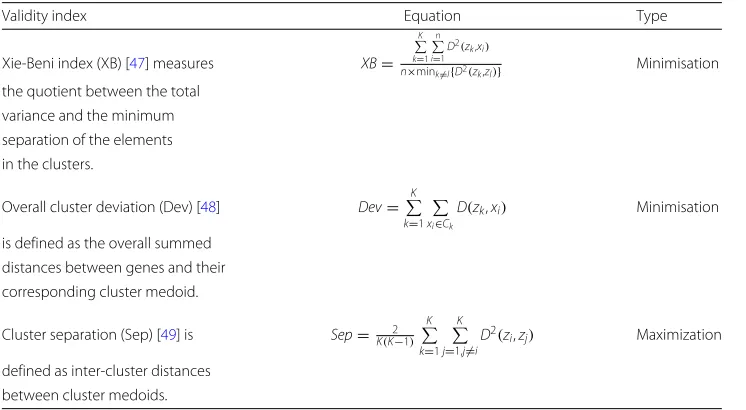
Three cluster validity indexes are selected as objective functions:Xie-Beni [47], Over-all Cluster Deviation [48] and Cluster Separation [49]. They have been chosen because they are based on medoids and they have been used as objective func-tions in other multi-objective evolutionary clustering algorithms, since they are able to measure compactness and separation of the clusters which are the main prop-erties evaluated in clustering task. They allow the multi-objective evolutionary clus-tering algorithms to be able to optimise simultaneously multiple characteristics of the data, while encouraging the formation of more homogeneous clusters and more higher separation between clusters at the same time. Here, we assumed notations as in [44]:
• n: Number of elements in dataset. • K : Number of clusters.
• xi:i th element in dataset, withi=1, 2,. . .,n • zk:k th cluster medoid.
• C : Set of all clusters. • Ck:k th cluster.
Table 1 shows a summary of the three cluster validity indexes used as objective functions.
Table 1Cluster validity indexes used as objective functions
Validity index Equation Type
Xie-Beni index (XB) [47] measures XB= K k=1
n i=1
D2(zk,xi)
n×mink=l{D2(zk,zl)} Minimisation
the quotient between the total variance and the minimum
separation of the elements in the clusters.
Overall cluster deviation (Dev) [48] Dev= K
k=1
xi∈Ck
D(zk,xi) Minimisation
is defined as the overall summed distances between genes and their corresponding cluster medoid.
Cluster separation (Sep) [49] is Sep= K(K2−1) K
k=1
K
j=1,j=i
D2(zi,zj) Maximization
defined as inter-cluster distances between cluster medoids.
Note that validity indices in Table1, the distanceDis computed using both expression profiles-based distance (DEB) and biological-based distance (DBB). Thus, each objective function has two versions: expression-based (EB) and biology-based (BB) indices which consider Pearson correlation (ρ) and Wang functional similarity (WS) respectively. For instance, whenXBindex is used, we have two objective functions: XBEBand XBBB.
Intensification and diversification strategies
MOC-GaPBK algorithm applies intensification and diversification strategies where promising regions are thoroughly explored. The strategies are based on Path-relinking (PR) [42] and Pareto Local Search (PLS) [43], respectively.
Multi-objective path-relinking
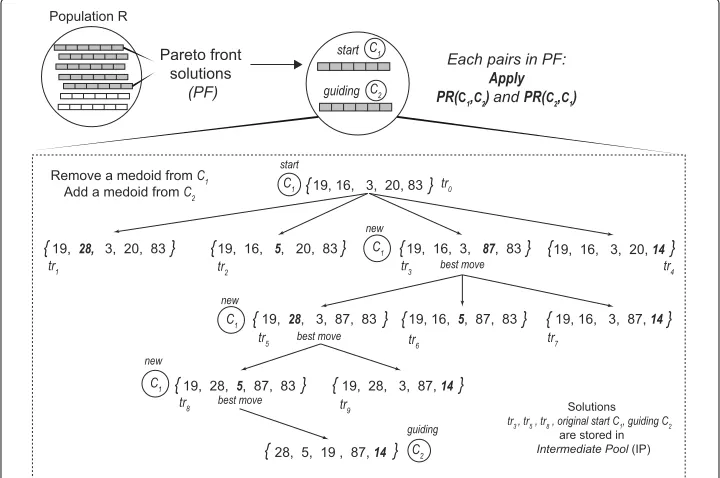
PR was originally proposed as an approach to integrate intensification strategy in the context of tabu search or scatter search. PR generates new solutions by exploring trajecto-ries that connect high-quality solutions. It starts from one of these solutions, calledstart solutions, and generates a trajectory in the neighbourhood space that leads toward the other solutions, calledguiding solutions[50]. Our PR strategy is based on the implemen-tation presented in [51,52] but we adapted it to multi-objective clustering. Figure2shows a schematic representation for the construction of trajectories in the multi-objective path-relinking (MOPR).
The algorithm builds trajectories between solutions as follows: LetC1andC2be two
solutions obtained from the Pareto front (PF) of the multi-objective clustering process. The Path-relinking procedure PR(C1,C2)starts with the initial solutionC1, and gradually
transforms it into solutionC2, by swapping out medoids inC1and replacing them with
medoids inC2. To choose the initial solutionsC1andC2, the algorithm selects the two
solutions with the lowest Pareto ranking and the highest crowding distance. Then, for
the next pair of solutionsC1 andC2, we setC1 ←C2as the current initial solution and
it selectsC2 as a new solution from the Pareto front with the lowest Pareto ranking and the highest crowding distance not considered before. This process continues until each solution in the Pareto front (PF) has been selected.
To gradually transformC1intoC2, only non-repeated medoids are considered as
fol-lows: LetMC1be the set of medoids inC1. LetMC1−MC2be the set of medoids inC1not
present inC2and symmetrically, letMC2 −MC1be the set of medoids inC2not present
inC1. Lettr0(C1,C2)= C1be the start solution in the trajectoryTR(C1,C2)fromC1to
C2. To obtain the next solutiontr1(C1,C2)in the trajectoryTR(C1,C2), we remove from
C1a single medoidzk ∈ MC1 −MC2, and replace the empty position adding a medoid
zl ∈ MC2−MC1. To choose the solution intrnwiththe best movein each trajectory, we
conducted a non-dominated and crowding distance sorting. After that, we select the top ranked solution which is the new start solutionC1. The procedure is repeated until we
reach the guiding solutionC2. Finally, each solution withthe best moveand original start
and guiding solutions are stored in an set of intermediate pool (IP) solutions.
In our experiments, we applyPR(C1,C2)andPR(C2,C1)for each pairC1andC2in PF.
Then, we merge IP and PF solutions and we re-check their non-dominating and crowding distance levels. The non-dominated solutions labelled asF1are returned as the output of
the procedure and it corresponds to the new Population R.
Pareto local search
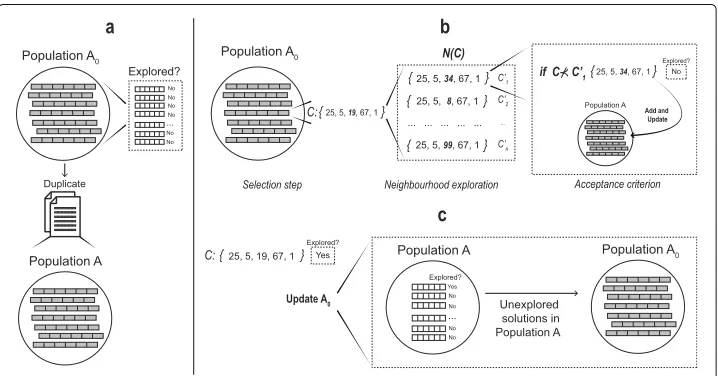
To improve the Pareto solutions found by MOPR procedure, we implement a Pareto Local Search (PLS) [40] method based on the Pareto dominance criterion. PLS explores the Pareto neighbourhood of a set of non-dominated solutions until it reaches a local optimal Pareto front [53]. A schematic representation of PLS is shown in Fig.3.
Here, the PLS procedure receives a population of non-dominated solutionsA0which
are marked as unexplored. Then they are duplicated in a populationA(Fig.3a). An itera-tive process of three steps is performed.Selection steprandomly selects a solutionCfrom populationA0. After,neighbourhood explorationchooses a medoidzkofC, which is then
replaced in all neighbouring solutionsN(C) =C1,C2,. . .,Cnby a medoidzkthat has not been assigned to the current solutions inN(C). Meanwhile, a dominating concept is used asacceptance criterionstep, .i.e. the procedure will evaluate eachC ∈N(C)and if C⊀Cit will mark as unexplored toCand the populationAis updated eliminating those solutions are dominated byC(Fig.3b). Once allC ∈N(C)are evaluated, solutionCis marked as explored and populationA0is updated filling only with the unexplored
solu-tions from populationA(Fig.3c). PLS ends when the populationA0has no solutions, i.e.,
when all the solutions in populationAhave been explored, and they correspond to the new PopulationR.
Selection of a single solution
The MOC-GaPBK algorithm produces a final Pareto front (PF) with a collection of one or more non-dominated solutions. All of these solutions are high-quality gene expression data partitions. To compare our results with those available in the literature, we select a single solution based onSilhouetteindex (S) [54] using the last non-dominated solutions set in populationR. The solution with the maximum value ofSindex is selected.
TheSilhouetteindex quantifies the goodness of any clustering solutionC measuring how similar an element is to its own cluster (compactness) compared to other groups (separation). It is calculated as follows:
S(C)= 1 n
n
i=1
si (6)
This index score lies between−1 and 1, so that values close to 1 indicates better clustering solutions. To more detail ofS(C)equation refer to [44].
Results
All the algorithms used in the experiment were implemented using R [55] version 3.2.5 and computational tests performed on a computer with Intel Xeon E5-2650V4 30 MB, 4 CPUs, 2.2Ghz, 96 cores/threads, 128GB RAM, 4TB. The distance between expres-sion profiles were calculated using functions of the “amap” library [56]. The distance of biological functionality using the “GOSemSim” library [57].
Datasets
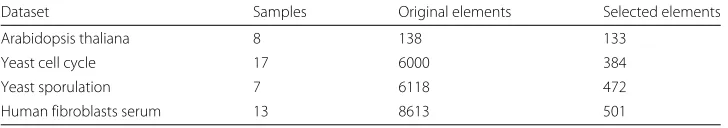
Datasets used for experiments correspond to four real-life microarray gene expression datasets:arabidopsis thaliana[58],yeast cell cycle[59],yeast cell sporulation[60], and human fibroblasts serum[61] which were taken from here [62]. Here, duplicated elements and missing values of expression levels are removed. Expression levels are normalised so that each row has mean 0 and variance 1 (Table2).
Table 2Gene expression datasets used in experiments
Dataset Samples Original elements Selected elements
Arabidopsis thaliana 8 138 133
Yeast cell cycle 17 6000 384
Yeast sporulation 7 6118 472
Experimental parameters
The algorithm is executed with the following parameters: number of generations=100, population size= 50, crossover probability= 0.80, mutation probability= 0.01, gen-erations without improvement = 10, number of clusters k = {4, 5, 6}. Evolutionary parameters andk values, were set up considering similar configurations used by other MOC algorithms in [34,35,63].
Performance evaluation
To evaluate the performance of MOC-GaPBK algorithm, first we determine the best combination of objective functions regarding the hypervolume (HV) indicator. Then, we compare the performance of MOC-GaPBK facing contestant clustering algorithms, under three aspects: (1) levels of co-expression, (2) biological coher-ence, and (3) compactness and separation. To carry out that, we use Eisen [64] and cluster profile [65] plots; annotation enrichment analysis [66]; and Silhouette index, respectively.
Hypervolume (HV) It is a unary metric that measures the volume (area in our case) in the objective function space covered by members of a Pareto set PS [67]. The hypervolume for every solution i ∈ PS computes an area ai regarding a ref-erence point W. Thus, the union of all areas ai define the hypervolume value as follows:
HV =area ⎛ ⎝|PS|
i=1
ai ⎞
⎠ (7)
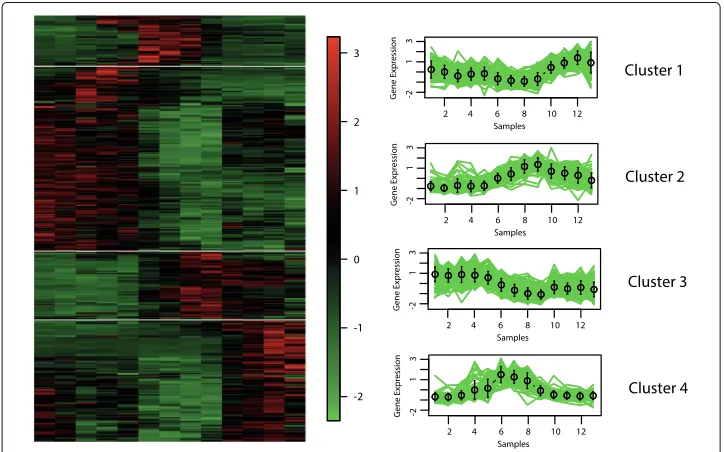
Eisen plot It is a tool used in microarray experiment for visual representation of gene expression profiles. It is achieved using heat map and colouring values that usually are red, black and green [65]. Here, Eisen plot is used to show clustering results so that, similar colours are grouped together, showing that the expression profiles of the genes of a cluster are similar to each other.
Cluster profile plot This tool shows gene expression of microarray usingx,ymatrix rep-resentation of time points and level expression [65], respectively. Here, the normalised level expression values (in green) of genes in each cluster are used. Additionally, the average expression along with the standard deviation (in black) are included.
p=1− k−1
i=0
f i
g−f n−i
g n
(8)
wheref represents the total number of genes in aGOcategory andgthe total number of genes within the genome. Thus, this test measures the degree of overlap between the genes in each group and the genes inGOcategory.
Experimental results
Effect of objective functions
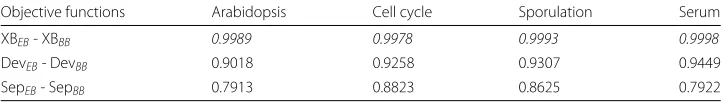
To determine the effect of the objective functions during data clustering, we show the best Pareto front regarding hypervolume values obtained over 20 consecutive runs for each one in all datasets (Table3).
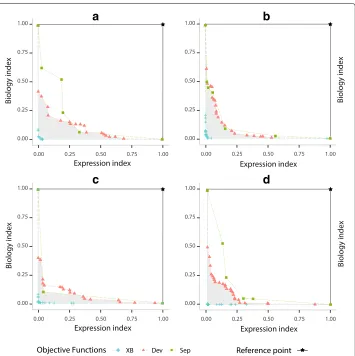
To calculate the objective space covered by such objective functions, we use(1, 1) as normalised reference pointW. Note that higher hypervolume values implies better results from a multi-objective point of view. In Fig.4, we show the best Pareto fronts for each objective functions. Here, further away non-dominated solutions are from the reference point, a larger size of the solutions space will be covered and then better results will be achieved.
Effect of local search strategies
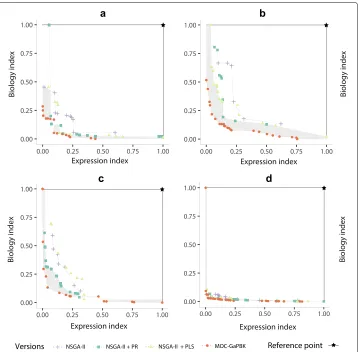
Similarly, to determine the effect of local search methods to improve the multi-objective gene clustering process, in Fig.5, we compare the best Pareto front obtained by MOC-GaPBK algorithm and three variations: using only NSGA-II, NSGA-II + Path-Relinking (PR) and NSGA-II + Pareto Local Search (PLS). To compute it, we consider the best com-bination (Table3) of objective functions, i.e., XBEBand XBBBover 20 consecutive runs for allkvalues and datasets.
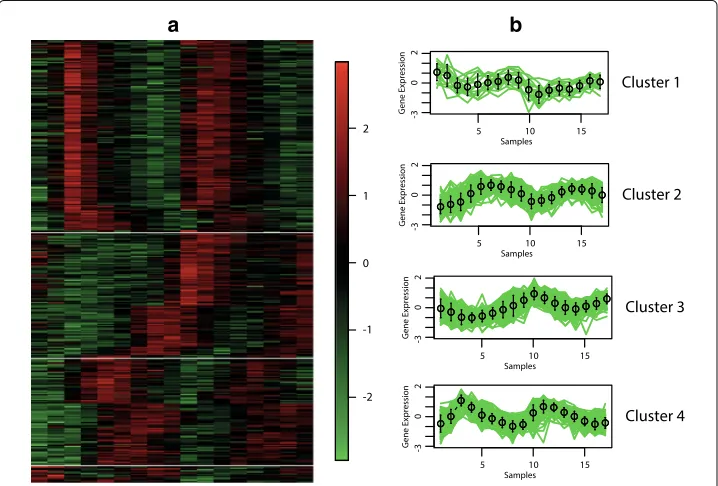
Eisen and cluster profile plots
The best hypervolume value is reached when the objective functions XBEBand XBBBare optimised. In Figs.6,7,8and9, we show the Eisen and cluster profile plots of the solution with the best silhouette value found byMOC-GaPBK. In Eisen plot, clusters are separated using a white line and genes are ordered according to the group to which they belong. In Eisen plots, we can see that each cluster has similar color patterns, denoting that expression profiles throughout the samples of the genes within each cluster are similar to each other. In the same way, the cluster profile plots show how the curve that represents the expression profiles of genes along the samples are similar within cluster. However, expression profiles inter clusters differ from each other. Hence, both plots show that our
Table 3Best hypervolume values achieved by objective functions over 20 runs in all datasets
Objective functions Arabidopsis Cell cycle Sporulation Serum
XBEB- XBBB 0.9989 0.9978 0.9993 0.9998
DevEB- DevBB 0.9018 0.9258 0.9307 0.9449
SepEB- SepBB 0.7913 0.8823 0.8625 0.7922
a
b
c
d
Fig. 4Comparison of objective functions based on expression (DEB) and biological (DBB) informations
optimised byMOC-GaPBKalgorithm. Pareto fronts foraArabidopsis Thaliana,bYeast Cell Cycle,cYeast Sporulation anddHuman Fibroblast Serum
algorithm, with objective functions XBEB and XBBB, achieves superior performance to obtain co-expressed genes.
Annotation enrichment analysis
To demonstrate the biological coherence of clusters yield byMOC-GaPBKalgorithm, we use theFatiGO[69] web tool. It applies a functional enrichment test that evaluates the number of genes in each cluster annotated to a particular GO term. We consider the gene-annotation tables based on thebiological process GOterm at 1% of significant level. Table4contains thethreemost significant GO terms along with theirp-values measured by the cumulative hypergeometric distribution.
Discussion
a b
Fig. 5Comparison of MOC-GaPBK algorithm and its variations regarding hypervolume indicator with Expression Index (DEB) and Biology Index (DBB). The best Pareto fronts foraArabidopsis Thaliana,bYeast Cell
Cycle,cYeast Sporulation anddHuman Fibroblast Serum
most of the solutions in the Pareto optimal set of the other objective functions, due to being further away from the reference point. In the same figure, the gray area represents the objective space covered only by the objective functions XBEBand XBBB. Such situa-tions show that they are the best combination to perform the gene clustering process with ourMOC-GaPBKalgorithm.
a b
a b
Fig. 7Clustering solution yield byMOC-GaPBKalgorithm in Yeast Cell Cycle.aEisen plotbCluster profile plots
We also compare the performance of multi-objective optimization process regarding the incorporation of local search strategies. Figure 5 shows the best Pareto frontiers yield by MOC-GaPBK and its variations on each of the four datasets. Generaly speak-ing, the use of local search improves the solutions found by the NSGA-II, but it is not conclusive since for all datasets there are solutions found by NSGA-II that dominates some of the solutions produced when a single local search strategy is used. However, the Pareto frontier produced by MOC-GaPBK mostly dominates the Pareto frontiers
Fig. 9Clustering solution yield byMOC-GaPBKalgorithm in Human Fibroblasts Serum.aEisen plotbCluster profile plots
produced by the other algorithms. In particular, for the case of the Yeast Cell Cycle data set (Fig. 5b), our proposal dominates all the solutions of the other algorithm, while in the other cases (Fig.5a, candd) there are only a few solutions that are non dominated. Also, MOC-GaPBK always dominates all the solutions found by NSGA-II. In all of the figures the gray area shows the space that is being covered by MOC-GaPBK and not by the others. These results show the positive effect in the NSGA-II of including local search strategies, which has been reported on other works, but it also shows that our algorithm overcome simple combinations of NSGA-II and local search strategies.
We show the performance ofMOC-GaPBKalgorithm optimizing XBEB- XBBB com-pared with Semi-FeaClustMOO [70], MO-fuzzy [63], MOGA [34], SOM [71] and Average linkage [72] clustering techniques. All results are exposed for four real life gene expres-sion data sets, i.e., Arabidopsis Thaliana, Yeast Cell Cycle, Yeast Sporulation, and Human Fibroblasts Serum.
Table 4The most significant GO terms in datasets
Dataset Cluster Significant GO term p-value
Arabidopsis Cluster 1 Response to wounding(GO:0009611) 3.63E-16
Cellular biogenic amine metabolic process(GO:0006576) 1.00E-14 Cellular amine metabolic process(GO:0044106) 1.62E-14
Cluster 2 Lipid catabolic process(GO:0016042) 1.91E-09
Response to wounding(GO:0009611) 9.68E-09
Phenylpropanoid metabolic process(GO:0009698) 7.61E-08 Cluster 3 Response to organonitrogen compound(GO:0010243) 5.36E-11
Response to chitin(GO:0010200) 9.51E-10
Jasmonic acid mediated signaling pathway(GO:0009867) 3.03E-09
Cluster 4 Jasmonic acid biosynthetic process(GO:0009695) 7.76E-04 Jasmonic acid metabolic process(GO:0009694) 1.08E-03
Lipid oxidation(GO:0034440) 1.35E-03
Cell cycle Cluster 1 Positive regulation of transport(GO:0051050) 1.84E-04
Regulation of transport(GO:0051049) 2.93E-03
Regulation of localization(GO:0032879) 3.39E-03
Cluster 2 Cell cycle(GO:0007049) 8.13E-17
Cell division(GO:0051301) 3.26E-16
Cell cycle process(GO:0022402) 2.30E-14
Cluster 3 Cell cycle phase(GO:0022403) 2.34E-10
Mitotic interphase(GO:0051329) 2.71E-10
Interphase(GO:0051325) 2.71E-10
Cluster 4 DNA replication(GO:0006260) 1.24E-16
DNA metabolic process(GO:0006259) 4.36E-16
Cell cycle(GO:0007049) 1.29E-11
Sporulation Cluster 1 Glucose metabolic process(GO:0006006) 3.69E-08 Carbohydrate metabolic process(GO:0005975) 1.04E-07 Hexose metabolic process(GO:0019318) 2.49E-07
Cluster 2 Oxoacid metabolic process(GO:0043436) 1.76E-05 Organic acid metabolic process(GO:0006082) 1.80E-05 Monocarboxylic acid transport(GO:0015718) 4.42E-05
Cluster 3 Cell cycle process(GO:0022402) 2.76E-19
Cell cycle(GO:0007049) 5.83E-19
Anatomical formation in morphogenesis (GO:0048646) 6.88E-19
Cluster 4 Translation(GO:0006412) 1.03E-28
Ribosome biogenesis(GO:0042254) 1.84E-08
Ribonucleoprotein complex biogenesis(GO:0022613) 6.70E-08
Serum Cluster 1 Mitotic recombination(GO:0006312) 1.55E-11
G2/M transition of mitotic cell cycle(GO:0000086) 1.68E-09
Chromosome segregation(GO:0007059) 1.74E-09
Cluster 2 Cellular response to zinc ion(GO:0071294) 5.25E-08
Striated muscle cell differentiation(GO:0051146) 5.98E-07
Response to zinc ion(GO:0010043) 1.26E-06
Cluster 3 Cholesterol metabolic process(GO:0008203) 7.46E-14 Cholesterol biosynthetic process(GO:0006695) 1.39E-13 Sterol biosynthetic process(GO:0016126) 2.95E-13
Cluster 4 Multi-multicellular organism process(GO:0044706) 8.55E-16 Regulation of smooth muscle cell proliferation(GO:0048660) 1.50E-14 Smooth muscle cell proliferation(GO:0048659) 1.84E-14
Table 5Mean values of Silhouette index over 20 runs of different algorithms
Algorithm Arabidopsis Cell cycle Sporulation Serum
MOC-GaPBK 0.49 0.63 0.80 0.58
Semi-FeaClustMOO 0.46 0.50 0.70 0.44
MO fuzzy 0.41 0.43 0.59 0.40
MOGA 0.40 0.42 0.58 0.38
SOM 0.23 0.38 0.58 0.34
Avg. link. 0.32 0.44 0.50 0.36
In italics, we highlight the highest values
To detect whether MOC-GaPBK and the competitive clustering techniques operate similarly or not from statistical point of view, we carry out the Friedman test [73]. In this sense, in Table6we perform a ranking to each clustering method regarding the mean silhouette index in each dataset.
The test verifies whether the measured average ranks are significantly different from the mean silhouette rank. The method obtains ap-value of 0.0033 indicating that the difference in the mean silhouette rank obtained by MOC-GaPBK algorithm is signif-icant. In fact, our proposed method has an average rank of 1 since it always obtains the best silhouette values in the experimental datasets, while its closest competitor is Semi-FeaClustMOO algorithm with an average rank of 2. Clearly, it indicates that our approach obtains groups with better values of compactness and separation than competitive clustering techniques.
To visually demonstrate that clusters yield byMOC-GaPBK have high co-expression patterns, we use Eisen and cluster profile plot. To do this, first we determine the best solution (regarding silhouette index), comparing all solutions yield by our method. So, we observe thatMOC-GaPBKhas determined that four is the best number of clusterskfor all datasets. Such number of clusterskmatches with some values of competitive algorithms [34,74]. In Figs.6,7,8and9, we plot clustering solutions with best silhouette index. For instance, for Yeast Sporulation dataset (Fig.8a),MOC-GaPBK identifies as appropriate partitioningk=4. In such figure, it is evident that expression profiles of the genes in each cluster have similar expression profiles generating similar colour patterns throughout the samples. We can also see (Fig.8b) that expression patterns of the four clusters of genes differ from each other, while the patterns within a cluster are very similar. So, for example, while cluster 1 has high expression level in the first samples and low in the last ones, the cluster 3 behaves in the opposite way. Similarly, cluster 2 presents low expression levels in first samples but high in remaining ones meanwhile the cluster 4 behaves in opposite way. The other three datasets have similar results. Such situations reveal that genes in the groups found by our algorithm are highly co-expressed.
Table 6Friedman test ranking result for comparingMOC-GaPBKalgorithm with other state of the art single and multi objective clustering techniques
Dataset MOC-GaPBK Semi-FeaClust MO fuzzy MOGA SOM Avg. link.
Arabidopsis 0.49 (1) 0.46 (2) 0.41 (3) 0.40 (4) 0.23 (6) 0.32 (5)
Cell cycle 0.63 (1) 0.50 (2) 0.43 (4) 0.42 (5) 0.38 (6) 0.44 (3)
Sporulation 0.80 (1) 0.70 (2) 0.59 (3) 0.58 (4) 0.58 (4) 0.50 (6)
Serum 0.58 (1) 0.44 (2) 0.40 (3) 0.38 (4) 0.34 (6) 0.36 (5)
Avg. rank (1) (2) (3.25) (4.25) (5.5) (4.75)
To establish the biological relevance and coherence of a cluster, we performed an annotation enrichment analysis. In Table 4, we reported to each cluster the three most significant GO terms shared by the genes with their p-value. It reveals that all the clusters of the solutions found by MOC-GaPBK have obtained p-values less than 0.01, i.e., each cluster has associated biological processes and thus, they are biologically significant and functionally enriched. In this aspect, MOC-GaPBKoutperforms competitive algorithms since they fail in finding biologically related clusters in some cases. For instance, in Yeast Sporulation dataset, MOGA, FCM, SOM and Average linkage present at least one cluster without biological significance [63].
Conclusions
In this paper we have presented a multi-objective gene clustering algorithm called MOC-GaPBK. It includes external biological knowledge during the objective functions optimisation and it integrates intensification and diversification strategies based on both multi-objective Path-Relinking and Pareto Local Search.
Results show thatMOC-GaPBK yields higher quality solutions than other clustering techniques considered here for comparison purposes. It is mainly to the strength of inte-grating a-priori biological knowledge with a multi-objective clustering approach and the use of intensification and diversification strategies. The first one allows having partitions with higher co-expression levels and biological coherence since cluster quality indexes are used to optimise simultaneously gene relationships at expression level and biological functionality. The other aims to improve the clustering solutions to yield higher quality clustering solutions regarding to compactness and separation and to avoid fall into local optima.
The effectiveness ofMOC-GaPBKwas demonstrated quantitatively and visually using statistical comparison test and cluster visualisation tools respectively. Results of silhouette tests, visualisations and annotation enrichment analysis show that the proposed method is able to discover compact, well separated, co-expressed and biologically significant clusters.
To perform the multi-objective clustering process we have used a chromosome representation based on clusters medoid. As a future work we would like to explore a clustering technique based on graph theory to tackle in a better way with datasets where non-convex groups are present. Furthermore, because we use a multi-objective approach, our algorithm provides a set of solutions, all identically relevant from clustering style point of view. However, for biologists can be more appropriate to have a single solution for clustering of genes or otherwise have a subset of genes that appear grouped together most times. Due to that, in future we would like to develop a voting or ranking technique to identify the set of genes that appear most often in the same clusters, and so facilitate the inference of knowledge by biologists.
Abbreviations
DBB: Biology-based distance;DEB: Expression-based distance; Dev: Overall cluster deviation; DM: Decision maker; GaPBK: Guided by a-priori biological knowledge; GO: Gene ontology; HV: Hypervolume; IC: Information content; KEGG: Kyoto encyclopedia of genes and genomes; MOC: Multi-objective clustering; NSGA-II: Non-dominated sorting genetic algorithm; PF: Pareto front; PLS: Pareto local search; PR: Path-relinking; PS: Pareto set; Sep: Cluster separation; SGA: Single objective genetic algorithm; TR: Trajectory; WS: Wang functional similarity; XB: Xie-Beni index
Funding
Pesquisa do Estado do Rio Grande do Sul (FAPERGS) - PRONUPEQ (16/2551-0000520-6). This Research was supported by Microsoft under a Microsoft Azure for Research Award.
Availability of data and materials
The pre-processed data sets, the distance matrices and the best clustering solutions are available inhttp://bioinformatic. diinf.usach.cl/gapbk/The data and results published here are in part based upon data generated by GOSemSim:http:// bioconductor.org/packages/2.6/bioc/html/GOSemSim.htmland the Gene Expression, Genome Variation and Functional Profiling Analysis Suite:http://babelomics.bioinfo.cipf.es/.
Authors’ contributions
JPA conducted the literature review, developed the code, carried out the experiments, helped interpreting the results and manuscript writing. MD helped interpreting the results and manuscript draft. MIP contributed with the modelling, experiments design, results analysis and manuscript writing. All authors contributed to manuscript refinement and approved the final version.
Ethical approval and consent to participate Not applicable.
Consent for publication Not applicable.
Competing interests
The authors declare that they have no competing interests.
Publisher’s Note
Springer Nature remains neutral with regard to jurisdictional claims in published maps and institutional affiliations.
Author details
1Centre for Biotechnology and Bioengineering (CeBiB), Departamento de Ingeniería Informática, Universidad de Santiago
de Chile, Av. Ecuador 3659, Santiago, Chile.2Carrera de Computación, Escuela Superior Politécnica Agropecuaria de
Manabí Manuel Félix López, Campus Politécnico Sitio El Limón, Calceta, Ecuador.3Instituto de Informatica, Universidade
Federal do Rio Grande do Sul, Av. Bento Gonçalves 9500, 91501-970 Porto Alegre, Brasil.
Received: 5 May 2017 Accepted: 29 July 2018
References
1. Bolón-Canedo V, Sánchez-Maroño N, Alonso-Betanzos A, Benítez JM, Herrera F. A review of microarray datasets and applied feature selection methods. Inf Sci. 2014;282:111–35.
2. Fa R, Nandi AK, Gong L-Y. Clustering analysis for gene expression data: A methodological review. In:
Communications Control and Signal Processing (ISCCSP), 2012 5th International Symposium On. New York: Institute of Electrical and Electronics Engineers (IEEE); 2012. p. 1–6.
3. Giancarlo R, Scaturro D, Utro F. Valworkbench: An open source java library for cluster validation, with applications to microarray data analysis. Comput Methods Prog Biomed. 2015;118(2):207–17.
4. Vaes E, Khan M, Mombaerts P. Statistical analysis of differential gene expression relative to a fold change threshold on nanostring data of mouse odorant receptor genes. BMC Bioinformatics. 2014;15(1):39.
5. Lui T, Tsui N, Chan L, Wong C, Siu P, Yung B. Decode: an integrated differential co-expression and differential expression analysis of gene expression data. BMC Bioinformatics. 2015;16(1):182.
6. Liu Y-C, Cheng C-P, Tseng V. Mining differential top-k co-expression patterns from time course comparative gene expression datasets. BMC Bioinformatics. 2013;14(1):230.
7. Chou J, Zhou T, Kaufmann W, Paules R, Bushel P. Extracting gene expression patterns and identifying co-expressed genes from microarray data reveals biologically responsive processes. BMC Bioinforma. 2007;8(1):427.
8. Chen X, Li J, Daggard G, Huang X. Finding similar patterns in microarray data. In: Zhang S, Jarvis R, editors. AI 2005: Advances in Artificial Intelligence. Lecture Notes in Computer Science, vol. 3809. Heidelberg: Springer; 2005. p. 1272–6.
9. Ban JY, Kim BS, Kim SC, Kim DH, Chung J-H. Microarray analysis of gene expression profiles in response to treatment with melatonin in lipopolysaccharide activated raw 264.7 cells. Korean J Physiol Pharmacol Off J Korean Physiol Soc Korean Soc Pharmacol. 2011;15(1):23–9.
10. Jang H-S, Chung H-S, Ko E, Shin J-S, Shin M-K, Hong M-C, Kim Y, Min B-I, Bae H. Microarray analysis of gene expression profiles in response to treatment with bee venom in lipopolysaccharide activated rawx 264.7 cells. J Ethnopharmacol. 2009;121(2):213–20.
11. Mohammadi A, Saraee MH, Salehi M. Identification of disease-causing genes using microarray data mining and gene ontology. BMC Med Genet. 2011;4(1):1.
12. Ghosh S, Mitra S, Dattagupta R. Fuzzy clustering with biological knowledge for gene selection. Appl Soft Comput. 2014;16:102–11.
13. Jothi R, Mohanty SK, Ojha A. Functional grouping of similar genes using eigenanalysis on minimum spanning tree based neighborhood graph. Comput Biol Med. 2016;71:135–48.
14. Tan J, Chua KS, Zhang L, Zhu S. Algorithmic and complexity issues of three clustering methods in microarray data analysis. Algorithmica. 2007;48(2):203–19.
16. Wu F-X. Genetic weighted k-means algorithm for clustering large-scale gene expression data. BMC Bioinformatics. 2008;9(Suppl 6):12.
17. Hoque S, Istyaq S, Riaz MM. A hierarchical approach for clustering and pattern matching of gene expression data. In: Genetic and Evolutionary Computing (ICGEC), 2012 Sixth International Conference On. New York: Institute of Electrical and Electronics Engineers (IEEE); 2012. p. 413–16.
18. Sirbu A, Bocicor MI. A dynamic approach for hierarchical clustering of gene expression data. In: Intelligent Computer Communication and Processing (ICCP), 2013 IEEE International Conference On. New York: IEEE; 2013. p. 3–6. 19. Kramer M, Dutkowski J, Yu M, Bafna V, Ideker T. Inferring gene ontologies from pairwise similarity data.
Bioinformatics. 2014;30(12):34–42.
20. Muthukalathi S, Ramanujam R, Thalamuthu A. Consensus clustering for microarray gene expression data. Bonfring Int J Data Min. 2014;4(4):26.
21. Isewon I, Oyelade OJ, Adebiyi E, Brors B. Ensemble based clustering of plasmodium falciparum genes. In: International Conference on African Development Issues (CU-ICADI). Ota: Covenant University; 2015. p. 15–22. 22. Suresh R, Dinakaran K, Valarmathie P. Clustering gene expression data using self-organizing maps. J Comput Appl.
2008;1(4):6.
23. Inostroza-Ponta M. An integrated and scalable approach based on combinatorial optimization techniques for the analysis of microarray data. Newcastle: School of Electrical Engineering and Computer Science. University of Newcastle; 2008.
24. Arefin AS, Riveros C, Berretta R, Moscato P. The MST-kNN with paracliques. In: Artificial Life and Computational Intelligence: First Australasian Conference, ACALCI 2015, Newcastle, NSW, Australia, February 5-7, 2015. Proceedings. Cham: Springer; 2015. p. 373–86.
25. Gillis J, Pavlidis P. “Guilt by association” is the exception rather than the rule in gene networks. PLoS Comput Biol. 2012;8(3):1–13.
26. Nepomuceno JA, Troncoso A, Nepomuceno-Chamorro IA, Aguilar-Ruiz JS. Integrating biological knowledge based on functional annotations for biclustering of gene expression data. Comput Methods Prog Biomed. 2015;119(3): 163–80.
27. Tari L, Baral C, Kim S. Fuzzy c-means clustering with prior biological knowledge. J Biomed Inform. 2009;42(1):74–81. 28. The Gene Ontology Consortium. Gene ontology consortium: going forward. Nucleic Acids Res. 2015;43(D1):1049–56. 29. Kanehisa M, Sato Y, Kawashima M, Furumichi M, Tanabe M. Kegg as a reference resource for gene and protein
annotation. Nucleic Acids Res. 2016;44(D1):457–62.
30. Handl J, Kell DB, Knowles J. Multiobjective optimization in bioinformatics and computational biology. Comput Biol Bioinforma IEEE/ACM Trans. 2007;4(2):279–92.
31. Ferligoj A, Batagelj V. Direct multicriteria clustering algorithms. J Classif. 1992;9(1):43–61.
32. Brockhoff D, Zitzler E. Objective reduction in evolutionary multiobjective optimization: Theory and applications. Evol Comput. 2009;17(2):135–66.
33. Bandyopadhyay S, Mukhopadhyay A, Maulik U. An improved algorithm for clustering gene expression data. Bioinformatics. 2007;23(21):2859–65.
34. Maulik U, Mukhopadhyay A, Bandyopadhyay S. Combining pareto-optimal clusters using supervised learning for identifying co-expressed genes. BMC bioinforma. 2009;10(1):1197–208.
35. Mukhopadhyay A, Maulik U, Bandyopadhyay S. An interactive approach to multiobjective clustering of gene expression patterns. IEEE Trans Biomed Eng. 2013;60(1):35–41.
36. Azuaje FJ, Wang H, Zheng H, Léonard F, Rolland-Turner M, Zhang L, Devaux Y, Wagner DR. Predictive integration of gene functional similarity and co-expression defines treatment response of endothelial progenitor cells. BMC Syst Biol. 2011;5(1):1–13.
37. Luque-Baena RM, Urda D, Gonzalo Claros M, Franco L, Jerez JM. Robust gene signatures from microarray data using genetic algorithms enriched with biological pathway keywords. J Biomed Inform. 2014;49(C):32–44. 38. Deb K, Pratap A, Agarwal S, Meyarivan T. A fast and elitist multiobjective genetic algorithm: Nsga-ii. IEEE Trans Evol
Comput. 2002;6(2):182–97.
39. Frinhani RMD, Silva RMA, Mateus GR, Festa P, Resende MGC. Grasp with path-relinking for data clustering: A case study for biological data. In: Experimental Algorithms: 10th International Symposium, SEA 2011, Kolimpari, Chania, Crete, Greece, May 5-7, 2011. Proceedings. Berlin: Springer; 2011. p. 410–20.
40. Paquete L, Chiarandini M, Stützle T. Pareto local optimum sets in the biobjective traveling salesman problem: An experimental study. In: Metaheuristics for Multiobjective Optimisation. Berlin: Springer; 2004. p. 177–99. 41. Wang JZ, Du Z, Payattakool R, Yu PS, Chen C-F. A new method to measure the semantic similarity of go terms.
Bioinformatics. 2007;23(10):1274–81.
42. Glover F. Tabu search and adaptive memory programming — advances, applications and challenges. In: Interfaces in Computer Science and Operations Research: Advances in Metaheuristics, Optimization, and Stochastic Modeling Technologies. Boston: Springer; 1997. p. 1–75.
43. Dubois-Lacoste J, López-Ibáñez M, Stützle T. Anytime pareto local search. Eur J Oper Res. 2015;243(2):369–85. 44. Mukhopadhyay A, Maulik U, Bandyopadhyay S. A survey of multiobjective evolutionary clustering. ACM Comput
Surv. 2015;47(4):61.
45. Pakhira MK, Bandyopadhyay S, Maulik U. Validity index for crisp and fuzzy clusters. Pattern Recog. 2004;37(3): 487–501.
46. Mukhopadhyay A, Maulik U. Multiobjective approach to categorical data clustering. In: 2007 IEEE Congress on Evolutionary Computation. New York: Institute of Electrical and Electronics Engineers (IEEE); 2007. p. 1296–303. 47. Xie XL, Beni G. A validity measure for fuzzy clustering. IEEE Trans Pattern Anal Mach Intell. 1991;13(8):841–7. 48. Handl J, Knowles J. An evolutionary approach to multiobjective clustering. Evol Comput IEEE Trans. 2007;11(1):
56–76.
50. Resende MGC, Ribeiro CC. Grasp with path-relinking: Recent advances and applications. Oper Res Comput Sci Interfaces Ser. 2005;32:29–63.
51. Chaves AA, Lorena LAN. Clustering search algorithm for the capacitated centered clustering problem. Comput Oper Res. 2010;37(3):552–8.
52. Martí R, Campos V, Resende MGC, Duarte A. Multiobjective grasp with path relinking. Eur J Oper Res. 2015;240(1): 54–71.
53. Drugan MM, Thierens D. Stochastic pareto local search: Pareto neighbourhood exploration and perturbation strategies. J Heuristics. 2012;18(5):727–66.
54. Rousseeuw PJ. Silhouettes: A graphical aid to the interpretation and validation of cluster analysis. J Comput Appl Math. 1987;20:53–65.
55. R Core Team. R: A Language and Environment for Statistical Computing. Vienna: R Foundation for Statistical Computing; 2017.
56. Lucas A. amap: Another Multidimensional Analysis Package. Vienna: R Foundation for Statistical Computing; 2014. 57. Yu G, Li F, Qin Y, Bo X, Wu Y, Wang S. Gosemsim: an r package for measuring semantic similarity among go terms
and gene products. Bioinformatics. 2010;26(7):976–8.
58. Reymond P, Weber H, Damond M, Farmer EE. Differential gene expression in response to mechanical wounding and insect feeding in arabidopsis. Plant Cell. 2000;12(5):707–19.
59. Cho RJ, Campbell MJ, Winzeler EA, Steinmetz L, Conway A, Wodicka L, Wolfsberg TG, Gabrielian AE, Landsman D, Lockhart DJ, et al. A genome-wide transcriptional analysis of the mitotic cell cycle. Mol Cell. 1998;2(1):65–73. 60. Chu S, DeRisi J, Eisen M, Mulholland J, Botstein D, Brown PO, Herskowitz I. The transcriptional program of
sporulation in budding yeast. Science. 1998;282(5389):699–705.
61. Iyer VR, Eisen MB, Ross DT, Schuler G, Moore T, Lee JCF, Trent JM, Staudt LM, Hudson J, Boguski MS, Lashkari D, Shalon D, Botstein D, Brown PO. The transcriptional program in the response of human fibroblasts to serum. Science. 1999;283(5398):83–7.
62. Maulik U, Mukhopadhyay A, Bandyopadhyay S. Website: Combining Pareto-Optimal Clusters Using Supervised Learning for Identifying Co-expressed Genes.http://anirbanmukhopadhyay.50webs.com/data.html.
urldate:2016-04-13.
63. Saha S, Ekbal A, Gupta K, Bandyopadhyay S. Gene expression data clustering using a multiobjective symmetry based clustering technique. Comput Biol Med. 2013;43(11):1965–77.
64. Eisen MB, Spellman PT, Brown PO, Botstein D. Cluster analysis and display of genome-wide expression patterns. Proc Natl Acad Sci. 1998;95(25):14863–8.
65. Deepika T, Porkodi R. A survey on microarray gene expression data sets in clustering and visualization plots. Int J Emerg Res Manag Technol. 2015;4(3):56–66.
66. Al-Shahrour F, Díaz-Uriarte R, Dopazo J. Fatigo: A web tool for finding significant associations of gene ontology terms with groups of genes. Bioinformatics. 2004;20(4):578–80.
67. Zitzler E, Thiele L. Multiobjective evolutionary algorithms: A comparative case study and the strength pareto approach. IEEE Trans Evol Comput. 1999;3(4):257–71.
68. K G, M G. Annotation enrichment analysis: An alternative method for evaluating the functional properties of gene sets. Sci Rep. 2014;4(4191):1–9.
69. Al-Shahrour F, Minguez P, Tárraga J, Medina I, Alloza E, Montaner D, Dopazo J. FatiGO +: A functional profiling tool for genomic data. integration of functional annotation, regulatory motifs and interaction data with microarray experiments. Nucleic Acids Res. 2007;35(SUPPL.2):91–6.
70. Saha S, Alok AK, Ekbal A. Use of semisupervised clustering and feature-selection techniques for identification of co-expressed genes. IEEE J Biomed Health Inform. 2016;20(4):1171–7.
71. Tamayo P, Slonim D, Mesirov J, Zhu Q, Kitareewan S, Dmitrovsky E, Lander ES, Golub TR. Interpreting patterns of gene expression with self-organizing maps: Methods and application to hematopoietic differentiation. Proc Natl Acad Sci U S A. 1999;96(6):2907–12.
72. Jain AK, Murty MN, Flynn PJ. Data clustering: A review. ACM Comput Surv. 1999;31(3):264–323.
73. Friedman M. The use of ranks to avoid the assumption of normality implicit in the analysis of variance. J Am Stat Assoc. 1937;32(200):675–701.