P R I M A R Y R E S E A R C H
Open Access
Impact of
ZBTB7A
hypomethylation and
expression patterns on treatment response
to hydroxyurea
Vasiliki Chondrou
1†, Eleana F. Stavrou
1†, Georgios Markopoulos
2, Alexandra Kouraklis-Symeonidis
3,
Vasilios Fotopoulos
4, Argiris Symeonidis
5, Efthymia Vlachaki
6, Panagiota Chalkia
7, George P. Patrinos
8,
Adamantia Papachatzopoulou
9and Argyro Sgourou
1*Abstract
Background:We aimed to clarify the emerging epigenetic landscape in a group of genes classified as“modifier genes”of theβ-type globin genes (HBBcluster), known to operatein transto accomplish the two natural developmental switches in globin expression, from embryonic to fetal during the first trimester of conception and from fetal to adult around the time of birth. The epigenetic alterations were determined in adult sickle cell anemia (SCA) homozygotes and SCA/β-thalassemia compound heterozygotes of Greek origin, who are under hydroxyurea (HU) treatment. Patients were distinguished in HU responders and HU non-responders (those not benefited from the HU) and both, and in vivo and in vitro approaches were implemented.
Results:We examined the CpG islands’DNA methylation profile ofBCL11A,KLF1,MYB,MAP3K5,SIN3A,ZBTB7A, andGATA2, along withγ-globin and LRF/ZBTB7Aexpression levels. In vitro treatment of hematopoietic stem cells (HSCs) with HU induced a significant DNA hypomethylation pattern inZBTB7A(p*, 0.04) andGATA2(p*, 0.03) CpGs exclusively in the HU non-responders. Also, this group of patients exhibited significantly elevated baseline methylation patterns inZBTB7A, before the HU treatment, compared to HU responders (p*, 0.019) and to control group of healthy individuals (p*, 0.021) , which resembles a potential epigenetic barrier for theγ-globin expression.γ-Globin expression in vitro matched with detected HbF levels during patients’monitoring tests (in vivo) under HU treatment, implying a good reproducibility of the in vitro HU epigenetic effect. LRF/ZBTB7Aexpression was elevated only in the HU non-responders under the influence of HU.
Conclusions:This is one of the very first pharmacoepigenomic studies indicating that the hypomethylation ofZBTB7A during HU treatment enhances the LRF expression, which by its turn suppresses the HbF resumption in the HU non-responders. Its role as an epigenetic regulator of hemoglobin switching is also supported by the wide distribution of ZBTB7A-binding sites within the 5′CpG sequences of all studied humanHBBcluster“modifier genes.”Also, the baseline methylation level of selective CpGs inZBTB7AandGATA2could be an indicator of the negative HU response among theβ-type hemoglobinopathy patients.
Keywords:SCA homozygotes, SCA/β-thal heterozygotes, Hydroxyurea treatment, HbF induction,HBBcluster “modifying genes”, Epigenetic regulation
* Correspondence:[email protected]
†Vasiliki Chondrou and Eleana F. Stavrou contributed equally to this work.
1School of Science and Technology, Biology Laboratory, Hellenic Open
University, Patras, Greece
Full list of author information is available at the end of the article
Introduction
Thalassemias and sickle cell anemia (SCA) are still of the most common genetic disorders among human popula-tion even after many decades of worldwide prenatal
con-trol attempts. Furthermore, the combination of βs allele,
as a consequence of the SCA genotype withβ-thalassemic
alleles (SCA/β-thal), appears with an evenly severe clinical
phenotype. Clinical practice has shown that, despite iden-tical disease-causing mutations, the pathological pheno-type of disease varies enormously between individual patients. This is partly related to genetic variants of the genetic loci coding for the hemoglobin subunits alpha and
beta (HBA and HBB) including their remote regulatory
regions (LCRs—locus control regions) [1, 2] and the
co-interaction with other parameters such as epigenetic
regulatory mechanisms [3].
These genetic disorders have an early onset, within a few months after birth, which is accompanied by high fi-nancial burdens to healthcare systems due to the expen-sive therapeutic protocols applied to patients. Apart from the regular blood transfusions and iron-chelating agents, an alternative widely used therapeutic approach is the induction of fetal hemoglobin (HbF) expression
that ameliorates their pathological phenotype [4, 5].
Hydroxyurea (HU) or hydroxycarbamide is the major therapeutic agent identified as a potent HbF inducer and has been used for the management of patients with SCA
and SCA/β-thal, since its FDA approval in1998 [6, 7].
The main mechanism of HU action is the inhibition of the ribonucleotide reductase (RR), which pauses the DNA synthesis. The in vivo effects of HU in mammalian systems are transient, as a consequence from the rapid absorption, metabolism, and excretion of the drug. Once-daily dosing of HU presumably causes an intermit-tent cytotoxic effect resulting in stress erythropoiesis
and increased HbF levels [8]. Patients administered with
HU show elevated HbF levels within the first 3 to 6 months of treatment, with further improvements up to 12 months, where patients reach a plateau with the max-imum HbF expression levels and the corresponding maximum mean erythrocyte corpuscular volume (MCV)
[9]. However, HbF levels do not present a uniform
in-crease in all patients, whereas long-term use of HU sometimes leads to the loss of its initial beneficial action
[10, 11]. The underlying precise molecular mechanism
of the HU action and the variance of treatment results remain still elusive, though a concealed epigenetic effect of its action is highly suspected.
Epigenetic modifications, such as DNA methylation and histone methylation/acetylation, constitute an additional layer of gene expression regulation and affect phenotypic heterogeneity of human diseases and
drug responses [12, 13]. DNA methylation mainly
occurs in the context of CG dinucleotides (CpGs) and
has traditionally been associated with gene repression
[14].
This study concerns the methylation alterations,
induced by HU treatment on knownβ-type globin genes
(HBB cluster) “modifier genes”:erythroid-specific
tran-scription factors (KLF1,GATA1, andGATA2), regulators
of hematopoiesis and erythropoiesis (MYB, SOX6,
SIN3A), members of the MAPK signaling pathway
(MAP3K5), and HbF repressors (BCL11A, ZBTB7A)
[15–28], in terms of contributing to knowledge on the
mo-lecular epigenetic regulation of embryonic HbF (α2γ2)
re-activation during the human progenitor cells’exposure to
HU. Though SOX6 and GATA1 bared no CpG islands
within neighboring sequences, indicating that they are alter-natively regulated and were excluded from the study, CpG
islands’quantitative analysis of hyper- or hypomethylation
status within the HBB cluster “modifier genes” has been
elaborated both in patients comprised within a long-term treatment and newly introduced to HU. The epigenetic landscape of these genes has also been studied during culti-vation and erythroid differentiation of human-induced hematopoietic pluripotent stem cells derived from healthy
donors’ and patients’ peripheral blood, cord blood, and
bone marrow, under the pressure of HU to simulate in vitro the pharmacological induction of HbF and the corre-sponding cell molecular responses.
The aim of our study was to depict and highlight changes in the DNA methylation pattern at genomic loci
unlinked to theHBB cluster on chromosome 11, which
may influence the HbF induction in adults, to distin-guish the different epigenetic regulatory nuclear mecha-nisms acting among responders and non-responders to treatment with HU and to contribute to the develop-ment of a clinical algorithm for improved prediction of
the patients’response to HU treatment.
Material and methods
Bioinformatics analysis and CpG islands’selection
Candidate disease identified “modifier loci,” encoding
β-type globin gene regulators were: BCL11A, KLF1,
MYB, MAP3K5, SOX6, SIN3A, ZBTB7A, GATA1, and
GATA2[15–28]. CpG islands of all genes were retrieved
by the UCSC genome browser (genome.ucsc.edu) [29].
Selected CpG islands for the study are located at areas
flanking genes’promoter or within downstream 5′UTR
regions and gene bodies. Respective data for gene
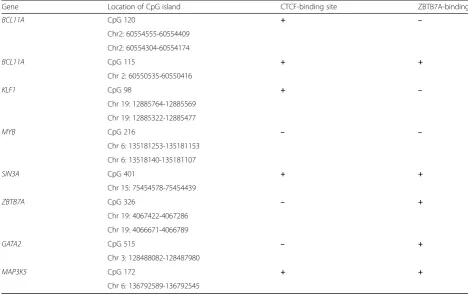
loca-tions and CpG islands analyzed are presented in Table1.
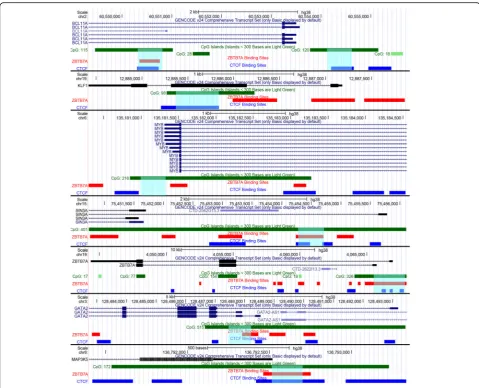
All include sites for CTCF and/or ZBTB7A transcription
factors’ commitment (Fig. 1). Genes and/or CpG sites
that did not preserve these characteristics were excluded from the study.
Transcription factor binding sites for CTCF and ZBTB7A
were extracted from ENCODE project Chip-Seq data [30]
Sample collection
Patients were selected based on the existence of homo-zygosity to HbS (SCA) or compound heterohomo-zygosity to
SCA and β-thalassemia (SCA/β-thal). All patients were
adults, either treated for long-term with HU or for im-mediate treatment initiation, due to life-threatening disease-related symptoms. For the newly introduced patients to HU therapy, the mean dosage of HU admin-istered was 20 mg/kg and the mean follow-up time was
5–6 months. Upon arrival to the plateau phase, where
max-imum HbF was produced, patients continued to be
moni-tored annually. HbF levels at baseline and 5–6 months after
initiation of HU treatment were estimated in all patients participating in this study with the high-performance liquid
chromatography (HPLC) method, HbA2/HbA1c dual
program (VARIANT™ II Beta-Thalassemia, Bio-Rad)
(Additional file 1: Figure S1). Patients’ hematological
data are presented in Additional file1: Table S1.
Blood samples of SCA, SCA/β-thal, and healthy
donors have been included in the study. Experimental procedures have been applied both in vivo and in vitro.
Samples analyzed in vivo were group I—30 peripheral
blood samples from SCA and SCA/β-thal patients,
sub-categorized to responders and non-responders to
HU (Additional file 1: Table S1), and group II—20
peripheral blood samples from healthy donors to act as reference group.
Samples analyzed in vitro were as follows: Group III—
burst-forming unit-erythroid (BFU-E) cell populations from hematopoietic progenitor human cells acquired
from the peripheral blood of selected SCA/β-thal
pa-tients who were undergoing HU therapy for the first time. Total samples cultivated derived from five
re-sponders (III R1–R5) and for non-responders (III NR1–
NR4). Their characterization as responsive or not to the HU treatment was done later, when they had reached
the plateau phase (5–6 months). III NR3 and NR4 were
sisters and brothers. Group IV—BFU-E colonies
ac-quired from peripheral blood of the control group (four
samples IV CG1–CG4), from the bone marrow (four
samples, IV BM1–BM4), and from the umbilical cord
blood (four samples, IV UCB1–UCB4), all coming from
healthy donors (Table2).
Responders and non-responders to HU were clinic-ally distinguished in relevance to their hematological parameters before and after administration of HU, their transfusion needs, and the capability to amelior-ate anemia symptoms. For the present study, which fo-cused on the epigenetic regulatory differences among
the HBB cluster “modifier genes” and their influence
in HbF induction, the strict clinical evaluation of Table 1Chromosomal locations of all CpG islands analyzed
Gene Location of CpG island CTCF-binding site ZBTB7A-binding site
BCL11A CpG 120 + –
Chr2: 60554555-60554409
Chr2: 60554304-60554174
BCL11A CpG 115 + +
Chr 2: 60550535-60550416
KLF1 CpG 98 + –
Chr 19: 12885764-12885569
Chr 19: 12885322-12885477
MYB CpG 216 – –
Chr 6: 135181253-135181153
Chr 6: 13518140-135181107
SIN3A CpG 401 + +
Chr 15: 75454578-75454439
ZBTB7A CpG 326 – +
Chr 19: 4067422-4067286
Chr 19: 4066671-4066789
GATA2 CpG 515 – +
Chr 3: 128488082-128487980
MAP3K5 CpG 172 + +
patients has not been applied. Responders were con-sidered the patients with an overall improved disease
course and a≥2.5-fold HbF increase.
Hematopoietic stem cells from categories III and IV have been cultivated simultaneously in the presence and
absence of HU (50–100μΜ).
Hematopoietic pluripotent stem cell cultures
The hematopoietic pluripotent stem cells derived from human blood samples support an in vitro clonogenic culture system, known as colony-forming unit assay (CFU), simulating the in vivo erythropoiesis in the bone marrow. The cell colonies of the different morphology finally obtained by this type of cultures are the CFU-E
(colony-forming unit-erythroid) and the BFU-E
(burst-forming unit-erythroid), which are apparent
after 14–16 days of continuous culture (Fig.2).
Peripheral blood (PBMCs) and cord blood
mono-nuclear cells, enriched in CD34+, were isolated with
Histopaque-1077 (Sigma-Aldrich) following the vendor’s
protocol. Single cell common myeloid progenitors (iso-lated from bone marrow aspirates) were also induced for erythrocyte expansion and differentiation in the same
culture conditions. In all cases, 105cells were cultivated
in the semi-solid culture media (MethoCultt GF+ H4435, StemCell Technologies), containing the appro-priate cytokine cocktail plus erythropoietin.
At day 13, culture medium was supplemented with the pharmacological factor HU (Sigma), freshly prepared, at
Fig. 1Epigenetic features of promoter regions of genes analyzed in this study. The promoter regions and sequence features ofBCL11A,KLF1,MYB,SIN3A,
ZBTB7A,GATA2, andMAP3K5respectively are presented in parallel tracks, from top to bottom: scale, chromosomal location, gene transcript from Gencode v.24 (exons are represented as boxes and introns as lines with arrows indicating the 5′towards the 3′region), CpG islands (boxes in green color), LRF/
concentrations between 50 and 100 mM for monitoring the effect of the pharmaceutical agent. In parallel, CFUs were carried under the same conditions apart from the addition of HU. At day 16, when cells reached the BFU-E stage of differentiation, cultures were terminated. Viability
of the cells was checked by trypan blue dye exclusion test. Single BFU-E colonies were randomly picked under an inverted microscope (Leica DMI), whereas the rest of the colonies (derived from the same plating) were collectively pooled and used for DNA/RNA extraction. Genetic Table 2In vitro samples (III and IV)
Sample ID In vitroγ-globin (+HU/−HU) Baseline HbF (−HU) Plateau HbF (+HU) In vivo HbF (+HU)/(−HU)
IV CG1 1.75 x x x
IV CG2 1.38 x x x
IV CG3 1.26 x x x
IV CG4 1.69 x x x
III NR1 1.35 3.4 4.6 1.35
III NR2 1.54 2.5 2.9 1.16
III NR3 2.12 0.6 1 1.67
III NR4 1.43 2.1 2.9 1.38
III R1 1.09 6.1 22.6 3.7
III R2 3.66 6.7 16.4 2.5
III R3 2.31 10.7 31 2.89
III R4 2.56 9.8 24.5 2.5
III R5 1.87 2.7 15.1 5.6
IV UCB1 2.02 x x x
IV UCB2 2.57 x x x
IV UCB3 1.96 x x x
IV UCB4 2.34 x x x
IV BM1 5.58 x x x
IV BM2 4.44 x x x
IV BM3 3.25 x x x
IV BM4 5.02 x x x
material from BFU-Es was processed to bisulphite treat-ment followed by pyrosequencing methylation assays and RNA to qPCR experiments.
Detection of relative gene expression by RNA quantification (qRT-PCR)
In quantitative PCRs, the amount of target cDNA (either
γ-globin or LRF/ZBTB7A) was compared and
normal-ized to the amount of GAPDH reference gene
expres-sion. cDNAs were amplified using QuantiFast SYBR Green PCR (Qiagen) and the ECO (Illumina) instru-ment. The target and internal reference gene were run in separate duplicate or triplicate reactions using primers
reported at Table 3. γ-Globin, towardsGAPDH reaction
conditions, were as follows: 10 s at 95 °C, 30 s at 58 °C,
40 cycles (Additional file 1: Figure S1), and LRF/
ZBTB7A toGAPDH were done according to Shen et al.
[31] (Fig.5).
Gene expression in BFU-E colonies was calculated as relative expression of treated compared to untreated
with HU colonies, using the formula 2(−ΔCt)and
normal-ized to the referenceGAPDHgene.
Methylation analysis
The methylation status of all CpG DNA sequences was determined with the Pyrosequencing CpG assay methodology in duplicate or triplicate analysis indicat-ing a good technical reproducibility and validation of the method. To achieve the complete conversion of the unmethylated cytosines (existing as CpG dinucleo-tides) to uraciles, bisulphite method (Qiagen) was uti-lized. Pyrosequencing reactions were performed with the PyroMark Q24 MDx technology (Qiagen). Meth-ylated and unmethMeth-ylated (bisulphite converted) hu-man DNAs plus unmethylated (physiological) huhu-man DNA were used as internal controls in every round
of pyrosequencing reactions. Different sequencing
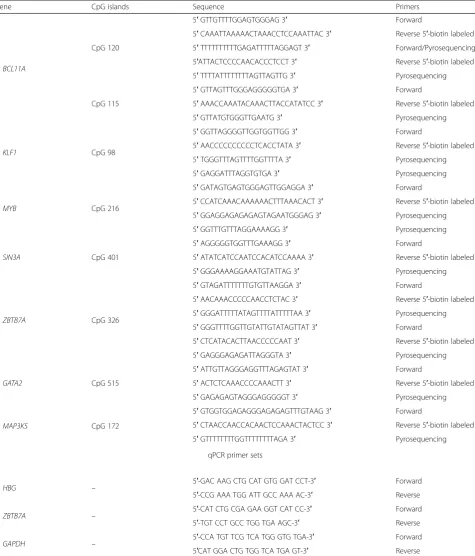
primers, specific for the methylation analysis of each DNA CpG sequence, were designed as well as all PCR primers sets with the PyroMark Assay Design
Software, version 2.0 (Qiagen) (Table 3). Variation in
methylation status of various CpG sites was detected
and presented in a sequence context (Additional file 1:
Figure S2, S3). Quality controls for the bisulphite conversion efficiency were introduced in every Pyrose-quencing run set.
Sodium bisulphite treatment modification for the single-colony CpG assays
Before DNA methylation analysis, normal cytosine resi-dues, existing as CpG dinucleotides, were completely converted to uracil residues while 5-methylocytosine res-idues remained unchanged through sodium bisulphite
conversion reaction. In this study, a modified protocol for bisulphite treatment of single colonies of human erythroid progenitor cells was developed bypassing the DNA extraction step and based on the standard protocol of EpiTect Bisulphite kit (Qiagen, Hilden, Germany) for sodium bisulphite conversion of unmethylated cytosines in DNA from low-concentration solutions. In particular, for the preparation of bisulphite reactions, a single
col-ony of each sample (of maximum 106 cells per colony)
was stored at−80 °C for at least 2 h to obtain cell
mem-brane damage. After thawing, 40 μl of DNase-free water
was added, mixed by vigorous pipetting, and the proto-col for the low concentration solutions of DNA was followed. The eluted (treated) DNA per single colony
was stored at−20 °C until use.
Statistical analysis and correlation of methylation and expression results
Statistical analysis was performed for all data collected regarding percentage of methylation per CpG site and mRNA levels. Results were correlated either to the corresponding gene expression percentages or to the methylation/hypomethylation impact of the CpG islands of all studied genes before and after the HU treatment.
The results of the methylation analysis were presented as mean ratio of the methylation levels at CpG sites within gene loci of interest. Statistical analysis and box-plots were performed using SPSS software version 20. Depending on the normality tests of datasets,
independ-ent sample t test or Mann-Whitney test was used to
compare untreated (−HU) single BFU-E colonies and
single BFU-E colonies treated with HU (+HU) between each group. Also, the one-way ANOVA or the Kruskal-Wallis test for not normally distributed data was used for the comparison of methylation status between both untreated single BFU-E colonies and in vivo sam-ples in all subgroups.
In all cases, p values less than 0.05 were considered
statistically significant.
Results
Detection and recording ofγ-globin expression (in vitro) in the presence of hydroxyurea
Total RNA collected from CFU cultures was subjected
to a quantitative PCR (qPCR) assay to detect γ-globin
mRNA expression profile. Variation in γ-globin levels
were observed in biological replicate experiments with CFU cultures from the same donor, which prompted us to refine the HU concentrations used in culture
condi-tions (50–100 μM). Finally, culture media was
supple-mented with the maximum cell-tolerated HU dose
(100μM) and subsequently the effects on γ-globin gene
variations between sister CFU cultures from the same donor were of no statistical significance.
BFU-E cell colonies grown at 100μΜHU showed, with
no exception, an increase inγ-globin calculated as relative
expression. Non-responders (III NR1–4) showed a
maximum of 2.1-fold increase while responders (III R1–5)
a 3.66-fold, all compared to their related untreated cells
(−HU) (Additional file1: Figure S1). BFU-Es from healthy
donors (IV CG1–4, UCB1–4, and BM1–4) showed a 1.3–
5.6-fold increase inγ-globin expression.
Table 3Pyrosequencing and qPCR primer sets
Gene CpG islands Sequence Primers
BCL11A
CpG 120
5′GTTGTTTTGGAGTGGGAG 3′ Forward
5′CAAATTAAAAACTAAACCTCCAAATTAC 3′ Reverse 5′-biotin labeled
5′TTTTTTTTTTGAGATTTTTAGGAGT 3′ Forward/Pyrosequencing
5′ATTACTCCCCAACACCCTCCT 3′ Reverse 5′-biotin labeled
5′TTTTATTTTTTTTAGTTAGTTG 3′ Pyrosequencing
CpG 115
5′GTTAGTTTGGGAGGGGGTGA 3′ Forward
5′AAACCAAATACAAACTTACCATATCC 3′ Reverse 5′-biotin labeled
5′GTTATGTGGGTTGAATG 3′ Pyrosequencing
KLF1 CpG 98
5′GGTTAGGGGTTGGTGGTTGG 3′ Forward
5′AACCCCCCCCCCTCACCTATA 3′ Reverse 5′-biotin labeled
5′TGGGTTTAGTTTTGGTTTTA 3′ Pyrosequencing
5′GAGGATTTAGGTGTGA 3′ Pyrosequencing
MYB CpG 216
5′GATAGTGAGTGGGAGTTGGAGGA 3′ Forward
5′CCATCAAACAAAAAACTTTAAACACT 3′ Reverse 5′-biotin labeled
5′GGAGGAGAGAGAGTAGAATGGGAG 3′ Pyrosequencing
5′GGTTTGTTTAGGAAAAGG 3′ Pyrosequencing
SIN3A CpG 401
5′AGGGGGTGGTTTGAAAGG 3′ Forward
5′ATATCATCCAATCCACATCCAAAA 3′ Reverse 5′-biotin labeled
5′GGGAAAAGGAAATGTATTAG 3′ Pyrosequencing
ZBTB7A CpG 326
5′GTAGATTTTTTTGTGTTAAGGA 3′ Forward
5′AACAAACCCCCAACCTCTAC 3′ Reverse 5′-biotin labeled
5′GGGATTTTTATAGTTTTATTTTTAA 3′ Pyrosequencing
5′GGGTTTTGGTTGTATTGTATAGTTAT 3′ Forward
5′CTCATACACTTAACCCCCAAT 3′ Reverse 5′-biotin labeled
5′GAGGGAGAGATTAGGGTA 3′ Pyrosequencing
GATA2 CpG 515
5′ATTGTTAGGGAGGTTTAGAGTAT 3′ Forward
5′ACTCTCAAACCCCAAACTT 3′ Reverse 5′-biotin labeled
5′GAGAGAGTAGGGAGGGGGT 3′ Pyrosequencing
MAP3K5 CpG 172
5′GTGGTGGAGAGGGAGAGAGTTTGTAAG 3′ Forward
5′CTAACCAACCACAACTCCAAACTACTCC 3′ Reverse 5′-biotin labeled
5′GTTTTTTTTGGTTTTTTTTAGA 3′ Pyrosequencing
qPCR primer sets
HBG – 5′-GAC AAG CTG CAT GTG GAT CCT-3′ Forward
5′-CCG AAA TGG ATT GCC AAA AC-3′ Reverse
ZBTB7A – 5′-CAT CTG CGA GAA GGT CAT CC-3′ Forward
5′-TGT CCT GCC TGG TGA AGC-3′ Reverse
GAPDH – 5′-CCA TGT TCG TCA TGG GTG TGA-3′ Forward
Correlation ofγ-globin induction (in vitro) with HbF levels (in vivo) upon HU treatment
The elevated γ-globin gene expression obtained from
the ex vivo culture system (CFU) was compared to the corresponding in vivo HbF levels determined among patients (responders and non-responders) at relevant time points, namely, at baseline, before HU
treat-ment, and at the plateau phase (after 5–6 months of
continuous HU treatment). HbF levels were detected
dur-ing regular preset patients’ hematological tests at the
Hematology Division of the Patras’ University Hospital
with the HPLC method. Responders (III R1–5) showed
augmented HbF percentage, within a range of 2.5–
5.6-fold, while non-responders (III NR1–4) exhibited an
increased HbF percentage, always lower than 2.5-fold
difference (1.1–1.7) from baseline. Increased γ-globin
gene expression (ex vivo) under the presence of HU was well correlated with HbF expression levels in pa-tients at the plateau phase (in vivo) confirming ex-perimental culture conditions and concentrations of
HU added (Table 2).
In vivo methylation levels within CpG islands ofHBB cluster“modifier genes”among non-responders and responders receiving HU treatment and control group Methylation profiles of the selected CpGs were tested in genomic material derived from peripheral mono-nuclear blood cells (PBMCs) of non-responders (I
NR1–11) and responders (I R1–19) under long and
continuous HU therapy, and of the control group (II
CG1–20) (Additional file 1: Table S1). CpGs tested
were CpG120 and CpG115 of BCL11A, CpG98 of
KLF1, CpG216 ofMYB, CpG172 ofMAP3K5, CpG401
of SIN3A, CpG326 of ZBTB7A, and CpG515 of
GATA2(Table 1).
DNA from PBMCs showed an extensive heterogeneity
of the methylation levels of CpG islands, and
non-significant results were recorded apart from the
SIN3A CpG 401. SIN3A CpG 401 was deferentially
methylated between non-responders (I NR1–11) and
re-sponders (I R1–19) (p*, 0.024), with the non-responders
exhibiting higher methylation rates across the entire CpG DNA sequence (data not shown). Since it is not a
tissue-specific factor [32], the statistically significant
dif-ferentiation ofSIN3Amethylation with a consequent
dif-ferential expression of its protein product within PBMCs was not an unexpected result.
KLF1CpG98, ZBTB7ACpG326, and GATA2CpG515
did not alter significantly their methylation levels com-pared to all subgroups, before and after HU treatment.
MYB CpG216,MAP3K5CpG172, andBCL11ACpG120
had an established intrinsic methylation level of less than 10% among all groups; therefore, we concluded that we
could not deliver reliable results of the HU effect on their methylation status.
Differentiation of methylation profiles ofHBBcluster “modifier genes”caused by HU treatment in single BFU-E colonies derived from non-responders, responders, and control groups
To further explore the potential epigenetic influence of HU and to particularize it on cells of the erythroid lineage, we isolated well-defined single BFU-E colonies
(screened under an inverted microscope) [33] and
deter-mined hyper-/hypomethylation status of all CpGs in every single colony based on a slightly diverged
bisul-phite conversion protocol (described in the “Material
and methods” section) before and after the HU treat-ment of the cells. Although an inter-individual character between BFU-E-matured cells within a single colony could not be excluded, uniform distribution of methyla-tion profiles was observed in experimental replicates of
individual samples and among two or three (2–3)
differ-ent BFU-E colonies tested from the same donor.
Regarding the healthy control group, pluripotent hematopoietic stem cells from the peripheral (IV CG1-CG4) and umbilical cord blood (IV UCB1-UCB4) as well as from bone marrow aspirations (IV BM1-BM4) were included, to explore possible fundamental epigenetic similarities with hematopoietic pluripotent stem cells
de-rived from the patient’s groups (III NR1-NR4 and III
R1-R5). Responders (III R1-R5) and non-responders (III NR1-NR4) were also included in the in vitro assays, but had not entered the HU treatment regimen yet (in vitro
samples, Table 2). Assortment of Rs and NRs was done
long after the HU treatment initiation, based on their clinical characteristics and HbF induction at plateau phase. Hematopoietic pluripotent stem cells from all
dif-ferent tissues were expanded as described in the“
Mater-ial and methods” section both without (−HU) and with
(+HU) HU addition (100 μM), and at the BFU-E stage,
two to three single colonies from every sample were iso-lated separately and subjected to methylation assay.
The methylation status of all HBB cluster “modifier
genes”showed mean values below 50–60% along the
en-tire CpG sequences and exhibited hypomethylation in the presence of HU among all different groups of BFU-Es tested, which is consistent with the results from whole genome methylation assays during cell transition
from early hematopoietic CD34+ to erythroid lineage
committed cells [34].
MYB CpG216, MAP3K5 CpG172, and BCL11A
CpG120 had the exact negligible methylation level of
less than 10% before (−HU) and after the addition of the
drug (+HU), as mentioned in the in vivo methylation re-actions; therefore, statistical analysis of these areas was
To the rest of the studied CpGs, the addition of HU
(100μΜ) caused a general mild decrease in CpG
methy-lation status with minor exceptions. Differential baseline methylation patterns within the CpG islands were ob-tained, before the HU treatment, between the differently
originated descendants (BFUEs: IV CG1–4, III R1–5, III
NR1–4, IV UCB1–4, and IV BM1–4). This observation
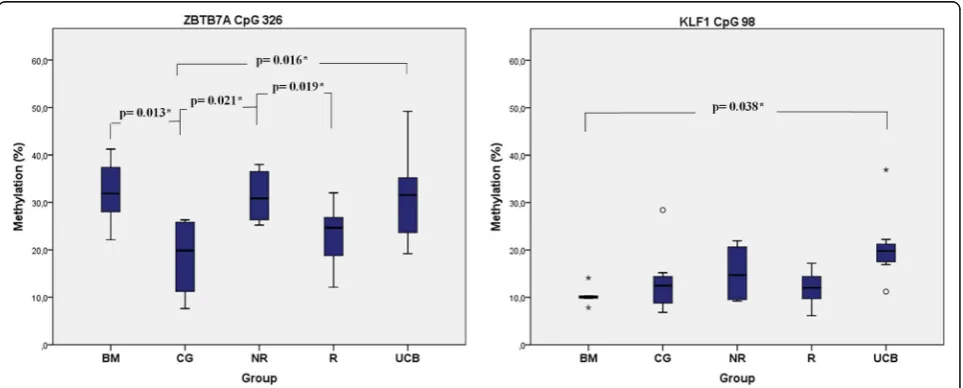
suggests that HU action exhibits epigenetic diversity to-wards individual primary cell types. Statistically signifi-cant differences in the baseline methylation levels were
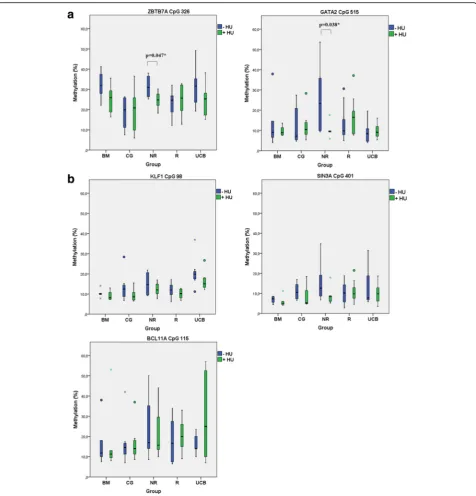
recorded from ZBTB7A CpG326 between both BM (p*,
0.013) and UCB (p*, 0.016) with CG and between NR
with CG (p*,0.021) and NR with R (p*, 0.019). Similar
re-sults were obtained fromKLF1CpG98 between BM and
UCB (p*, 0.038) (Fig.3).
Statistically significant hypomethylation was obtained
in the ZBTB7A (p*, 0.047) and GATA2(p*, 0.038) CpG
islands only in the NR group of patients after HU
treat-ment (Fig.4a). BFU-Es derived from the non-responders
showed the same trend of a mild hypomethylation
pro-file inKLF1,SIN3A, andBCL11ACpGs, but of no
statis-tical significance (Fig.4b) (Additional file1: Figure S2).
The hypomethylation status of the ZBTB7A CpG326
located at the gene’s proximal promoter region could
lead to a possible elevated expression of LRF (leukemia/ lymphoma-related factor) and the protein product of
ZBTB7A gene and could have emerged the failure of
γ-globin induction above the limit of the 2.1-fold
(max-imum observedγ-globin relative expression), on account
of the erythropoietic cells’ exposure to the HU agent
among non-responders. This observation led us to trace
LRF/ZBTB7A expression levels among responders and non-responders.
Detection and recording of LRF/ZBTB7AmRNA levels Specific primers to detect the LRF mRNA were designed
(Table3) and subjected to qPCR to quantitate its
expres-sion profile before and after the HU addition to culti-vated cells. Total RNA for qPCR experiments was extracted from 30 to 50 characterized BFU-E colonies
for each sample, to ensure that the LRF/ZBTB7A
expres-sion levels represent cells of the erythroid lineage and are consistent to similar methylation results obtained from single BFU-E colonies. LRF expression was
calcu-lated as previously described (“Materials and methods”
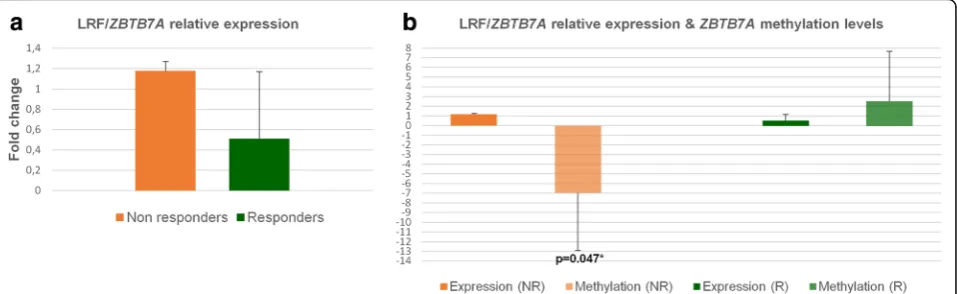
section). Relative LRF expression was elevated only in NR group (1.1 to1.4-fold increase) in the presence of HU, which was in consistency with the hypomethylation
results obtained in ZBTB7A CpG326 among the same
group (NRs) (Fig.5a, b). Similar studies delineate the
ex-pression of LRF/ZBTB7A at a more mature stage of red
cell differentiation, after the proerythroblast stage [35];
hence, its expression at BFU-E colonies is at a minimum detectable level and only upon the simultaneous treat-ment of cells with the HU.
Discussion
The fine regulation of the HBBcluster “modifier genes”
caused by their natural epigenetic variations on DNA methylation profile and/or by HU medication widely
used to treat β-hemoglobinopathies has been the target
of investigation in the present study. CpG islands
included in the study were the BCL11A, KLF1, MYB,
MAP3K5, SIN3A, ZBTB7A, and GATA2, which are known to influence the natural developmental switch in hemoglobin expression, from fetal to adult. Nuclear fac-tors and their genetic variations have long been investi-gated, but whether and to what extent they cooperate
with epigenetic signals in fetal globin repression/induc-tion is not yet fully understood.
The CpG sites selected for the present study bared factors involved in chromatin remodeling, such as the CCCT
C-binding factor, known as CTCFand the
leukemia/lym-phoma-related factor (LRF/ZBTB7A).CTCFis a chromatin
Fig. 4Mean methylation rate of CpG sites in single BFU-E colonies before and after HU treatment among all in vitro groups of samples (Table2).a
structural factor that plays a key role in gene expression through the activation or repression of gene promotes, the insulation of enhancers, and the regulation of distant
chromatin interactions [36]. Binding of CTCF on DNA
can be altered by DNA methylation. Especially, when CTCF-binding sites contain CpG dinucleotides, binding
could be methylation specific, suggesting a role forCTCF
in epigenetic regulatory mechanisms [37]. Our findings in
respect to the methylation repertory of the HBB cluster
“modifier genes” within the CpG regions encompassing
CTCF-binding sites showed that it was normally distrib-uted along the CpG island. These results indicated that the CTCF factor did not preserve any insulating function (at least for the genes studied) that could prevent the hypo- or hyper-methylation spreading across the specific CpG genome sequences, in the presence of HU.
The LRF/ZBTB7Ais a member of the POK (POZ/BTB
and Krüppel) protein family, which binds to CG-rich re-gions and recruits histone deacetylases to gene pro-moters leading to a closed chromatin conformation that
prevents transcription [38]. The bioinformatics analysis
showed that recognition binding sites for CTCF and
ZBTB7A factors were settled at contiguous DNA
se-quences, whileZBTB7A-binding sites were apparent in all
CpG areas selected for this study (Fig. 1). LRF/ZBTB7A
factor has been characterized as an HbF repressor that acts independently from the known fetal globin repressor
BCL11A, by recruitment of the NuRD complex [39, 40]. Another study has uncovered the combined action of
KLF1withZBTB7Ato depress HbF [41].
Results from the in vitro methylation assays performed in this study clearly showed a hypomethylating trend in
non-responders (III NR in Fig.4) in the presence of HU,
which reached a statistical significance for the ZBTB7A
(−HU/+HU, p*, 0.047) and the GATA2 (−HU/+HU, p*,
0.038) CpGs. Parallel gene expression experiments with RNA isolated from BFU-Es of the same cultures allowed us to directly correlate changes in methylation to gene
expression. Hypomethylation of the ZBTB7A CpG326
was associated with higher levels of LRF/ZBTB7A
ex-pression in non-responders (III NR), up to 1.4-fold
(Fig. 5). Hypomethylation ofGATA2CpG515 potentially
enhances the GATA2 protein expression too, but levels of GATA2 mRNA were not targeted in this study. The GATA2 high expression was considered assured as pre-mature erythroid cells (and BFU-Es) are known to ex-press higher levels of GATA2, which in later stages of
maturation switches to GATA1 [28,42].
The HU hypomethylation effect was also visible inKLF1
CpG98,SIN3ACpG401, andBCL11ACpG115, but not at
significant rates, whereas MYB CpG216, MAP3K5
CpG172, andBCL11ACpG120 were methylated at
nuga-tory values before and after HU. The detected minor changes in their methylation profiles were likely to be bor-derline, and thus, statistical analysis of these areas was not performed. Furthermore, the non-responder group of pa-tients (III NR) had an established baseline higher
methyla-tion profile in CpG326 ofZBTB7A, in the absence of HU,
compared to responders (III R) (p*, 0.019) and healthy
do-nors (IV CG) (p*, 0.021) (Fig.3), suggesting an underlying
epigenetic mechanism of HU action by the methylation
modulation of the ΖΒΤΒ7Α, leading to an amplitude
modulation of its expression. The LRF encoded by the
ZBTB7A gene preferentially binds methylated CpGs and
acts as a γ-globin repressor [39]. This is in accordance
with our results derived from the HU non-responders. Probably, their higher baseline methylation status along
theHBB“modifier gene loci”favors the LRF binding,
lead-ing to a hardly irreversible suppression of the HbF pro-duction even under the HU influence.
Fig. 5Relative expression of LRF/ZBTB7Aand statistical correlations between gene’s methylation and expression.aRelative expression of LRF/
Additionally, there were statistically significant
differ-ences in the CpG326 of ZBTB7A among IV CG and IV
UCB (p*, 0.016) and IV CG and IV BM (p*, 0.013).
Evi-dence from human systems indicates that pluripotent hematopoietic stem cells exhibit an epigenetic memory,
related to their donor cell type of origin [43], and our
re-sults support these observations.
Results of the present study indicate that HU resets the methylation status and eventually the basal program of ex-pression for several factors and definitely to loci unlinked
to theHBBcluster. The HU non-responders demonstrated
an extra barrier of epigenetic regulation for theγ-globin
re-activation. Even though HU provoked a similar terminal hypomethylation status to both the HU non-responders
and HU responders, (Fig.4a), theγ-globin expression was
not ultimately prevailed in the HU non-responders. The
most likely explanation is that expression of the β- and
γ-globin genes is still inherently unstable at the BFU-E
stage and that micro-environmental conditions persisting
during the erythroid differentiation determine whether β
-orγ-globin expression will be favored.
Previous attempts to detect DNA methylation changes in CpG sequences lying at neighboring areas to the
γG
-globin promoter have not achieved any informative
insights [44]. Also, the HU epigenetic effect is
mani-fested only in HBB modifier factors, derived from cells
of the erythroid lineage, which was apparent from our study. A considerable heterogeneity on the epigenetic ef-fect detected at the in vivo samples was attributed to the different origins and the subsistence of mixed cell popu-lations within PBMCs. On the contrary, BFUEs (in vitro samples) consist of a cell population obtained from cell/ tissue culture systems, uniformly differentiated towards the erythropoietic lineage, albeit PBMCs isolated from blood samples included a mixture of all mononuclear blood cells, which although they were exposed to the daily dose of HU, they seem not to have responded homogeneously. The methylation profile of all CpG islands gave significant results only when the research focused on well-characterized single erythroid colonies
(BFU-Es), with the unique exception of the SIN3ACpG
401, which is not an erythroid tissue-specific factor. The SIN3A protein consists of multiple protein interaction domains and contacts a variety of binding partners to perform its biological function, whereas it is considered to co-operate with histone-modifying complexes
exhibit-ing a global transcription regulatory property [32].
Hence, SIN3A was differentially methylated (p*, 0.024)
between the in vivo samples (PBMCs) of HU non-re-sponders and HU renon-re-sponders.
The role of ZBTB7A as an HbF repressor is fully
supported by our data, due to its broad existence as a binding factor to all CpG islands selected and analyzed in this study, its significant hypomethylation, and the
elevated levels (although modest) of LRF/ZBTB7A
ex-pression in non-responders treated with HU (Fig.5). On
the contrary, the baseline hypomethylated ZBTB7A-binding sites in the HU responder group of patients ei-ther do not show preference for the LRF binding or LRF is produced at adverse levels unable to force the
γ-globin repression.
The present epigenetic analysis of the HBB cluster
“modifier genes” provides some valuable information
related to the heterogeneous response to HU, in an
effort to predict patients’ response to treatment. We
evaluated the HU potential as a hypomethylating agent although HU has not been previously associated with epigenetic responses, other than enhancing the
expres-sion of specific miRNAs [45–47]. Several miRNAs have
been highlighted as epigenetic regulators of erythroid differentiation that influence HbF production (miR-26b, miR-151-3p, miR210) upon HU treatment. In contrast to fixed genome sequence, epigenetic patterns are plas-tic; thus, correcting aberrant, disease-causing epigenetic marks holds considerable therapeutic promise.
Conclusions and future perspectives
A drawback to current HU treatment for the SCA and
SCA/β-thal patients is its non-specific effects. Our
phar-macoepigenomic study reveals the epigenetic pharmaco-logical activity of HU distinguishes the different epigenetic regulatory nuclear mechanisms acting among HU re-sponders and HU non-rere-sponders and contributes to the development of a clinical algorithm for improved
predic-tion of the patients’response to HU treatment.
The ZBTB7Aappears as an emerging epigenetic regu-lator of the HbF induction bypassing the already known
repressors of γ-globin expression.ZBTB7A possibly
ex-erts its repressing function to theγ-globin gene through
a chromatin remodeling pathway, which is supported by the broad existence of its multiple recognition binding
sites close to all HBBcluster“modifier loci” tested. The
ZBTB7A/LRF epigenetically induced binding to
precon-figured HBB cluster “modifier genes” promoters should
also be investigated, to uncover the vital changes to pro-moter accessibility and subsequent motivations for gene activation or repression.
islands of different tissues are uniformly targeted by the
epigenetic machinery components or some are “
safe-guarded” by nuclear factors and remain unaffected need
further insight.
Contemporary medication focused on the HBB
locus-specific modifiers, used in conjunction with
epi-genetic biomarkers of response, as ZBTB7A CpG326
and GATA2CpG515, highlighted in this study, will en-able truly precision interventions.
Additional file
Additional file 1:Table S1.Hematological data of HU responders (R) and HU non-responders (NR) used as in vivo samples. Figure S1 In vivo HbF levels andγ-globin expression in vitro before and after HU treatment. (a) III NR2 and (b) III NR4 patients (Table2) at baseline of HbF expression before HU treatment (c) III NR2, (d)III NR4 and (e) III R5 patients at the plateau phase, with maximum detected HbF expression levels. Arrows show the HbF curve. (f)γ-globin gene expression in BFU-E colonies calculated as relative expression of treated compared to untreated with HU colonies, using the formula 2(-ΔCt)and normalized to the referenceGAPDHgene.
Figure S2 DNA methylation levels estimated by the pyrosequencing CpG assay. Typical pyrograms displaying DNA methylation analyses before and after cells’treatment with HU of: (a)ZBTB7ACpG 326, (b) GATA2CpG 515, (c)
KLF1CpG 98, (d)SIN3ACpG 401, (e)BCL11ACpG 115. Figure S3 DNA methylation levels less than 10% either with or without the addition of HU, estimated using the pyrosequencing CpG assay. Typical pyrograms displaying DNA methylation levels of (a)BCL11ACpG 120, and (b)MYBCpG 216. (ZIP 3179 kb)
Abbreviations
BFU-E:Burst-forming unit-erythroid; BM: Bone marrow; CFU: Colony-forming unit assay; CFU-E: Colony-forming unit-erythroid; CG: Control group; HbF: Fetal hemoglobin; HU: Hydroxyurea; NR: Non-responders; PBMCs: Peripheral blood mononuclear cells; R: Responders; SCA: Sickle cell anemia; UCB: Umbilical cord blood
Acknowledgements
The authors wish to thank all patients and donors for providing samples for the completion of this research. We would like to thank Vassiliki Pesli, who performed all venipunctures to patients and controls for blood collection, and Constantina Argyropoulou, who performed the HPLC for HbF estimations. We also acknowledge George Georgis from HOU for providing technical assistance with the figures.
Funding
This research was financially supported by PENER_EAP_2016 grant of the Hellenic Open University.
Availability of data and materials
The datasets supporting the conclusions of this article are included within the article and its Additional file1.
Authors’contributions
VC designed and performed all methylation assays and was responsible for the CFU cultures. EFS designed and performed qPCRs and was also responsible for the CFU cultures. AKS, ArSy, EV, and PC were responsible for monitoring of the patients, collection of their hematological data, and revision of the manuscript. GM did all the bioinformatics analysis. VF performed the statistical analysis. GPP, AP, and ArSg designed the study, elaborated the data, and reviewed the manuscript. ArSg supervised the whole research project and wrote the manuscript. All authors read and approved the final manuscript.
Ethics approval and consent to participate
The whole process of sample collection (peripheral blood and bone marrow aspirations) was carried in accordance to ethical guidelines and under the
supervision of the Thalassemia & Hemoglobinopathies Unit, Division of Hematology of the Patras’University Hospital. The study has been approved by the Patras’University Hospital Ethical and Scientific Committee, and a written informed consent to participation from all patients and healthy donors was obtained. Fresh umbilical cord blood samples were collected from the Hellenic Cord Blood Bank (HCBB) of the Biomedical Research Foundation Academy of Athens from healthy donors after their positive response to donate a portion of the sample (2–3 ml) for scientific research purposes.
Consent for publication Not applicable.
Competing interests
The authors declare that they have no competing interests.
Publisher’s Note
Springer Nature remains neutral with regard to jurisdictional claims in published maps and institutional affiliations.
Author details 1
School of Science and Technology, Biology Laboratory, Hellenic Open University, Patras, Greece.2Faculty of Medicine, Biology Laboratory, University
of Ioannina, Ioannina, Greece.3Thalassemia and Hemoglobinopathies Unit, Hematology Division, Department of Internal Medicine, General University Hospital of Patras, Patras, Greece.4School of Science and Technology, Digital Systems and Media Computing Laboratory, Hellenic Open University, Patras, Greece.5Medical School, Hematology Division, Department of Internal Medicine, University of Patras, Patras, Greece.6Thalassemia Unit, “Hippokrateio”General Hospital of Thessaloniki, Thessaloniki, Greece.
7Thalassemia and Sickle Cell Unit, AHEPA University General Hospital of
Thessaloniki, Thessaloniki, Greece.8School of Health Sciences, Department of Pharmacy, Laboratory of Pharmacogenomics and Individualized Therapy, University of Patras, Patras, Greece.9Medical Faculty, Laboratory of General Biology, University of Patras, Patras, Greece.
Received: 1 August 2018 Accepted: 11 September 2018
References
1. Taher AVE, Musallam K, Cappellini MD, Viprakasit V. Guidelines for the management of non transfusion dependent thalassaemia (NTDT). Nicosia Cyprus: Thalassaemia International Federation; 2013.
2. Giannopoulou E, Bartsakoulia M, Tafrali C, Kourakli A, Poulas K, Stavrou EF, et al. A single nucleotide polymorphism in the HBBP1 gene in the human beta-globin locus is associated with a mild beta-thalassemia disease phenotype. Hemoglobin. 2012;36(5):433–45.https://doi.org/10.3109/ 03630269.2012.717515.
3. Lessard S, Beaudoin M, Benkirane K, Lettre G. Comparison of DNA methylation profiles in human fetal and adult red blood cell progenitors. Genome Med. 2015;7(1):1.https://doi.org/10.1186/s13073-014-0122-2. 4. Lavelle DE. The molecular mechanism of fetal hemoglobin reactivation.
Semin Hematol. 2004;41(4 Suppl 6):3–10.
5. Gravia A, Chondrou V, Sgourou A, Papantoni I, Borg J, Katsila T, et al. Individualizing fetal hemoglobin augmenting therapy for beta-type hemoglobinopathies patients. Pharmacogenomics. 2014;15(10):1355–64. https://doi.org/10.2217/pgs.14.101.
6. Kolliopoulou A, Stratopoulos A, Siamoglou S, Sgourou A, Ali BR, Papachatzopoulou A, et al. Key pharmacogenomic considerations for sickle cell disease patients. OMICS. 2017;21(6):314–22.https://doi.org/10.1089/omi. 2017.0058.
7. Platt OS, Orkin SH, Dover G, Beardsley GP, Miller B, Nathan DG. Hydroxyurea enhances fetal hemoglobin production in sickle cell anemia. J Clin Invest. 1984;74(2):652–6.https://doi.org/10.1172/JCI111464.
8. Mabaera R, West RJ, Conine SJ, Macari ER, Boyd CD, Engman CA, et al. A cell stress signaling model of fetal hemoglobin induction: what doesn't kill red blood cells may make them stronger. Exp Hematol. 2008;36(9):1057–72. https://doi.org/10.1016/j.exphem.2008.06.014.
Blood. 2013;121(12):2199–212; quiz 372. https://doi.org/10.1182/blood-2012-10-408021.
10. Rigano P, Pecoraro A, Calzolari R, Troia A, Acuto S, Renda D, et al. Desensitization to hydroxycarbamide following long-term treatment of thalassaemia intermedia as observed in vivo and in primary erythroid cultures from treated patients. Br J Haematol. 2010;151(5):509–15. https://doi.org/10.1111/j.1365-2141.2010.08397.x.
11. Mancuso A, Maggio A, Renda D, Di Marzo R, Rigano P. Treatment with hydroxycarbamide for intermedia thalassaemia: decrease of efficacy in some patients during long-term follow up. Br J Haematol. 2006;133(1):105–6. https://doi.org/10.1111/j.1365-2141.2006.06002.x.
12. Gluckman PD, Hanson MA, Buklijas T, Low FM, Beedle AS. Epigenetic mechanisms that underpin metabolic and cardiovascular diseases. Nat Rev Endocrinol. 2009;5(7):401–8.https://doi.org/10.1038/nrendo.2009.102. 13. Tang J, Xiong Y, Zhou HH, Chen XP. DNA methylation and personalized
medicine. J Clin Pharm Ther. 2014;39(6):621–7.https://doi.org/10.1111/jcpt. 12206.
14. Bird A. DNA methylation patterns and epigenetic memory. Genes Dev. 2002;16(1):6–21.https://doi.org/10.1101/gad.947102.
15. Sheehan VA, Luo Z, Flanagan JM, Howard TA, Thompson BW, Wang WC, et al. Genetic modifiers of sickle cell anemia in the BABY HUG cohort: influence on laboratory and clinical phenotypes. Am J Hematol. 2013;88(7): 571–6.https://doi.org/10.1002/ajh.23457.
16. Liu P, Keller JR, Ortiz M, Tessarollo L, Rachel RA, Nakamura T, et al. Bcl11a is essential for normal lymphoid development. Nat Immunol. 2003;4(6):525–32. https://doi.org/10.1038/ni925.
17. Tafrali C, Paizi A, Borg J, Radmilovic M, Bartsakoulia M, Giannopoulou E, et al. Genomic variation in the MAP3K5 gene is associated with beta-thalassemia disease severity and hydroxyurea treatment efficacy. Pharmacogenomics. 2013;14(5):469–83.https://doi.org/10.2217/pgs.13.31.
18. Gravia‡A, Chondrou‡V, Kolliopoulou A, Kourakli A, John A, Symeonidis A, Ali BR, Sgourou A, Papachatzopoulou A, Katsila T, Patrinos GP.”Correlation of SIN3A genomic variants withβ-hemoglobinopathies disease severity and hydroxyurea treatment efficacy”. Pharmacogenomics. 2016;17(16).https:// doi.org/10.2217/pgs-2016-0076,https://www.ncbi.nlm.nih.gov/pubmed/ 27767389.
19. Uda M, Galanello R, Sanna S, Lettre G, Sankaran VG, Chen W, et al. Genome-wide association study shows BCL11A associated with persistent fetal hemoglobin and amelioration of the phenotype of beta-thalassemia. Proc Natl Acad Sci U S A. 2008;105(5):1620–5.https://doi.org/10.1073/pnas. 0711566105.
20. Zhou D, Liu K, Sun CW, Pawlik KM, Townes TM. KLF1 regulates BCL11A expression and gamma- to beta-globin gene switching. Nat Genet. 2010; 42(9):742–4.https://doi.org/10.1038/ng.637.
21. Zhang JS, Moncrieffe MC, Kaczynski J, Ellenrieder V, Prendergast FG, Urrutia R. A conserved alpha-helical motif mediates the interaction of Sp1-like transcriptional repressors with the corepressor mSin3A. Mol Cell Biol. 2001; 21(15):5041–9.https://doi.org/10.1128/MCB.21.15.5041-5049.2001. 22. Wahlberg K, Jiang J, Rooks H, Jawaid K, Matsuda F, Yamaguchi M, et al. The
HBS1L-MYB intergenic interval associated with elevated HbF levels shows characteristics of a distal regulatory region in erythroid cells. Blood. 2009; 114(6):1254–62.https://doi.org/10.1182/blood-2009-03-210146.
23. Kawata H, Yamada K, Shou Z, Mizutani T, Yazawa T, Yoshino M, et al. Zinc-fingers and homeoboxes (ZHX) 2, a novel member of the ZHX family, functions as a transcriptional repressor. Biochem J. 2003;373(Pt 3):747–57. https://doi.org/10.1042/BJ20030171.
24. Sankaran VG, Xu J, Ragoczy T, Ippolito GC, Walkley CR, Maika SD, et al. Developmental and species-divergent globin switching are driven by BCL11A. Nature. 2009;460(7259):1093–7.https://doi.org/10.1038/nature08243. 25. Dumitriu BB, Dy P, Huang P, Quayum Y, Jensen N, Lefebvre J. Sox6 is
necessary for efficient erythropoiesis in adult mice under physiological and anemia-induced stress conditions. PLoS One. 2010;5(8):e12088.https://doi. org/10.1371/journal.pone.0012088.
26. Borg J, Papadopoulos P, Georgitsi M, Gutierrez L, Grech G, Fanis P, et al. Haploinsufficiency for the erythroid transcription factor KLF1 causes hereditary persistence of fetal hemoglobin. Nat Genet. 2010;42(9):801–5.https://doi.org/10. 1038/ng.630.
27. Borg J, Patrinos GP, Felice AE, Philipsen S. Erythroid phenotypes associated with KLF1 mutations. Haematologica. 2011;96(5):635–8.https://doi.org/10. 3324/haematol.2011.043265.
28. Suzuki M, Yamamoto M, Engel JD. Fetal globin gene repressors as drug targets for molecular therapies to treat the beta-globinopathies. Mol Cell Biol. 2014;34(19):3560–9.https://doi.org/10.1128/MCB.00714-14.
29. Kent WJ, Sugnet CW, Furey TS, Roskin KM, Pringle TH, Zahler AM, et al. The human genome browser at UCSC. Genome Res. 2002;12(6):996–1006. https://doi.org/10.1101/gr.229102.
30. Consortium. EP. An integrated encyclopedia of DNA elements in the human genome. Nature. 2012;489(7414):57–74.https://doi.org/10.1038/nature11247. 31. Shen Y, Cao R, Liu W, Zhou Y, Wu Y, Tan J, et al. Negative feedback loop
between ZBTB7A and TGF-beta in breast cancer. Oncol Lett. 2017;14(2): 1403–10.https://doi.org/10.3892/ol.2017.6291.
32. Chaubal A, Pile LA. Same agent, different messages: insight into transcriptional regulation by SIN3 isoforms. Epigenetics Chromatin. 2018; 11(1):17.https://doi.org/10.1186/s13072-018-0188-y.
33. Nissen-Druey CT, A. Meyer-Monard, S. Human hematopoietic colonies in health and disease.; 2005.
34. Yu Y, Mo Y, Ebenezer D, Bhattacharyya S, Liu H, Sundaravel S, et al. High resolution methylome analysis reveals widespread functional hypomethylation during adult human erythropoiesis. J Biol Chem. 2013; 288(13):8805–14.https://doi.org/10.1074/jbc.M112.423756.
35. Maeda T. Regulation of hematopoietic development by ZBTB transcription factors. Int J Hematol. 2016;104(3):310–23. https://doi.org/10.1007/s12185-016-2035-x.
36. Kim S, Yu NK, Kaang BK. CTCF as a multifunctional protein in genome regulation and gene expression. Exp Mol Med. 2015;47:e166.https://doi.org/ 10.1038/emm.2015.33.
37. Filippova GN. Genetics and epigenetics of the multifunctional protein CTCF. Curr Top Dev Biol. 2008;80:337–60. https://doi.org/10.1016/S0070-2153(07)80009-3.
38. Lunardi A, Guarnerio J, Wang G, Maeda T, Pandolfi PP. Role of LRF/Pokemon in lineage fate decisions. Blood. 2013;121(15):2845–53.https://doi.org/10. 1182/blood-2012-11-292037.
39. Masuda T, Wang X, Maeda M, Canver MC, Sher F, Funnell AP, et al. Transcription factors LRF and BCL11A independently repress expression of fetal hemoglobin. Science. 2016;351(6270):285–9.https://doi.org/10.1126/ science.aad3312.
40. Vinjamur DS, Bauer DE, Orkin SH. Recent progress in understanding and manipulating haemoglobin switching for the haemoglobinopathies. Br J Haematol. 2018;180(5):630–43.https://doi.org/10.1111/bjh.15038. 41. Norton LJ, APW F, Burdach J, Wienert B, Kurita R, Nakamura Y, et al. KLF1
directly activates expression of the novel fetal globin repressor ZBTB7A/LRF in erythroid cells. Blood Adv. 2017;1(11):685–92.https://doi.org/10.1182/ bloodadvances.2016002303.
42. Anguita E, Hughes J, Heyworth C, Blobel GA, Wood WG, Higgs DR. Globin gene activation during haemopoiesis is driven by protein complexes nucleated by GATA-1 and GATA-2. EMBO J. 2004;23(14):2841–52.https://doi. org/10.1038/sj.emboj.7600274.
43. Kim K, Zhao R, Doi A, Ng K, Unternaehrer J, Cahan P, et al. Donor cell type can influence the epigenome and differentiation potential of human induced pluripotent stem cells. Nat Biotechnol. 2011;29(12):1117–9.https:// doi.org/10.1038/nbt.2052.
44. Walker AL, Steward S, Howard TA, Mortier N, Smeltzer M, Wang YD, et al. Epigenetic and molecular profiles of erythroid cells after hydroxyurea treatment in sickle cell anemia. Blood. 2011;118(20):5664–70.https://doi.org/ 10.1182/blood-2011-07-368746.
45. Bianchi N, Zuccato C, Lampronti I, Borgatti M, Gambari R. Expression of miR-210 during erythroid differentiation and induction of gamma-globin gene expression. BMB Rep. 2009;42(8):493–9.
46. Svasti S, Masaki S, Penglong T, Abe Y, Winichagoon P, Fucharoen S, et al. Expression of microRNA-451 in normal and thalassemic erythropoiesis. Ann Hematol. 2010;89(10):953–8.https://doi.org/10.1007/s00277-010-0980-7. 47. Lulli V, Romania P, Morsilli O, Cianciulli P, Gabbianelli M, Testa U, et al.