G E N O M E D A T A B A S E
Open Access
Identify Down syndrome transcriptome
associations using integrative analysis of
microarray database and
correlation-interaction network
Min Chen
1,2,3,4,5†, Jiayan Wang
1,2,3,4†, Yingjun Luo
7†, Kailing Huang
7, Xiaoshun Shi
8, Yanhui Liu
7, Jin Li
9,
Zhengfei Lai
1, Shuya Xue
1,2,3,4,5, Haimei Gao
1,2,3,4,5, Allen Chen
6,7and Dunjin Chen
1,2,3,4,5*Abstract
Background:Long non-coding RNAs (lncRNAs) have previously been emerged as key players in a series of biological processes. Dysregulation of lncRNA is correlated to human diseases including neurological disorders. Here, we developed a multi-step bioinformatics analysis to study the functions of a particular Down syndrome-associated gene DSCR9 including the lncRNAs. The method is named correlation-interaction-network (COIN), based on which a pipeline is implemented. Co-expression gene network analysis and biological network analysis results are presented. Methods:We identified the regulation function of DSCR9, a lncRNA transcribed from the Down syndrome critical region (DSCR) of chromosome 21, by analyzing its co-expression genes from over 1700 sets and nearly 60,000 public Affymetrix human U133-Plus 2 transcriptional profiling microarrays. After proper evaluations, a threshold is chosen to filter the data and get satisfactory results. Microarray data resource is from EBI database and protein–protein interaction (PPI) network information is incorporated from the most complete network databases. PPI integration strategy guarantees complete information regarding DSCR9. Enrichment analysis is performed to identify significantly correlated pathways. Results:We found that the most significant pathways associated with the top DSCR9 co-expressed genes were shown to be involved in neuro-active ligand-receptor interaction (GLP1R, HTR4, P2RX2, UCN3, and UTS2R), calcium signaling pathway (CACNA1F, CACNG4, HTR4, P2RX2, and SLC8A3), neuronal system (KCNJ5 and SYN1) by the KEGG, and GO analysis. The A549 and U251 cell lines with stable DSCR9 overexpression were constructed. We validated 10 DSCR9 co-expression genes by qPCR in both cell lines with over 70% accuracy.
Conclusions:DSCR9 was highly correlated with genes that were known as important factors in the developments and functions of nervous system, indicating that DSCR9 may regulate neurological proteins regarding Down syndrome and other neurological-related diseases. The pipeline can be properly adjusted to other applications.
Keywords:lncRNA, DSCR9, Down syndrome, Protein–protein interaction, Correlation-interaction-network, Neurological diseases
* Correspondence:[email protected] †Equal contributors
1Department of Fetal Medicine and Prenatal Diagnosis, the Third Affiliated
Hospital of Guangzhou Medical University, Guangzhou 510150, China
2Obstetrics and Gynecology Institute of Guangzhou, Guangzhou 510150,
China
Full list of author information is available at the end of the article
Introduction
Down syndrome (DS) is the most common chromosome disorder occurring in about one per 700 newborns each year [1]. Although it has been well established that an extra copy of chromosome 21 causes DS, the genetic and molecular mechanisms of the disease are yet unclear. Studies on partial trisomy have led to the characterization of a region of the chromosome 21 known as Down syn-drome critical region (DSCR), which is located at the dis-tal end of the long arm of chromosome 21 (21q22.1–22.3) and has candidate genes whose imbalance may induce a marked cognitive deficit as well as other pathologies and associated conditions [2]. Although the involvement of DSCR as the sole cause of DS symptoms is still controver-sial, previous studies have suggested that this region plays a primary role in the genetic interactions related to the pathogenesis of DS. Nevertheless, it has not been com-pletely understood what exact subset of genes that are over-expressed on chromosome 21 generating these DS-related deficiencies. Most studies focus on protein-coding genes in DSCR, whereas little is known about the three long non-coding RNAs (lncRNAs): DSCR8, DSCR9, and DSCR10.
LncRNAs are a large class of non-protein-coding tran-scripts that are greater than 200 bases in length and are in-volved in numerous physiological and pathological processes [3]. Only a small number of lncRNAs have been characterized functionally, while most of them were shown to control gene expression by regulating various aspects of gene expression [4]. Many lncRNAs are shown to regulate important cancer hallmarks including proliferation, apoptosis, metastasis, metabolism, senescence, and drug-resistance [5]. In addition, cumulative evidence have demonstrated that lncRNAs contribute to the complex biological system organization and gene regulatory networks of the central nervous system affecting brain pat-terning, neural stem cell maintenance, neurogenesis and gliogenesis, stress responses, and synaptic and neural plas-ticity. A number of lncRNAs are linked to neurological dis-eases such as the dysregulated BACE1-AS and BC200 in Alzheimer’s disease [6]. However, evidence of any lncRNA being involved in DS has not yet been fully elucidated. Pre-vious studies showed that NRON (ncRNA repressor of the nuclear factor of activated T cells) was an lncRNA mediat-ing the cytoplasmic to nuclear shuttlmediat-ing of the NFAT tran-scription factor. In animal models, deregulation of the DSCR1 and DYRK1A acts synergistically to prevent nu-clear occupancy of NFATc transcription factors leading to reduced NFATc activity and to a number of features of DS [7]. However, a conclusive link between this lncRNA and DS pathophysiology has not been reported so far.
In current study, we aimed to find lncRNAs that are related to Down syndrome by establishing a systematic bioinformatics analysis as well as the pipeline to predict
functions of lncRNAs on human chromosome 21 and by validating their potential regulatory target mRNAs by qPCR. After mining the RNA expression data from Affy-metrix transcriptional profiling microarrays, the func-tions of the DSCR9 lncRNA were found to be enhanced in neurological-related pathways, which might cause Down syndrome and other neurological diseases.
Materials and methods lncRNA probe localization
The probe sequence of Affymetrix U133 Plus 2 Platform (http://www.ncbi.nlm.nih.gov/geo/query/acc.cgi?a cc=GPL570) containing over 4000 sets of data were ob-tained from NCBI GEO database. They were aligned with the human genome hg19 and GENCODE (version 18) using the BLAT with parameters‘-stepSize = 5-repMatch = 1,000,000-minScore = 0-minIdentity = 0’based on an ef-ficient algorithm for microarray probe re-annotations [8]. BLAT results with no more than two mismatches were saved for our study.
Expression data collection and pre-processing
The gene expression data from NCBI GEO database that mentioned above were retrieved from EBI ArrayExpress database [9] by Bioconductor package ArrayExpress [10]. EBI, NCBI, and DDBJ are three high-throughput data exchanging portals, where data will be updated to the newest. In particular, the chip data of EBI is extremely clear, which includes details of the data such as sample information, chip location information, chip signals, and so on. So we chose the EBI database and the data therein for our analysis. Incorporated CEL files were pre-processed using robust multichip average (RMA) normalization method. The standard deviation of the expression levels was calculated. LncRNAs including HOTTIP, HOTAIR, and DSCR9 were analyzed. Datasets with low standard de-viation level (< 0.25) were filtered out, and the remaining experimental data were used for proceeding the analysis. According to [11], and using 0.25 as the threshold, we find that the transcriptomic changes of the data are significant enough to determine the lncRNA-related genes. Therefore, we utilize this value (0.25) as the cutoff to guarantee high quality of the data and in the meanwhile capture signifi-cantly correlated transcriptome information.
Statistics analysis
Pearson correlation between lncRNA probe (e.g., HOT-TIP, HOTAIR, or DSCR9) and other 54,674 probes were calculated. p values were presented as unmodified p values. Multiple testing corrections were performed using theqvalue package in R [12]. Genes withqvalues lower than 0.05 were considered as significant to be co-expression genes of lncRNA.
Protein–protein interaction (PPI) network for co-expression genes
The protein–protein interaction (PPI) network, includ-ing all the top co-expression genes of DSCR9, was con-structed to identify the most important functional relevance of DSCR9. Moreover, all the PPI relationships from the following databases: HPRD, IntAct, MIPS, BIND, DIP, MINT, PDZBase, and Reactome, were com-bined to gain a more comprehensive understanding of the interactions between DSCR9 and its potential target genes based on a previously described method [13]. We used default options of the abovementioned eight networks and interactomes that were found in at least one of these networks will be integrated into our ana-lysis. In this manner, all relevant interactomes regarding DSCR9 will be considered. Finally, the PPI network was visualized with Cytoscape software [14].
Biological pathway analysis
Genes that showed the highest correlation with lncRNA expression level were used for the biological pathway analysis. Parameters used in our pathway analysis were listed as following: (1) two pathway databases were included: KEGG pathway database [15] and Reactome pathway database [16]; (2) the hypergeometric distribu-tion was employed to calculate the probability of a par-ticular group of genes annotated to the pathway, comparing to all the other human genes in the genome; (3) raw p value was adjusted for multiple testing using
the Bonferroni correction method [17]; (4) pathways with adjustedpvalue < 0.05 were regarded as the signifi-cantly enriched pathways.
Collection of DSCR9 transcription data in human brain DSCR9 expression levels in different human tissues were collected from the Nonhuman Primate Reference Tran-scriptome Resource project [18]. The DSCR9 RNA levels in various regions of human brain were obtained from Babru Samal’s molecular brain project (www.molecular-brain.org/). Data on the transcription factor binding sites were collected from Encyclopedia of DNA Elements (ENCODE) project.
Cell culture
A549 and U231 cells were purchased from American Type Culture Collection. All cells were maintained in DMEM medium (Gibco) supplemented with 10% fetal bovine serum (FBS, Gibco), 100 U/ml penicillin sodium, and 100 mg/ml streptomycin sulfate at 37 °C. All cell lines were passaged for less than 6 months.
Plasmid construction and stable cell line construction The genomic segment corresponding to DSCR9 was amplified from human genomic DNA and then cloned into the pcDNA3.1 vector. The correct amplified frag-ments were identified by restriction endonuclease diges-tion and were confirmed by sequencing.
Glioma cells U251 and lung cancer cells A549 and were transiently transfected with 4 μg empty vector (pcDNA3.1) as a control or recombinant expression plasmid pcDNA3.1-DSCR9 using Lipofectamine 2000 (Invitrogen, Carlsbad, CA, USA) reagent according to manufacturer’s instructions. The expression of DSCR9 and other predicted genes were determined by qPCR assay at 48 h post transfection.
Quantitative analysis of DSCR9 and its potential mRNA targets
Total RNAs were extracted from cultured cell lines using the Trizol RNA Reagent (Invitrogen, Carlsbad CA, USA). The RNA concentration was determined by 260/280 nm absorbances using a Nanodrop Spectrophotometer (ND-100, Thermo, USA). QPCR assays were performed using the K1622 RevertAid First Strand cDNA Synthesis Kit (Thermo Scientific) and GoTaq® qPCR Master Mix (Pro-mega) according to the manufacturer’s instructions in an Applied Biosystems 7500 Fluorescent Quantitative PCR System (Applied Biosystems, Foster City, CA, USA). The
reaction mixtures were incubated at 95 °C for 30 s followed by 45 amplification cycles of 95 °C for 5 s and 60 °C for 30 s. GAPDH and U6 were used as endogenous controls for mRNA and DSCR9 expressions, respectively. Expressions were normalized to endogenous controls, and the fold change of gene expression was calculated as 2
−ΔΔCt. Three independent experiments were each
per-formed in triplicates. The primer sequences were listed in additional Additional file 1: Table S1.
Results
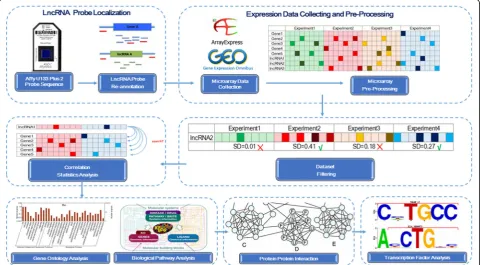
To identify the potential target genes of lncRNAs, we devel-oped a bioinformatics analysis. Perl and R scripts mainly create the pipeline that implemented. We obtained nearly 6000 lncRNA probes with high confidence in U133 Plus 2.0 Array. All co-expressed probes showing high correlations with the interesting lncRNA were used for the subsequent gene ontology (GO) analysis, KEGG biological pathway analysis, and protein–protein interaction (PPI) analysis. Additionally, the transcription factor binding sites (TFBS) of our target genes were predicted based on the ENCODE
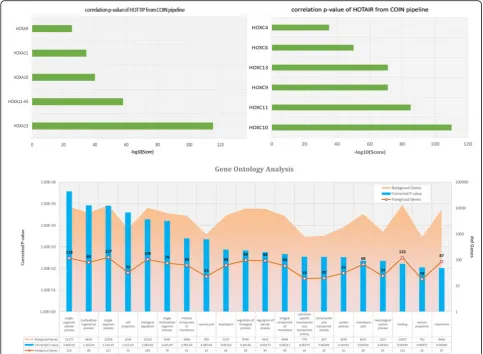
Fig. 2Prediction of lncRNAs HOTTIP and HOTAIR top co-expression genes and functional enrichment pathways by our COIN analysis pipeline
project datasets. The correlation-interaction-network (COIN) bioinformatics analysis was summarized as Fig. 1.
Validation of COIN prediction with lncRNAs: HOTTIP and HOTAIR
By applying the analysis approach, we found HOTTIP was highly correlated with six HOXA family genes (HOXA13, HOXA11-AS, HOXA10, HOXA11, HOXA9, and HOXA10-AS) that are adjacent to HOTTIP,
suggesting the potential regulatory roles of HOTTIP on the HOXA locus genes (Fig. 2). Our HOTTIP target genes and functional analysis was consistent with previ-ous studies, showing that HOTTIP coordinates the acti-vation of several 5’HOXA genes in vivo, and is involved in forelimb morphogenesis as well as proximal/distal pattern formation [19].
Moreover, we were able to show the potential of the COIN method in predicting the regulated targets of
HOTAIR lncRNA (Fig. 2). Our analysis indicated that HOTAIR was highly correlated with six regulated HOXC cluster genes (HOXC10, HOXC9, HOXC6 HOXC11, HOXC13, and HOXC4), and its top pathway functions were embryonic morphogenesis, embryo development, and skeletal system development. Our prediction could be further assessed by the experimental data that was previously reported in Rinn et al. [20].
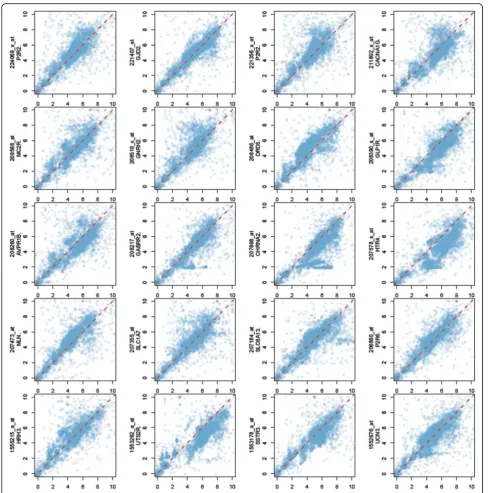
DSCR9 functions that predicted by COIN procedure Searching for the most related targets for an lncRNA transcribed from the DSCR on human chromosome 21, and predicting its biological functions with COIN process, we started by calculating the standard deviation of DSCR9 expression level in each dataset. Those with small standard deviation values (< 0.25) were neglected and only 258 sets of experimental data were used in our analysis. Based on Pearson correlation, top 20 DSCR9 co-expression probes were showed in Fig. 3.
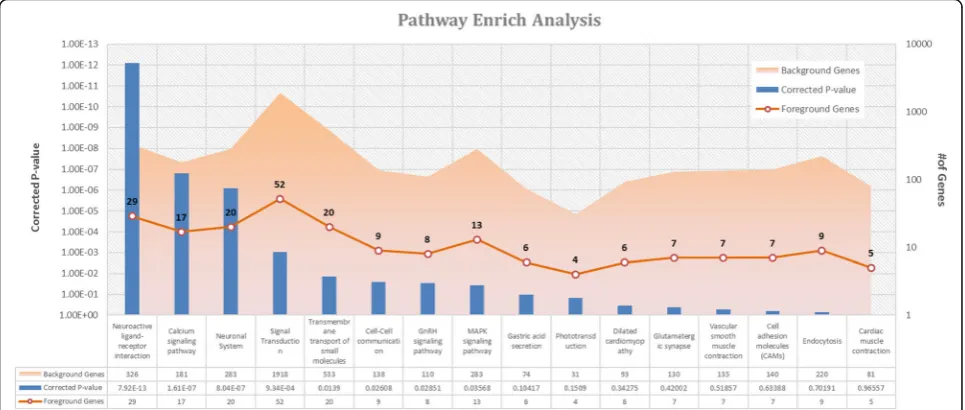
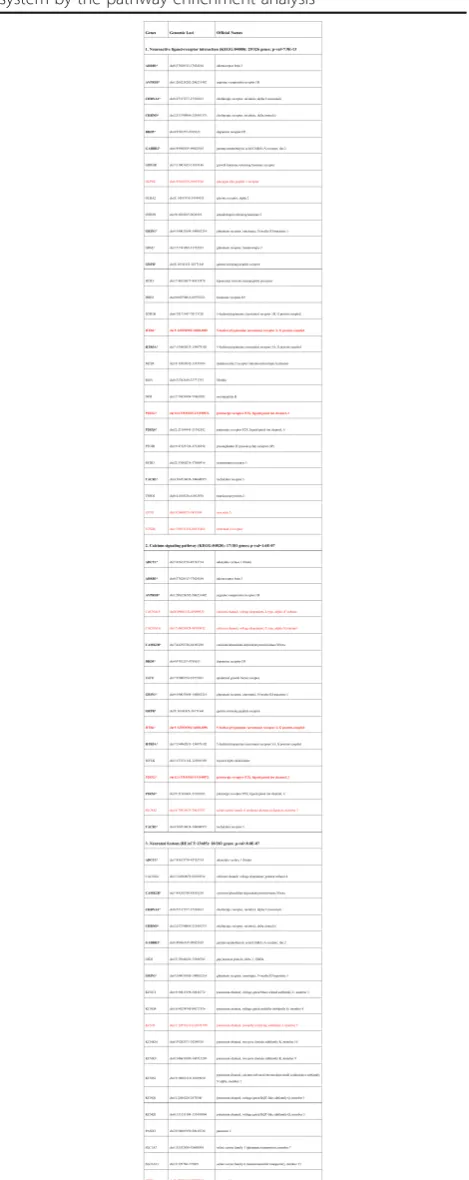
From the list of top 1000 co-expression genes of DSCR9, we conducted biological pathway analysis. There are four pathways that were significantly enriched with these co-expression genes (pvalue < 0.01). The most sig-nificant pathways were neuroactive ligand-receptor interaction, calcium signaling pathway, neuronal system, and signal transduction (Fig. 4). Genes that are related to the three most significantly enriched pathways were presented in Table 1.
Moreover, we performed PPI analysis to evaluate the interacting relations of these potential DSCR9 targets with Cytoscape (Fig. 5a). lncRNA DSCR9 exhibited strong interactions with those neuro-related genes
(nodes presented in the inner circle). For a further data-mining of this network, we calculated the interaction weight (numbers of neighbors) of each core node (Fig. 5b). Consistently, most of the core genes in the identified PPI network were neuro-related.
DSCR9 expression in human brain tissues
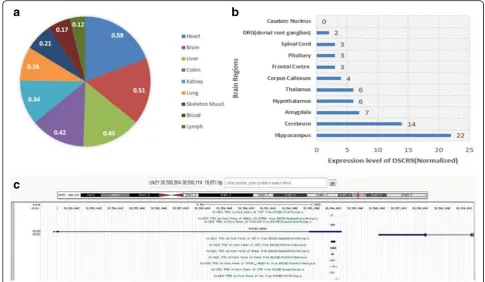
For in-depth examination on DSCR9 expression, we collected data from three international projects and per-formed integrative analysis of the transcription level of DSCR9. The expression of DSCR9 lncRNA was tissue-specific. Among nine different human tissues, DSCR9 dis-played the highest abundance in hearts and brains (Fig. 6a). The lncRNA levels were also analyzed in various re-gions of the human brain, and the highest DSCR9 RNA level was found in the hippocampus followed by those in the cerebrum, amygdala, etc. (Fig. 6b). Transcription fac-tor binding site (TFBS) data obtained from ENCODE project was analyzed. Four TFBSs in the third exon of DSCR9 and three transcription factors including USF1, USF2, and Rad21 might be involved in its expression regulation via these binding sites (Fig. 6c).
Genes that relate to DSCR9 co-expression oncology Using the COIN analysis, we found 14 genes that func-tioned in more than one neuro-related pathway, including EGFR (Table 1). EGFR was also abundantly detected in the brain by Nieto-Estevez et al. [21]. It was critical in neurological processes including cell death, the survival and differentiation of neurons. EGFR gene has been re-ported to be dysregulated in the mouse model of Down syndrome (DS), with regulatory impacts on calcium
Fig. 4Pathway enrichment analysis of top 1000 co-expression genes.Blue barsrepresented the enrichment significance levels of each pathway. Theorangeempty circle points represented the number of co-expression genes in the corresponding pathway. The area colored inlight orange represented the number of genes involved
signaling pathway, neuroactive ligand-receptor interaction, and the MAPK signaling pathway [22]. Our analysis results are concordant with the abovementioned reports.
Patients with DS exhibited considerably reduced incidence of most solid tumors [23, 24], and their overall cancer mortality rate was approximately 10% below the normal level of general population. Although the cause was still unclear, it had been proposed that the DS patients might get extra doses of one or multiple cancer-suppressor genes such as DSCR1 and DYRK1A due to the extra copy of chromosome 21 [25]. An extra copy of DSCR1 was sufficient to significantly suppress angiogen-esis and tumor growth and its protein, DSCR1, was upregulated in tissues from people with DS [25]. The attenuation of calcineurin activity by DSCR1 together with another chromosome 21 gene DYRK1A, might be sufficient to remarkably diminish angiogenesis. No direct evidence had been reported so far to illustrate that DSCR9 was responsible for cancer progressing. However, it seemed to be a reasonable hypothesis from our analysis.
The proposed COIN approach showed that SRC gene was the most outstanding target candidate in the regulatory network of DSCR9 (Fig. 5b). SRC gene was reported to en-code a proto-oncogene tyrosine-protein kinase. Activation of the Src pathway had been observed in about 50% of tu-mors from colon, liver, lung, breast, and the pancreas [26]. Another significant regulatory target of DSCR9 in the iden-tified network was EGFR, which was a well-studied onco-gene. It has been identified as an important drug target and understanding this gene has led to the development of mul-tiple anti-cancer therapeutics (known as‘EGFR inhibitors’) such as gefitinib, erlotinib, afatinib, brigatinib and icotinib for lung cancer, and cetuximab for colon cancer. Addition-ally, gastrin-releasing peptide receptor (GRPR) was also identified as an important target candidate of DSCR9, and diseases that associated with GRPR include lung cancer and prostate adenocarcinoma. In summary, the COIN ana-lysis results indicated that DSCR9 was highly correlated with several oncogenes and therefore it was very likely that its regulatory function could be employed to explain the reduced cancer incidence in patients with DS.
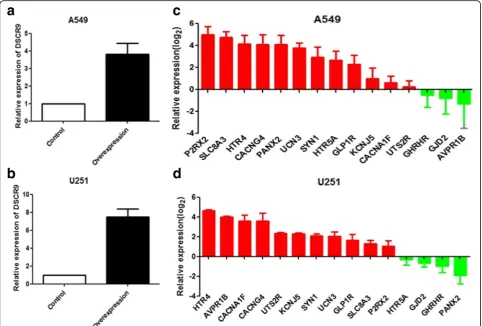
DSCR9 co-expression genes that validated in cell lines To further examine the predictive capability of the COIN model, a standard gene expression analysis was performed in two DSCR9 over-expressed cell lines. After the con-struction and validation of DSCR9-overexpression in A549 and U251 cells (Fig. 7a–b), we selected 15 top DSCR9-associated genes in our prediction and determined their expression levels by qPCR. We found that 12 of these 15 predicted co-expressed genes were unregulated upon DSCR9 over-expression in A549 cells, and 11 of them were upregulated in U251 (Fig. 7c–d). In conclusion, our experimental data showed high consistency (> 73%)
Table 1DSCR9 co-expressed genes were related to nervous system by the pathway enrichment analysis
with the bioinformatics analysis predictions, supporting the reliability of the proposed COIN method.
Discussion
Although the dysregulation of some lncRNAs had been linked to human diseases, the underlying molecular mecha-nisms, including the regulatory function of many lncRNAs have not been fully elucidated. An effective approach is in need to provide a feasible guidance for functional studies of these non-coding RNAs. COIN method aimed for the prediction of targeted lncRNA function and its regulatory network. We validated the COIN approach by predicting the interaction networks of two well-known lncRNAs: HOTAIR and HOTTIP. Moreover, reliability of its predic-tions was also confirmed by a quantitative PCR in two inde-pendent DSCR9 over-expression cell lines.
Potential neurological pathway genes that relate DSCR9 to DS
DS is a neurobehavioral specificity disease [27]. Three pathways that are significantly enriched with DSCR9
co-expression genes associated with neurological functions, with top 10 qPCR validation genes in parentheses (see Fig. 4 and Table 1):
In the COIN analysis, we found 14 genes that func-tioned in more than one neuro-related pathway, includ-ing HTR4, P2RX2, and ADCY1 (Table 1). ADCY1 was found to encode a form of adenylate cyclase that is expressed in the brain and was involved in regulatory processes in the central nervous system. Previous studies indicated that it might play significant roles in memory acquisition and learning. Overall, combining the COIN analysis results and literature reports, we believe that the three pathways in which the DSCR9 co-expression genes were enriched are essential for the nervous system de-velopment. HTR4 is another gene induced by DSCR9 over-expression. HTR4 is a glycosylated transmembrane protein that functions in both the peripheral and central nervous system to modulate the release of various neu-rotransmitters. Previous studies indicated that HTR4 might be associated with neurological diseases such as Parkinson’s disease 5 [28, 29]. The product of P2RX2 gene belongs to the family of purinoceptors for ATP.
Fig. 5Protein–protein interaction (PPI) network of DSCR9 co-expression genes.aDSCR9 Network structure visualized with Cytoscape. Each node represented one gene. Nodes with red border represented co-expressed genes involved in neuroactive ligand-receptor interaction pathway. Nodes filled with light yellow color represented co-expressed genes functioned in calcium signaling pathway, while nodes shaped in hexagonal represent co-expressed genes related to neuronal system. Orange lines show PPI between those highly correlated co-expressed genes of DSCR9. Red lines represented potential relationships between DSCR9 and its targets.bThe core DSCR targeted genes in the PPI network were listed with their gene symbols and weights. Numbers in the bars showed the interaction weight of the corresponding genes in DSCR9 network (Fig. 4a). Orange-colored bars indicated that the corresponding genes were members of the neuro-related pathways
This receptor functions as a ligand-gated ion channel. Binding to ATP mediates synaptic transmission between neurons and from neurons to smooth muscle [28, 29].
Components of the neuro-active ligand-receptor inter-action pathway showed high relevance to DS acute lymphoblastic leukemia [30]. Furthermore, it had been well studied that calcium ions generated versatile intra-cellular signals, supporting that calcium signaling path-way also played an important role in all types of neurons [31]. Impaired calcineurin activity was already linked to many human diseases including DS, Alzheimer’s disease, brain ischemia, cardiac hypertrophy, and maybe more [32]. Interestingly, DSCR1 gene was upregulated in DS patients and encoded a protein that suppressed VEGF-mediated angiogenic signaling by the calcineurin path-way [25]. Previous report also suggested that presynaptic calcium channels might serve as the regulatory node in a dynamic, multilayered signaling network that exerted short-term control of neurotransmission in response to synaptic activity [33]. A transient rise of the calcium level in dendritic spines was essential for the induction of activity-dependent synaptic plasticity.
In addition, our experimental data supported the pre-dicted DSCR9 regulation of its target genes in two differ-ent cancer cell lines, i.e., A549 and U251. Over 73% of
our predicted DSCR9 target genes were upregulated when DSCR9 was over-expressed. Consistent with our gene ontology (GO) analysis, two of the unregulated genes, say, CACNG4 [34] and CACNA1F [35], encoded the subunits of calcium channels, which were involved in the calcium signaling pathway.
According to the co-expressed genes of DSCR9 in the resulting network, we predicted that DSCR9 might also contribute to the cardiovascular- and cerebral-related diseases. Consistently, data from NHPRTR pro-ject indicated that the highest expression levels of this lncRNA were detected in heart and brain (Fig. 6a). Moreover, compared to other regions of the brain, the abundance of DSCR9 seemed to accumulate in hippo-campus (Fig. 6b). This supported our prediction that this lncRNA might be a factor leading to abnormal dendritic branching and spine number, and further reduction of brain volume as it had been previously reported that a reduction in brain volume in patients with DS was attributed to impaired dendritic and synaptic maturation [36]. Dendritic branching and spine number were dramatically reduced in pyramidal neurons in the hippocampus, visual cortex, and motor cortex after 4 months postnatal age in individuals with DS [28, 29].
Fig. 6Expression and regulation of DSCR9 in human tissues and brain regions.aDSCR9 expression levels (shown by FPKM levels, fragment per kilometer) in a series of human tissues (data obtained from NHPRTR project).bDSCR9 expression levels in different brain regions (data obtained from molecularbrain.org).cDSCR9 with four transcription-factor-binding-sites (TFBS) in the third DSCR9 exon displayed with UCSC
Potential transcription factors that relate DSCR9 to DS In the COIN analysis of DSCR9, we identified three tran-scription factors including Rad21, USF1, and USF2 that were highly correlated with DSCR9 (Fig. 6c), and we further noticed that putative binding sites of these tran-scription factors were present in the third exon of DSCR9. Intriguingly, these transcription factors had been shown to be related to DS. Rad21 gene was found to be highly mu-tated in DS [37], and its expression level was elevated in DS patients [38]. Similarly, USF1 expression level was positively related with dCK gene [39], which was a well-documented DS leukemia-related gene [40]. Moreover, previous reports suggested that USF1 played a trans-activating role on the CBS-1b promoter [41], and CBS-1b gene had been accepted as a DS risk factor [42, 43]. The third transcription factor that is related to DSCR9 was USF2, whose expression was shown to be increasing during aging [44]. Interestingly, DS patients exhibited an increased risk of many chronic diseases, which were typic-ally associated with aging. Previous reports suggested that trisomy 21 was linked to clinical manifestations of acceler-ated aging, and DSCR9 appeared to be a negative epigen-etic clock controlling tissue aging in the brain [45].
Supporting its potential activities and expression regula-tion in DS, it was also found that DSCR9 displayed abnor-mal methylation pattern in DS patients [46], and the methylated sites were mainly located in the third exon [47]. All together, these results implicated a DS-related transcription regulation of DSCR9 lncRNA, which may in-volve altered DNA methylation patterns and/or chromatin structure as well as the transcription factors USF1/USF2/ Rad21 binding to the exon 3 of DSCR9.
Conclusions
In conclusions, our studies established a solid bioinformat-ics pipeline for functional predictions of DS transcriptome associations. Our qPCR assay showed that the expression of these genes were induced by DSCR9, implying that these genes might be regulated by DSCR9. The results provided a valuable guidance for further investigations on the regu-latory mechanism of DSCR9 as well as its relevance to DS and other neurological diseases. Dysregulation of DSCR9 and/or its target genes in these pathways might be respon-sible for the pathogenesis and progressing of DS. As exten-sion of this work, generalized approach can be adapted for other disease-related transcriptome association studies.
Fig. 7Bioinformatics predictions were validated by QPCR.aThe DSCR9 stable overexpression A549 and U251 cell lines were constructed.bQPCR analysis showing the predicted co-expressed genes were upregulated in both A549 and U251 upon DSCR9 overexpression
Additional file
Additional file 1: Table S1. Primers used in this study. (DOCX 15 kb)
Abbreviations
COIN:Correlation-interaction-network; DS: Down syndrome; DSCR: Down syndrome critical region; lncRNA: Long non-coding RNA; PPI: Protein–protein interaction
Acknowledgements
We thank Mr. Mark Deiparine for technical supports and writing assistance.
Funding
The study was supported by the Guangzhou Science and Technology Program (No. 2014234), the Guangdong Science and Technology Program (No. 2013B022000005), and the National Natural Science Foundation of China (No. 81671470). This work was partly supported by Youth Scientific Project Foundation of Guangzhou Medical University (2015A21) and Guangdong Natural Science Foundation (2015A030313474).
Availability of data and materials
The dataset supporting the conclusions of this article is included within the article and in its supplementary information files.
Author’s contributions
MC, AC, and DC conceived and designed the experiments. KH, YJL, and AC analyzed the data. XS, YHL, and JL performed the molecular experiments. MC, YJL, XS, KH, and AC wrote the paper. JYW, ZFL, SYX, and HMG edited the paper and figures. All authors read and approved the final manuscript.
Ethics approval and consent to participate
Not applicable.
Competing interests
The authors declare that they have no competing interests.
Author details 1
Department of Fetal Medicine and Prenatal Diagnosis, the Third Affiliated Hospital of Guangzhou Medical University, Guangzhou 510150, China.
2
Obstetrics and Gynecology Institute of Guangzhou, Guangzhou 510150, China.3The Medical Centre for Critical Pregnant Women in Guangzhou,
Guangzhou 510150, China.4Key Laboratory for Major Obstetric Diseases of Guangdong Province, Guangzhou 510150, China.5Key Laboratory for
Reproduction and Genetics of Guangdong Higher Education Institutes, Guangzhou, China.6Department of Mathematics, University of California,
Berkeley, CA 94720, USA.7Mendel Genes Inc, Manhattan Beach, CA, Manhattan Beach, CA 90266, USA.8Department of Thoracic Surgery, Nanfang
Hospital, Southern Medical University, Guangzhou, China.9State Key Laboratory of Respiratory Disease, The First Affiliated Hospital of Guangzhou Medical University, National Clinical Research Center for Respiratory Disease, Guangzhou, China.
Received: 18 November 2017 Accepted: 5 January 2018
References
1. Megarbane A, et al. The 50th anniversary of the discovery of trisomy 21: the past, present, and future of research and treatment of Down syndrome. Genet Med. 2009;11(9):611–6.
2. Luke S, Gandhi S, Verma RS. Conservation of the Down syndrome critical region in humans and great apes. Gene. 1995;161(2):283–5.
3. Wang ET, et al. Alternative isoform regulation in human tissue transcriptomes. Nature. 2008;456(7221):470–6.
4. Clark MB, Mattick JS. Long noncoding RNAs in cell biology. Semin Cell Dev Biol. 2011;22(4):366–76.
5. Gutschner T, Diederichs S. The hallmarks of cancer: a long non-coding RNA point of view. RNA Biol. 2012;9(6):703–19.
6. Fenoglio C, et al. An emerging role for long non-coding RNA dysregulation in neurological disorders. Int J Mol Sci. 2013;14(10):20427–42.
7. Willingham AT, et al. A strategy for probing the function of noncoding RNAs finds a repressor of NFAT. Science. 2005;309(5740):1570–3. 8. Pawel Foszner AG, Polanski A, Marczyk M, Jaksik R, Polanska J. Efficient
algorithm for microarray probes re-annotation. Lect Notes Comput Sci. 2011;6923:281–9.
9. Rustici G, et al. ArrayExpress update—trends in database growth and links to data analysis tools. Nucleic Acids Res. 2013;41(Database issue):D987–90. 10. Gentleman RC, et al. Bioconductor: open software development for
computational biology and bioinformatics. Genome Biol. 2004;5(10):R80. 11. Lindgren D, et al. Integrated genomic and gene expression profiling
identifies two major genomic circuits in urothelial carcinoma. PLoS One. 2012;7(6):e38863.
12. Dabney A, Storey JD. W. G. R. qvalue: Q-value estimation for false discovery rate control. R Package Version, 2011. https://doi.org/10.18129/B9.bioc.qvalue. 13. Mathivanan S, et al. An evaluation of human protein-protein interaction
data in the public domain. BMC Bioinformatics. 2006;7(Suppl 5):S19. 14. Shannon P, et al. Cytoscape: a software environment for integrated models
of biomolecular interaction networks. Genome Res. 2003;13(11):2498–504. 15. Kanehisa M, et al. KEGG for integration and interpretation of large-scale
molecular data sets. Nucleic Acids Res. 2012;40(Database issue):D109–14. 16. Croft D, et al. The reactome pathway knowledgebase. Nucleic Acids Res.
2014;42(Database issue):D472–7.
17. CE B. Teoria statistica delle classi e calcolo delle probabilit. Pubblicazioni del R Istituto Superiore di Scienze Economiche e Commerciali di Firenze. 1936;8:3–62. 18. Peng X, et al. Tissue-specific transcriptome sequencing analysis expands the
non-human primate reference transcriptome resource (NHPRTR). Nucleic Acids Res. 2015;43(Database issue):D737–42.
19. Wang KC, et al. A long noncoding RNA maintains active chromatin to coordinate homeotic gene expression. Nature. 2011;472(7341):120–4. 20. Rinn JL, et al. Functional demarcation of active and silent chromatin
domains in human HOX loci by noncoding RNAs. Cell. 2007;129(7):1311–23. 21. Nieto-Estevez V, et al. A global transcriptome analysis reveals molecular
hallmarks of neural stem cell death, survival, and differentiation in response to partial FGF-2 and EGF deprivation. PLoS One. 2013;8(1):e53594. 22. Ling KH, et al. Functional transcriptome analysis of the postnatal brain of
the Ts1Cje mouse model for Down syndrome reveals global disruption of interferon-related molecular networks. BMC Genomics. 2014;15:624. 23. Satge D, et al. A lack of neuroblastoma in Down syndrome: a study from 11
European countries. Cancer Res. 1998;58(3):448–52.
24. Patja K, et al. Cancer incidence of persons with Down syndrome in Finland: a population-based study. Int J Cancer. 2006;118(7):1769–72.
25. Baek KH, et al. Down’s syndrome suppression of tumour growth and the role of the calcineurin inhibitor DSCR1. Nature. 2009;459(7250):1126–30. 26. Dehm SM, Bonham K. SRC gene expression in human cancer: the role of
transcriptional activation. Biochem Cell Biol. 2004;82(2):263–74. 27. Jean-Adolphe Rondal P, Perera J. Down syndrome: neurobehavioural
specificity. Down syndrome: Neurobehavioural specificity. 2006;
28. Marin-Padilla M. Pyramidal cell abnormalities in the motor cortex of a child with Down’s syndrome. A Golgi study. J Comp Neurol. 1976;167(1):63–81. 29. Takashima S, et al. Abnormal neuronal development in the visual cortex of
the human fetus and infant with Down’s syndrome. A quantitative and qualitative Golgi study. Brain Res. 1981;225(1):1–21.
30. Loudin MG, Wang J, Leung HC, Gurusiddappa S, Meyer J, Condos G, et al. Genomic profiling in Down syndrome acute lymphoblastic leukemia identifies histone gene deletions associated with altered methylation profiles. Leukemia. 2011;25(10):1555–63.
31. Grienberger C, Konnerth A. Imaging calcium in neurons. Neuron. 2012;73(5): 862–85.
32. Bindu LH, Rani PU, Reddy PP. Calcineurin activity in children with mental handicap. Indian J Clin Biochem. 2007;22(2):32–5.
33. Catterall WA, Few AP. Calcium channel regulation and presynaptic plasticity. Neuron. 2008;59(6):882–901.
34. Burgess DL, et al. Identification of three novel ca(2+) channel gamma subunit genes reveals molecular diversification by tandem and chromosome duplication. Genome Res. 1999;9(12):1204–13.
35. Jalkanen R, et al. A novel CACNA1F gene mutation causes Aland Island eye disease. Invest Ophthalmol Vis Sci. 2007;48(6):2498–502.
36. Becker LE, Armstrong DL, Chan F. Dendritic atrophy in children with Down’s syndrome. Ann Neurol. 1986;20(4):520–6.
38. Engidawork E, et al. Aberrant protein expression in cerebral cortex of fetus with Down syndrome. Neuroscience. 2003;122(1):145–54.
39. Ge Y, et al. Role of USF1 in the differential expression of the human deoxycytidine kinase gene in acute myeloid leukemia. Leukemia. 2005;19(4):677–9.
40. Taub JW, et al. Cystathionine-beta-synthase cDNA transfection alters the sensitivity and metabolism of 1-beta-D-arabinofuranosylcytosine in CCRF-CEM leukemia cells in vitro and in vivo: a model of leukemia in Down syndrome. Cancer Res. 2000;60(22):6421–6.
41. Ge Y, Jensen TL, Matherly LH, Taub JW, et al. Synergistic regulation of human cystathionine-beta-synthase-1b promoter by transcription factors NF-YA isoforms and Sp1. Biochim Biophys Acta. 2002;1579(2–3):73–80. 42. Fintelman-Rodrigues N, et al. Investigation of CBS, MTR, RFC-1 and TC polymorphisms as maternal risk factors for Down syndrome. Dis Markers. 2009;26(4):155–61.
43. Wang SS, et al. Polymorphisms in genes RFC-1/CBS as maternal risk factors for Down syndrome in China. Arch Gynecol Obstet. 2013;288(2):273–7. 44. Singh K, Prasad S. Differential expression of Fmr-1 mRNA and FMRP in
female mice brain during aging. Mol Biol Rep. 2008;35(4):677–84. 45. Horvath S, et al. Accelerated epigenetic aging in Down syndrome. Aging
Cell. 2015;14(3):491–5.
46. Zhang Y, et al. DNA methylation analysis of chromosome 21 gene promoters at single base pair and single allele resolution. PLoS Genet. 2009; 5(3):e1000438.
47. Yegnasubramanian S, et al. Chromosome-wide mapping of DNA methylation patterns in normal and malignant prostate cells reveals pervasive methylation of gene-associated and conserved intergenic sequences. BMC Genomics. 2011;12:313.
• We accept pre-submission inquiries
• Our selector tool helps you to find the most relevant journal
• We provide round the clock customer support
• Convenient online submission
• Thorough peer review
• Inclusion in PubMed and all major indexing services
• Maximum visibility for your research
Submit your manuscript at www.biomedcentral.com/submit