REVI E W
Open Access
Pearls and pitfalls of optical coherence
tomography angiography in the
multimodal evaluation of uveitis
Francesco Pichi
1,2*, David Sarraf
3,4, Mariachiara Morara
5, Shahana Mazumdar
6, Piergiorgio Neri
7and Vishali Gupta
8Abstract
Background:Optical coherence tomography angiography (OCTA) employs a novel imaging algorithm that detects
the amplitude or phase decorrelation of blood cell movement. It thus provides a flow map with depth-resolved visualization of the various vascular layers in the posterior pole of the eye including the retina capillary plexus and the choroid.
In the past 3 years, the number of research papers on the subject of OCTA in retinal diseases has grown exponentially including important applications in the field of uveitis. While the study of OCTA in uveitic diseases has gained remarkable relevance worldwide, interpretation can be challenging, and many limitations exist in optimally using this advanced system in uveitic eyes.
The aim of this review is to describe the many significant applications of OCTA in uveitis disorders and to outline the various limitations that can confound interpretation and support uveitis specialists in the integration of OCTA in the multimodal imaging approach to inflammatory diseases.
Main body:Unlike conventional angiography that can dynamically detect inflammation and leakage of dye from
retinal vessels, OCTA provides other important biomarkers of inflammation. Detailed microvascular reconstruction of normal and abnormal blood vessels and quantitative evaluation are advantages of OCTA analysis. OCTA can therefore non-invasively detect choroidal neovascularization that may complicate inflammatory disorders, and with remarkable depth-resolved capability, OCTA can identify and quantitate flow loss as a manifestation of ischemia and/or inflammation.
The areas of flow deficit on OCTA at the level of the inner choroid often co-localize with hypofluorescent lesions with indocyanine green angiography. These regions of presumed choriocapillaris ischemia may occur in placoid disorders. Space-occupying granulomas may occur in disorders such as sarcoid and may or may not co-localize with choriocapillaris ischemia on ICG angiography. Blocking or shadowing artifacts should be excluded when evaluating inner choroidal abnormalities with OCT angiography.
Fundus autofluorescence may assess the metabolic function of the retinal pigment epithelium (RPE) and the viability of the overlying photoreceptors and thus the activity of inflammation associated with uveitic lesions. The photoreceptors are physiologically maintained by the diffusion of oxygen from the choriocapillaris below and, to a lesser extent, from the deep retinal capillary plexus above. The depth-resolved capability of OCTA may therefore provide additional significant microvascular information about these vascular layers that may be driving the development of hyper-autofluorescent RPE inflammation and photoreceptor loss.
(Continued on next page)
* Correspondence:ilmiticopicchio@gmail.com 1
Eye Institute, Cleveland Clinic Abu Dhabi, Al Maryah Island, PO Box 112412, Abu Dhabi, United Arab Emirates
2Cleveland Clinic Lerner College of Medicine, Case Western Reserve
University, Cleveland, USA
Full list of author information is available at the end of the article
(Continued from previous page)
Conclusions: The implementation of OCTA in the evaluation and management of uveitis disorders is being
spurred by our greater knowledge and understanding of its application. In order to take full advantage of this exciting new imaging modality, however, uveitis specialists must understand the limitations of interpretation and potential artifact-related pitfalls in assessment and should continue to support evaluation with multimodal imaging to best optimize diagnoses and treatment of inflammatory diseases.
Keywords: Optical coherence tomography angiography, Uveitis, Fluorescein angiography, Indocyanine green
angiography
Review
The evolution of optical coherence tomography (OCT) over the last two decades has been remarkable for a sustained improvement in the resolution and sensitivity of image detection. OCT has also provided the platform for the development of other significant imaging advancements including optical coherence tomography angiography (OCTA) [1]. This is an in-novative technique that employs amplitude or phase decorrelation to detect blood flow without the need for intravenous dye administration [2]. The past 3 years have witnessed an explosion in the application of this imaging method in neovascular diseases, and recently, more and more studies are being published on the subject of OCTA in uveitis [3]. OCTA may provide an important tool in the evaluation of inflam-matory eye diseases as vascular changes in the iris, choroid, and retina play an important role in the pathophysiology of ocular inflammation.
Vascular abnormalities in uveitis may be caused by various pathological processes including vascular occlu-sion, local ischemia, and alteration of cell mediators. OCTA can be used to accurately detect vascular flow changes and neovascularization and may provide object-ive, qualitatobject-ive, or quantitative inflammatory biomarkers. In addition, OCTA image acquisition is fast and easy and non-invasive, limiting the risk of adverse events for the patient. Depth-resolved capability provides import-ant evaluation of the deep retinal capillary plexus that may be selectively targeted in retinal vascular or inflam-matory disease. However, the importance of a multi-modal approach is recommended because of the significance of dye leakage from inflamed vessels which can provide an additional important marker of inflam-mation [4, 5].
The purpose of this review is to summarize the current applications of OCTA in the evaluation and management of uveitic retinal and choroidal disorders, with emphasis on a multimodal approach to include wide-field dye-based angiography to evaluate inflamma-tory disorders such as retinal vasculitis, and indocyanine angiography (ICGA) to evaluate choroidal ischemia in eyes with placoid variant disorders.
Fluorescein angiography versus optical coherence tomography angiography
During the procedure of fluorescein angiography (FA), fluorescein sodium, a natural dye substance, is injected intravenously in order to analyze the retinal vascular cir-culation in the posterior pole and periphery [6]. Fluores-cein is a small hydrosoluble molecule of 354 Da of which 80% is bound to proteins and 20% is free. The emission fluorescence is captured with a filter set at 520–530 nm within the wavelengths of visible light. The retinal vessels do not normally leak dye and are there-fore well visualized with FA. However, the inner choroid is poorly resolved due to widespread leakage from the fenestrated choriocapillaris which obstructs the larger deeper choroidal vessels and which obstructs the details of the choriocapillaris, although the lobular morphology can be identified during the early phases of the angiogram.
Fluorescein has micromolecular properties and may easily leak with the slightest disruption of the blood-retinal barrier. Retinal vessels are highly impermeable due to the tight junctions between endothelial cells and do not normally leak. However, even mild inflam-mation of the retinal vessel wall may result in retinal vascular leakage [7], and therefore, FA is a very sensi-tive way to detect retinal vessel inflammation. Vascular leakage on FA can be essential in assessing inflammatory activity.
or irregularity of the foveal avascular zone and capillary microvascular remodeling but normal flow in the pres-ence of exudates. The highly significant differpres-ences in capillary density and morphology that was detected in these two vasculitis studies illustrate that the effects of intraocular inflammation can be quantitatively measured within a 3 × 3 mm parafoveal window using OCTA.
The importance of depth-resolved capability with OCTA to assess the deep vascular complex cannot be underestimated. Conventional dye-based angiography poorly visualizes the deeper capillary layers. Recent studies have identified more significant capillary flow deficit in the deep retinal capillary plexus using OCTA in diseases such as birdshot chorioretinopathy. Assessing the flow density of the deep vascular com-plex may provide more complete information regard-ing the deleterious effects of inflammation and may provide an additional biomarker of inflammatory ac-tivity that may be quantified to assess progression and response to therapy.
This reduction in retinal capillary flow does not neces-sarily mean vascular obliteration or non-perfusion. Leak-age of plasma outside the inflamed wall may lead to a
decrease in the flow velocity inside the retinal vessel. In fact, OCTA may not detect retinal capillary flow outside the range of 0.3 mm/s to 2 mm/s. Thus, in active vascu-litis with FA leakage, there may be a global slowdown of the retinal circulation that may be identified with OCTA. Future studies are necessary to demonstrate a correl-ation between fluorescein leakage and the decrease in the capillary flow on OCTA.
Leakage of dye in posterior uveitis can limit our ability to evaluate adjacent capillary perfusion and can be present due to damaged or ischemic capillary beds. In this case, the inability of OCTA to detect leakage is an advantage and can provide microvascular morphological detail and information regarding capillary perfusion, with quantitative capability, in both the superficial and deep capillary plexus. In patients with reperfusion of a prior branch retinal artery occlusion, for example, capil-lary dropout is more easily identified with OCTA com-pared to FA and, in some cases, not even visible with FA. As such, the absence of vascular leakage with OCTA can be advantageous as hyperfluorescence due to vascu-lar leakage, or window defects may impede the detection of capillary perfusion.
FA is currently the gold standard for identifying in-flammatory CNV [10]. In various uveitic choroidal disorders such as multifocal choroiditis (MFC) or punctate inner choroidopathy (PIC), the major cause of vision loss may be related to direct inflammatory damage of the retina and RPE [11], and secondary in-vasion of inflammatory CNV [12]. Making the distinc-tion between inflammatory versus neovascular lesions is mandatory to optimize therapy. Both illustrate ele-vation of the RPE by homogeneous hyper-reflective material with SD-OCT analysis [3, 13]. When avascu-lar, these inflammatory lesions may appear small and conical [3]. It is unclear exactly what comprises the sub-RPE material. Histopathologic studies [14] of these inflammatory lesions are sparse but have re-ported the presence of choroidal infiltrates with B-cell lymphocytes. In the case of inflammatory lesions, the disruption of the choroid [14] occurs because of cyto-kines and the physical dehiscence in the RPE. More heterogenous subretinal material, wider in diameter [15], may indicate the presence of CNV that can rup-ture through the RPE and lead to exudation in the subretinal space.
Inflammation and CNV are not mutually exclusive and may both be present in certain lesions. Even with multi-modal imaging, the differentiation between active in-flammatory lesions and inin-flammatory CNV may not be possible because both have the potential to cause infil-tration and exudation with breakdown in the blood– ret-ina barrier.
FA is currently the gold standard for identifying CNV [16]. The typical presentation of inflammatory CNV on FA is early hyperfluorescence with late leakage [10], while inflammation displays early hypofluorescence or isofluorescence with late hyperfluoresence [10]. How-ever, CNV may not always illustrate obvious early hyper-fluorescence due to blockage from the inflammatory component, fluid, or hemorrhage. Furthermore, inflam-matory lesions may display early hyperfluorescence be-cause of RPE damage causing a window defect.
It is therefore challenging to distinguish inflammatory CNV from purely inflammatory lesions by FA. OCTA, however, has improved the sensitivity and specificity of CNV detection in inflammatory choroidal disorders. The microvascular morphological detail may be more precisely detected with OCTA, and the area and the density of the inflammatory CNV can be quantitatively measured. OCTA has shown remarkable accuracy in distinguishing inflammatory CNV (Fig. 2) from avascular inflammatory lesions that were poorly identified using other imaging modalities [3, 17]. However, OCTA cannot reliably deter-mine which lesions are clinically active [12].
Indocyanine green angiography and optical coherence tomography angiography
Indocyanine green (ICG) fluoresces at 830 nm, and therefore, ICG angiography (ICGA) provides better visualization of the choroidal vascular structures through the retinal pigment epithelium [18]. ICG is nearly com-pletely albumin protein bound, and as such, imaging of the deeper choroidal vessels is not obstructed by signifi-cant choriocapillaris leakage as with FA [19]. In the ret-ina, only major damage to retinal vessels will result in ICG leakage. In the choroid, however, ICG may leak very slowly from the fenestrated choriocapillaris. During re-circulation, more and more ICG is entrapped in the choroidal tissue as the ICG-protein complex is only slowly reabsorbed into the circulation. Gradual staining of the choroid occurs with time, causing intermediate and late choroidal background fluorescence [20].
ICG hyperfluorescence is believed to result from two mechanisms [18] in inflammatory disorders of the fun-dus, and therefore, choroiditis has been divided into two broad categories, choriocapillaritis versus stromal chor-oiditis [20]. Inflammatory choriocapillaritis may lead to non-perfusion, identified early with dye-based angiog-raphy, and irregular areas of hypofluorescent staining. This ICG pattern is best displayed in placoid disorders including acute posterior multifocal placoid pigment
epitheliopathy (APMPPE) and serpiginous choroiditis (SC).
Controversy has persisted regarding the pathogenesis of APMPPE since its initial description by Gass [21], who chose the term “pigment epitheliopathy” to reflect the most significant clinical tissue involvement. How-ever, the advent of ICGA in the 1990s has provided add-itional insights into APMPPE and has supported choroidal involvement as a prominent feature [22]. Still, several features of APMPPE remained atypical for a choroiditis including the rapid resolution of lesions and the near absence of damage to the choroid despite sig-nificant permanent alternations in the RPE. Klufas et al. [23] have recently studied OCTA technology to assess the choroid in the eyes with various placoid disorders in-cluding APMPPE. In their series, 96% of the APMPPE eyes illustrated evidence of inner choroidal or chorioca-pillaris flow reduction or ischemia on analysis of seg-mented OCTA scans that correlated with onset of visual symptoms. The zone of choriocapillaris ischemia as
identified with OCTA (Fig. 3) was the same or greater than the area of hypofluoresence on ICGA. OCTA has therefore confirmed that ICGA hypofluorescence in APMPPE is indeed the result of reduced inner choroidal or choriocapillaris flow rather than blockage from over-lying RPE changes, and may provide a non-invasive bio-marker of choroidal inflammatory ischemic activity and response to therapy.
Other placid disorders include serpiginous choroiditis and serpiginous-like choroiditis, two distinct forms of choroiditis also believed to result from the inflammation of the choriocapillaris/inner choroid and the RPE [24]. During the active stage of these two diseases, OCTA of the choriocapillaris illustrates clearly demarcated areas of flow deficit that precisely co-localize with the hypo-fluorescent ICG lesions [25]. Point-to-point registration between the hypofluorescent areas on ICGA to the areas of flow-void demonstrated on OCTA can be precisely identified [25]. Additionally, intervening areas of pre-served choriocapillaris [25, 26] and medium-sized
choroidal vessels are identified between the active le-sions. As the lesions heal, deeper medium-to-large chor-oidal vessels become more prominent and are better delineated on OCTA than on ICG.
The second main mechanism causing hypofluores-cence with ICGA is the presence of inflammatory foci in the choroid [20] that can occupy space and block diffu-sion of the ICG molecule to these areas that appear dark against the physiologically fluorescent background of the choroidal stroma. These hypofluorescent lesions are round and evenly distributed in the choroidal stroma of inflammatory disorders such as Vogt-Koyanagi-Harada (VKH) and birdshot chorioretinopathy [27].
Early birdshot lesions are inflammatory choroidal infil-trates that consist of epithelioid cells [28] and that sur-round the choroidal stromal melanocytes. With ICGA, these lesions are hypofluorescent and line up along the larger choroidal vessels [27]. The active outer choroidal lesions are partial thickness and do not affect the adja-cent choriocapillaris early in the course of disease and therefore cannot be initially visualized on OCTA analysis [3, 29]. Once these lesions depigment, the granulomas resolve with atrophy of the choriocapillaris and inner stroma [28]. The advanced birdshot lesions that are depigmented and atrophic with fundus photography co-localize with areas of flow reduction with OCTA due to the absence of choriocapillaris flow beneath the dis-rupted RPE.
Histopathologic studies have shown that while VKH disease primarily affects the choroidal stroma with dif-fuse infiltration of inflammatory cells, the choriocapil-laris may also be involved, especially in recurrent cases, resulting in localized ischemic abnormalities [30]. The inflammation primarily involves the choroidal stroma with subsequent involvement of the RPE and outer ret-ina. On OCTA [3], the choriocapillaris layer (below the RPE-Bruch’s membrane complex) illustrates multiple dark foci (Fig. 4) with loss of the choriocapillaris (or se-vere hypoperfusion) that appear as areas of flow void [31]. The edges of these areas are discrete and clearly de-marcated. In comparing OCTA with ICGA, the areas of flow void on OCTA illustrate consistent co-localization with the persistent hypocyanescent spots on ICGA [31].
In secondary stromal choroiditis, such as sarcoidosis and TB, the hypocyanescent lesions are distributed more irregularly [18]. Small sarcoid granulomas tend to be lo-calized to the inner choroidal stroma (since leukocyte diapedesis starts in Sattler’s layer where blood vessels have thinner walls [32]) and demonstrate punctate hypo-fluorescence with ICGA. Since their diameter approxi-mately corresponds to the size of the choriocapillaris lobules and the inflammatory cells initially expand by in-filtrating the loose connective tissue between the vascu-lar structures [33], small granulomas are not identified
with OCTA (Fig. 5) [3]. As the granulomas grow, they extend in the loose choroidal connective tissue and shift and may compress the surrounding vasculature [34]. Larger, full-thickness choroidal granulomas can be visualized on OCT angiography (Fig. 5) as areas of choriocapillaris non-flow that co-localize with the ICG hypofluorescent lesions [3].
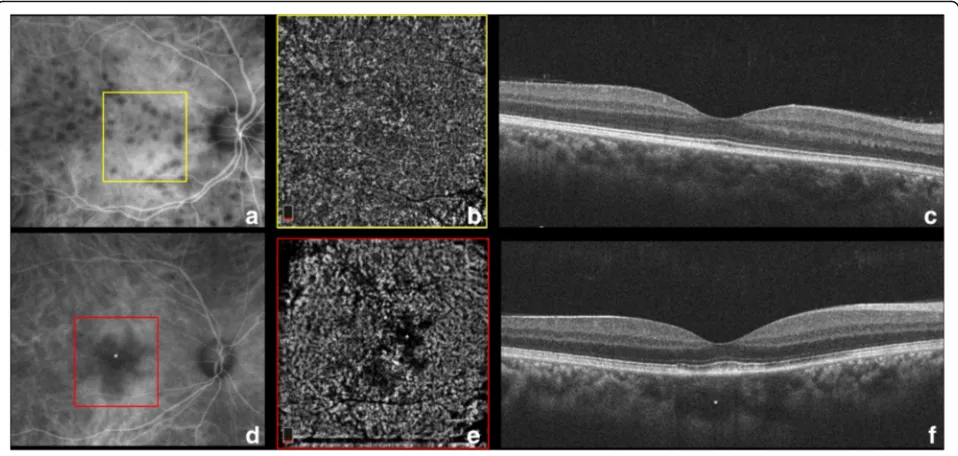
A third, less-known mechanism of hypofluorescence in uveitis has been described by Chang et al. [35] who studied the ICG absorption characteristics of the RPE and noted that the RPE normally absorbs ICG leading to the physiological background hyperfluorescence nor-mally seen with ICGA. ICG uptake, however, may be disrupted in certain retinal disorders such as multiple evanescent white dot syndrome (MEWDS) first reported by Jampol et al. in 1984 [36]. From the early descrip-tions, electroretinography [37] analysis demonstrated photoreceptor dysfunction that was initially attributed to a primary RPE abnormality, since the hyperfluorescent FA pattern in MEWDS was interpreted as an RPE win-dow defect [38]. With the widespread clinical use of ICGA in the 1990s, the observation of late-phase ICG hypofluorescence suggested a choroidal origin of MEWDS lesions resulting from choroidal hypoperfusion [39]. The “choroidal” lesions were thought to perturb the RPE and outer retina sufficiently to account for the characteristic white spots. Recently, OCTA [40] has for the first time demonstrated completely normal chorioca-pillaris flow with no evidence of microvascular disrup-tion even in the areas with corresponding ICG hypofluorescence (Fig. 6). On the contrary, the hypo-fluorescent areas on ICGA co-localize with areas of hyporeflectivity with en face OCT at the level of the RPE-photoreceptor complex, thus confirming that the
“sick” and mottled RPE cells in these areas do not ab-sorb the ICG molecule leading to dark areas. OCTA has been essential in supporting for the first time the hy-pothesis that the choriocapillaris is not involved in MEWDS.
Fundus autofluorescence and optical coherence tomography angiography
of fluorescent material in the RPE reflects the level of meta-bolic activity, which is largely determined by the quantity of photoreceptor outer segment turnover.
Integrating OCTA findings in uveitis with FAF may pose various challenges. Abnormally high levels of FAF
retinopathy (AZOOR) [42], a nebulous disease that causes visual impairment due to progressive photorecep-tor loss. The RPE is sequentially affected following the death of photoreceptor cells. RPE autofluorescence has been employed as a marker for AZOOR activity [43]. In FAF images, hyperautofluorescence at the border of the expanding lesion may be the result of accumulated lipo-fuscin in RPE cells due to metabolic RPE over-activity related to increased photoreceptor outer segment turn-over. Alternatively, loss of photoreceptors may lead to unmasking of the underlying normal RPE autofluores-cence [44, 45].
Even if OCTA does not possess the capability to detect disruption of the RPE secondary to active inflammation, it may provide other meaningful information. The outer retinal photoreceptors are physiologically maintained by the diffusion of oxygen from the choriocapillaris (80%) below and from the deep retinal capillary plexus (20%) above. In animal models, retinal degenerations leading to loss of photoreceptors have been associated with the disproportionate diffusion of oxygen (from the deep plexus and the choroid) to the middle and inner retina, causing oxidative damage. As such, the deep retinal ca-pillary plexus may be primarily involved with the active stage of AZOOR, leading to outer retinal injury and photoreceptor loss. A future application of OCTA (Fig. 7)
will be used to study the deep capillary plexus at the border of the active/inactive AZOOR lesion (as distin-guished by FAF). OCTA may illustrate an increase in the deep flow at the level of the AZOOR lesion, which may be the source of damaging mediators of inflammation.
Enhanced depth imaging and optical coherence tomography angiography
Enhanced depth imaging-OCT (EDI-OCT) provides infor-mation on the structure of the choroid [46] by posteriorly displacing the zero-delay point, which is the point of max-imal OCT signal sensitivity. Positioning the zero-delay point closer to the choroid, rather than the inner retinal layers, results in an enhanced visualization of the choroid. Compared to ICGA, EDI-OCT has the advantage of pro-viding depth-resolved information [47]. A further advan-tage is the possibility to obtain cross-sectional images of the choroid that provide the capability to compare the choriocapillaris and choroid using OCTA and EDI-OCT.
choriocapillaris thickening and hyporeflectivity (indica-tive of choroidal ischemia on EDI-OCT) [48].
EDI-OCT is also able to detect space-occupying le-sions, such as choroidal granulomas [34] (Fig. 5), that can be identified as areas of increased homogeneity (with internal hyporeflectivity) within the choroid with loss of the typical choroidal vascular pattern and that are associated with increased signal transmission effect (un-like large choroidal vessels). As previously described,
small choroidal granulomas associated with sarcoidosis or TB is localized in the inner choroidal stroma and can be demonstrated by EDI-OCT but not identified with OCTA (Fig. 5c). As the granulomas grow, they extend in the loose choroidal connective tissue and shift and com-press the surrounding vasculature. Larger, full-thickness choroidal granulomas can be visualized on OCTA as areas of choriocapillaris non-flow that co-localize with hyporeflective lesions on EDI-OCT (Fig. 5f ).
Conclusions
Understanding the various findings on OCTA in patients with uveitis is an important step towards integrating this advanced novel technology in the routine clinical envir-onment. OCTA may be best employed in a multimodal approach in conjunction with other integral retinal im-aging systems. To optimally interpret changes in the vas-cular flow detected by OCTA, multimodal imaging is still essential. By comparing findings on OCTA with data obtained from traditional systems including dye-based angiographic devices (e.g., wide-field FA and ICGA) and FAF and spectral domain OCT, we are gaining essential information on the pathogenesis of various inflammatory conditions, developing more optimal and reliable follow-up protocols in a non-invasive way, and more accurately and objectively assessing the response to treatment in uveitis patients.
Abbreviations
APMPPE:Acute posterior multifocal placoid pigment epitheliopathy; AZOOR: Acute zonal occult outer retinopathy; CNV: Choroidal neovascular membrane; EDI: Enhanced depth imaging; FA: Fluorescein angiography; FAF: Fundus autofluorescence; ICGA: Indocyanine green angiography; MEWDS: Multiple evanescent white dot syndrome; OCT: Optical coherence tomography; OCTA: Optical coherence tomography angiography;
RPE: Retinal pigment epithelium; TB: Tuberculosis; VKH: Vogt-Koyanagi-Harada
Funding
No funding was received for the current review.
Authors’contributions
FP contributed to the conception and design and drafting of the manuscript. DS carried out the analysis and interpretation of data. MM contributed to the acquisition of data. SM contributed to the acquisition of data. PN contributed to the acquisition of data and revision of the manuscript. VG contributed to the revision of the manuscript. All authors read and approved the final manuscript.
Competing interest
The authors declare that they have no competing interests.
Publisher’s Note
Springer Nature remains neutral with regard to jurisdictional claims in published maps and institutional affiliations.
Author details
1Eye Institute, Cleveland Clinic Abu Dhabi, Al Maryah Island, PO Box 112412,
Abu Dhabi, United Arab Emirates.2Cleveland Clinic Lerner College of Medicine, Case Western Reserve University, Cleveland, USA.3Stein Eye Institute, University of California, Los Angeles, Los Angeles, CA, USA.4Greater Los Angeles VA Healthcare Center, Los Angeles, CA, USA.5Eye Clinic, Policlinico Sant’Orsola-Malpighi, Bologna, Italy.6ICARE eye hospital and Post Graduate Institute, Noida, India.7The Ocular Immunology Service, The Eye Clinic, Polytechnic University of Marche, Ancona, Italy.8Advanced Eye Centre, Post Graduate Institute of Medical Education and Research, Chandigarh, India.
Received: 9 August 2017 Accepted: 27 September 2017
References
1. Spaide RF, Fujimoto JG, Waheed NK (2015) Optical coherence tomography angiography. Retina. Nov;35(11):2161-2162
2. Gorczynska I, Migacz JV, Zawadzki RJ, Capps AG, Werner JS (2016) Comparison of amplitude-decorrelation, speckle-variance and phase-variance OCT angiography methods for imaging the human retina and choroid. Biomed Opt Express. Feb 19;7(3):911-942
3. Pichi F, Sarraf D, Arepalli S, Lowder CY, Cunningham ET Jr, Neri P, Albini TA, Gupta V, Baynes K, Srivastava SK (2017) The application of optical coherence tomography angiography in uveitis and inflammatory eye diseases. Prog Retin Eye Res. Jul;59:178-201
4. Leder HA, Campbell JP, Sepah YJ (2013) Ultra-wide-field retinal imaging in the management of non-infectious retinal vasculitis. J Ophthalmic Inflamm Infect 3(1):30
5. El-Asrar AM, Herbort CP, Tabbara KF (2010) A clinical approach to the diagnosis of retinal vasculitis. Int Ophthalmol 30:149–173
6. Lu J, Mai G, Luo Y, Li M, Cao D, Wang X, Yan H, Sadda SR, Lu L (2017). Appearance of far peripheral retina in normal eyes by ultra-widefield fluorescein angiography. Am J OphthalmolJan;173:84-90
7. Walton RC, Ashmore ED (2003) Retinal vasculitis. Curr Opin Ophthamol 14: 413–419
8. Kim AY, Rodger DC, Shahidzadeh A, Chu Z, Koulisis N, Burkemper B, Jiang X, Pepple KL, Wang RK, Puliafito CA, Rao NA, Kashani AH (2016). Quantifying retinal microvascular changes in uveitis using spectral domain optical coherence tomography angiography (SD-OCTA). Am J Ophthalmol. Sep 1. [Epub ahead of print]
9. Bessette AP, Baynes K, Lowder CY, Levison AL, Pichi F, Sharma S, Kaiser PK, Srivastava SK (2016). Qualitative and quantitative analysis of optical coherence tomography angiography in patients with retinal vasculitis. Retina [Epub ahead of print]
10. Kotsolis AI, Killian FA, Ladas ID, Yannuzzi LA (2010). Fluorescein angiography and optical coherence tomography concordance for choroidal neovascularisation in multifocal choroidtis. Br J Ophthalmol Nov;94(11):1506-1508
11. Thorne JE, Wittenberg S, Jabs DA (2006) Multifocal choroiditis with panuveitis incidence of ocular complications and of loss of visual acuity. Ophthalmology 113:2310–2316
12. Levison AL, Baynes KM, Lowder CY, Kaiser PK, Srivastava SK (2017). Choroidal neovascularisation on optical coherence tomography angiography in punctate inner choroidopathy and multifocal choroiditis. Br J Ophthalmol 101(5):616–622. 13. Onal S, Tugal-Tutkun I, Neri P, Herbort P C (2014). Optical coherence
tomography imaging in uveitis. Int Ophthalmol. Apr;34(2):401-435 14. Shimada H, Yuzawa M, Hirose T, Nakashizuka H, Hattori T, Kazato Y (2008).
Pathological findings of multifocal choroiditis with panuveitis and punctate inner choroidopathy. Jpn J Ophthalmol. Jul-Aug;52(4):282-288
15. Vance SK, Khan S, Klancnik JM, Freund KB (2011). Characteristic spectral-domain optical coherence tomography findings of multifocal choroiditis. Retina. Apr;31(4):717-723
16. Pichi F, Carrai P, Srivastava SK, Lowder CY, Nucci P, Neri P (2016). Genetic of uveitis. Int Ophthalmol 36(3):419–33.
17. Zahid S, Chen KC, Jung JJ, Balaratnasingam C, Ghadiali Q, Soreson J, Rofagha S, Freund KB, Yannuzzi LA (2016). Optical coherence tomography angiography of chorioretinal lesions due to idiopathic multifocal choroiditis. Retina [Epub ahead of print]
18. Agrawal RV, Biswas J, Gunasekaran D (2013). Indocyanine green angiography in posterior uveitis. Indian J Ophthalmol. Apr;61(4):148-159 19. Dzurinko VL, Gurwood AS, Price JR (2004). Intravenous and indocyanine
green angiography. Optometry. Dec;75(12):743-755
20. Herbort CP, Mantovani A, Papadia M (2012) Use of indocyanine green angiography in uveitis. Int Ophthalmol Clin. Fall 52(4):13–31
21. Gass JD (1968) Acute posterior multifocal placoid pigment epitheliopathy. Arch Ophthalmol 80(2):177–185
22. Mrejen S, Sarraf D, Chexal S, Wald K, Freund KB (2016) Choroidal involvement in acute posterior multifocal placoid pigment epitheliopathy. Ophthalmic Surg Lasers Imaging Retina 47(1):20–26
23. Klufas M, Phasukkijwatana N, Iafe NA, Prasad PS, Agarwal A, Gupta V, Ansari W, Pichi F, Srivastava SK, Freund KB, Sadda SR, Sarraf D (2017). Optical coherence tomography angiography reveals choriocapillaris flow reduction in placoid chorioretinitis. Ophthalmol Retina. Jan;1:77-91
24. Vasconcelos-Santos DV, Rao PK, Davies JB, Sohn EH, Rao NA (2010) Clinical features of tuberculous serpiginouslike choroiditis in contrast to classic serpiginous choroiditis. Arch Ophthalmol 128(7):853–858
25. Mandadi SKR, Agarwal A, Agarwal K (OCTA Study Group) (2016). Novel findings on optical coherence tomography angiography in patients with tubercular serpiginous-like choroiditis. Retina [Epub ahead of print]
26. Bansal R, Gupta A, Gupta V (2012) Imaging in the diagnosis and management of serpiginous choroiditis. Int Ophthalmol Clin 52:229–236 27. Cao JH, Silpa-Archa S, Freitas-Neto CA, Foster CS (2016). Birdshot
chorioretinitis lesions on indocyanine green angiography as an indicator of disease activity. Retina. Sep;36(9):1751-1757
28. Minos E, Barry RJ, Southworth S, Folkard A, Murray PI, Duker JS, Keane PA, Denniston AK (2016). Birdshot chorioretinopathy: current knowledge and new concepts in pathophysiology, diagnosis, monitoring and treatment. Orphanet J Rare Dis. May 12;11(1):61
29. Phasukkijwatana N, Iafe N, Sarraf D (2016). Optical coherence tomography angiography of a29 birdshot chorioretinopathy complicated by retinal neovascularization . Retin Cases Brief Rep. Sep 14 [Epub ahead of print] 30. Rao NA (2007) Pathology of Vogt-Koyanagi-Harada disease. Int Ophthalmol
27:81–85
31. Aggarwal K, Agarwal A, Mahajan S, Invernizzi A, Mandadi SK, Singh R, Bansal R, Dogra MR, Gupta V (OCTA Study Group) (2016). The role of optical coherence tomography angiography in the diagnosis and management of acute Vogt-Koyanagi-Harada disease. Ocul Immunol Inflamm. Jul 20:1-12
32. Chen L, Xu G (2013) Extensive choroidal infiltrates in choroidal biopsy proven ocular sarcoidosis. Retin Cases Brief Rep. Winter 7(1):69–70 33. Mehta H, Sim DA, Keane PA, Zarranz-Ventura J, Gallagher K, Egan CA,
Westcott M, Lee RW, Tufail A, Pavesio CE (2015). Structural changes of the choroid in sarcoid- and tuberculosis-related granulomatous uveitis. Eye (Lond). Aug;29(8):1060-1068
34. Invernizzi A, Mapelli C, Viola F, Cigada M, Cimino L, Ratiglia R, Staurenghi G, Gupta A (2015). Choroidal granulomas visualized by enhanced depth imaging optical coherence tomography. Retina. Mar;35(3):525-531
35. Chang AA, Zhu M, Billson F (2005). The interaction of indocyanine green with human retinal pigment epithelium. Invest Ophthalmol Vis Sci. Apr; 46(4):1463-1467
36. Jampol LM, Sieving PA, Pugh D, Fishman GA, Gilbert H (1984). Multiple evanescent white dot syndrome. I. Clinical findings. Arch Ophthalmol. May; 102(5):671-674
37. Moschos MM, Gouliopoulos NS, Kalogeropoulos C (2014) Electrophysiological examination in uveitis: a review of the literature. Clin Ophthalmol 8:199–214 38. Shahlaee A, Hong B, Sridhar J, Mehta S (2015). Multimodal imaging in
multiple evanescent white dot syndrome. Ophthalmology. Sep;122(9): 1836
39. Dell'omo R, Wong R, Marino M, Konstantopoulou K, Pavesio C (2010). Relationship between different fluorescein and indocyanine green angiography features in multiple evanescent white dot syndrome. Br J Ophthalmol. Jan;94(1):59-63
40. Pichi F, Srvivastava SK, Chexal S, Lembo A, Lima LH, Neri P, Saitta A, Chhablani J, Albini TA, Nucci P, Freund KB, Chung H, Lowder CY, Sarraf D (2016). En face optical coherence tomography and optical coherence tomography angiography of multiple evanescent white dot syndrome: new insights into pathogenesis. Retina. Aug 22. [Epub ahead of print] 41. Samy A, Lightman S, Ismetova F, Talat L, Tomkins-Netzer O (2014) Role of
autofluorescence in inflammatory/infective diseases of the retina and choroid. J Ophthalmol 2014:418193
42. Fujiwara T, Imamura Y, Giovinazzo VJ, Spaide RF (2010). Fundus autofluorescence and optical coherence tomographic findings in acute zonal occult outer retinopathy. Retina. Sep;30(8):1206-1216
43. Mrejen S, Khan S, Gallego-Pinazo R, Jampol LM, Yannuzzi LA (2014) Acute zonal occult outer retinopathy: a classification based on multimodal imaging. JAMA Ophthalmol. Sep;132(9):1089-1098
44. Joseph A, Rahimy E, Freund KB, Sorenson JA, Sarraf D (2013 Nov 1) Fundus autofluorescence and photoreceptor bleaching in multiple evanescent white dot syndrome. Ophthalmic Surg Lasers Imaging Retina 44(6):588–592
46. Baltmr A, Lightman S, Tomkins-Netzer O (2014). Examining the choroid in ocular inflammation: a focus on enhanced depth imaging. J Ophthalmol. 2014;2014:459136
47. Balci O, Gasc A, Jeannin B, Herbort CP Jr (2017). Enhanced depth imaging is less suited than indocyanine green angiography for close monitoring of primary stromal choroiditis: a pilot report. Int Ophthalmol Jun;37(3):737-748 48. Pichi F, Morara M, Veronese C, Nucci P, Ciardella AP (2013). Multimodal