R E S E A R C H
Open Access
Chemical and spectroscopic characterization of
insoluble and soluble humic acid fractions at
different pH values
Andrea Baglieri
1*, Daniela Vindrola
2, Mara Gennari
1and Michèle Negre
2Abstract
Background:Humic acids (HA) are organic molecules with complex structure and function and variable properties. They are insoluble in strongly acid pH conditions. At present, it is not clear how much is the amount of HA in solution at the pH of natural soils nor are known the characteristics of the different soluble fractions and their possible association with the inorganic phase of soil. The scope of this work was to characterize the soluble and insoluble fractions obtained by acidifying Na humate solution at pH values 3, 5, and 7 and to compare these fractions with the HA obtained at pH 1. At each pH, the precipitate and the soluble fractions were separated and characterized by elemental analysis, total acidity and carboxylic group content, infrared, and13C NMR and1H NMR spectroscopy.
Results:The HA fraction insoluble at pH 1 had a high acid group content and aromaticity but a low content of O-and N-containing groups. At pH 3, a fraction with nearly the same characteristics was obtained. At pH 1 O-and pH 3, the inorganic phase bound to the insoluble humic material was largely constituted by clay minerals and some Al and Fe hydroxides. The soluble fractions at pH values 1 and 3 were very poor and they were composed of a silica gel-like phase associated with polar organic material rich in carboxylic and metal-carboxylate groups. At pH values 5 and 7, only a small fraction of the Na humates precipitated. The fractions remaining in the solution were mainly composed of organic material particularly rich in aromatic and aliphatic groups, while the inorganic phase contained phyllosilicates. The fractions insoluble at pH values 5 and 7 contained a large amount of inorganic material that consisted mainly of phyllosilicates.
Conclusions: The soluble fractions obtained at pH values 5 and 7 represent the humic component that in
environmental situations would be dissolved in the soil solution. Our findings could be very useful for a more detailed investigation into the way HA influence plant metabolism under environmental-like conditions, both as regards pH conditions and interaction with the mineral fraction.
Keywords: Acid; pH; Mineral component; 13C NMR; FT-IR; Humic fraction
Background
Soil organic matter can be divided into two major components: organic substances of an individual nature and humic substances (HS). Traditionally, the soil HS have been subdivided into three fractions: fulvic acids, humic acids (HA), and humin.
It is widely recognized that HS are important for the sustainability of terrestrial life. The heterogeneous
chemical nature of HS exerts a multifunctional role in the environment by controlling the biogeochemical car-bon cycle [1,2], providing nutrients and bio-stimulants for plant growth [3,4], and interacting with inorganic [5] and organic pollutants [6,7].
It is common knowledge that the characteristics of HS depend on the extraction procedure adopted. This fact has been attributed to the complex nature of soil, to the wide range of physical and chemical properties inherent in humic material, and in particular to the intimate associ-ation of organic and inorganic soil constituents [8]. Most of the studies reporting the effect of extraction procedures * Correspondence:abaglie@unict.it
1Dipartimento di Scienze delle Produzioni Agrarie e Alimentari, University of Catania, Via S. Sofia 98, 95123 Catania (CT), Italy
Full list of author information is available at the end of the article
on the chemical structure of HS have concerned the nature of the extraction solvent. These studies pointed out that both the type of soil and the extraction pH played a role in the chemical structure and molecular weight of the humic materials. The procedure recommended by the International Humic Substances Society (IHSS) for pre-paring HA [9] includes 0.1 M sodium hydroxide extrac-tion followed by 0.1 M hydrochloric acid precipitaextrac-tion. In accordance with the new concept of supramolecular asso-ciation, the HA obtained by this procedure is composed of many relatively small, chemically diverse organic mol-ecules which form clusters linked by hydrogen bonds (H-bonds) and hydrophobic interactions [10]. A corol-lary to this model is the concept of micellar structure, i.e., an arrangement of organic molecules in aqueous so-lution which form hydrophilic exterior regions that shield the hydrophobic interiors from contact with vicinal water molecules [11].
It is assumed that humic acids are completely soluble at pH 13 and completely insoluble at pH 1, but the solu-bility of HA at intermediate pH values has not been fully investigated. Brigante et al. [12] measured the dissolution kinetics of HA prepared according to the IHSS procedure at different pH values between 10 and 4. HA were com-pletely soluble within less than an hour at pH > 10. At pH between 10 and 9, the dissolution was slower but nearly complete. At pH 8.5 and 8, more than 60% and 40% of the HA respectively were soluble. The separation of HA in a soluble and an insoluble phase at these pH values attests for the heterogeneity of the material defined as humic acid on the basis of its insolubility at pH 1. At our knowledge, the chemical differences between the soluble and insoluble fractions at a given pH have not been investigated.
A drawback of the IHSS procedure is that the HA may contain quite large amounts (e.g., 30%) of inorganic com-ponents. Although some attempts have been made to des-troy the organo-mineral associations before HS extraction [13,14], a purification procedure aimed at obtaining ash-free organic fractions is commonly carried out on the extracted humic materials.
Such purification procedure, based on hydrochloric-hydrofluoric acid solubilization of the inorganic fraction, generally decreases the ash content to less than 2%. This is considered a good result as far as the purity of the humic material is concerned. However, little attention has been given to the nature of the inorganic fraction brought in solution by the alkaline extraction and so strongly bound to the humic material to require a drastic treat-ment to be released.
In this study, a Na humate solution was prepared following the IHSS procedure but without treatment to eliminate the inorganic phase. Aliquots of the humate solution were brought to pH 7, 5, 3, and 1, and the
corresponding soluble and insoluble fractions were col-lected and characterized. The scope was to determine the chemical structure of the organic and inorganic materials precipitated or left in solution at each pH and to obtain some elucidation on the nature of their interactions.
Experimental
Materials
Soil
The HA was extracted from a histosol (Trana, Turin, Italy), studied in another article [15], having the follow-ing properties: pH, 6.9; clay, 5.7%; loam, 30.5%; sand, 63.8%; organic carbon, 8.51%; cation exchange capacity, 52.9 meq/100 g; Na oxalate extractable Fe, 0.68%; Na dithionite-citrate-bicarbonate extractable Fe, 0.86%; and Na pyrophosphate extractable Fe, 0.22%.
Methods
Preparation of the HA fractions
The soil (100 g subsamples in 500 ml PE flasks) was equil-ibrated to a pH value of between 1 and 2 with 1 M HCl; the suspension was brought to 500 ml with 0.1 M HCl, shaken for 1 h, centrifuged, and the supernatant elimi-nated. The solid phase was neutralized to pH 7 with 1 M NaOH, then 0.1 M NaOH was added to provide a final volume of 500 ml. The suspension was shaken under N2
for 20 h, allowed to settle overnight, then centrifuged (1,500g, 30 min) to separate the supernatant. A series of three alternate treatments with 0.1 M HCl and 0.1 M NaOH was performed to solubilize and remove the fulvic acids. After the final treatment, the precipitate resulting from acidification was dissolved in 0.1 M NaOH, and the whole was treated as illustrated in Figure 1. Equal parts of Na humate were acidified with 0.1 HCl M at different pH values, 1, 3, 5, and 7. At each pH, the soluble and insoluble fractions were separated by centrifugation. Subsequently, the fractions were dialyzed (MW cut-off 3,500 Da) and then freeze-dried.
Characterization of the HA fractions
The HA fractions were characterized for total acidity and carboxylic group content in accordance with the proced-ure proposed by Swift [9]; measproced-urement of the phenol OH was obtained by difference; the C, H, N content was deter-mined using a C, H, and N LECO Analyzer model 600 (LECO Corp., St. Joseph, MI, USA); O content was calcu-lated by difference. Ash content was determined by incin-eration at 650°C for 4 h.
to 400 cm−1range on pellets obtained by pressing a mix-ture of 1 mg organic sample and 400 mg dried KBr.
Solid-state13C MAS NMR spectra were recorded, fully proton-decoupled, on a Bruker MSL 200 NMR (Bruker Corp., The Woodlands, TX, USA) instrument operating at 50.3 MHz. Rotors with a 7-mm diameter were filled with about 50 mg of the sample; the spinning rate was 4,000 Hz s−1. The following experimental parameters were adopted: spectral width 20,000 Hz, data points 2 K, 100,000 scans, 4 µs, 90 degrees of excitation pulse, and 4 s of relaxation delay. The HPDEC pulse sequence was used with a decoupling power of 300 W (9H). The FID were zero-filled and processed with 5 Hz line broadening. Chemical shifts refer to13CO of glycine, set at 176.03 ppm.
The 1H NMR spectra were recorded using a JEOL EX-400 spectrometer (JEOL, Peabody, MA, USA) equipped with a 5 mL probe operating at 399.78 MHz. Samples were prepared by dissolving 20 mg of the sample in 0.6 mL of 0.1 M NaOD/D2O. After filtration through a glass wool
filter, the samples were placed in NMR tubes for analysis. All the samples were adjusted to pH 12. The 1H NMR spectra were recorded using the presaturation sequence for selective saturation of the HDO resonance [16]. The main NMR parameters were 45° pulse width, pre-irradiation
10 s, acquisition time 5.46 s, and 64 scans for a total acquisition time of about 16 min.
The iron and aluminum oxide contents were evaluated by Na dithionite-citrate-bicarbonate extraction [17] at 25°C (Fe DCB and Al DCB, respectively). Aqua regia was used to attack the metals, and then the total iron and aluminum in the humic fractions were analyzed.
All chemicals were of analytical grade, and three repli-cates per analytical determination were carried out.
Analytical data were evaluated by one-way ANOVA (P< 0.005) followed by the Tukey’s test for multiple com-parison procedures.
Results
Yield and ash content
The yield, ash content, and elemental composition of the humic fractions at each pH are reported in Table 1.
As expected, the yield of the insoluble fractions decreased as pH increased, while the contrary occurred for the soluble fractions. The total humic material (soluble + insoluble) ex-tracted at each pH was not about the same (86.2, 95.2, 82.5, and 74.7 g kg−1soil at pH 1, 3, 5, and 7, respectively). The observed differences, in particular the low total recovery at pH 7, suggest some loss of material, probably inorganic and Figure 1Preparation of insoluble and soluble humic acid fractions at different pH values.
Table 1 Yield, ash content, and elemental composition of the humic fractions
Fraction Yield
(g kg−1soil) Ash a
(g kg−1 humic fraction)
Elemental compositionb(g kg−1humic fraction) Molar ratio
C H N O O/C
pH 1 Insoluble 83.9 247 541a 42a 43a 374a 0.5
Soluble 2.3 196 478bd 44a 43a 434bc 0.7
pH 3 Insoluble 88.0 267 525a 45a 42a 388ab 0.5
Soluble 7.2 127 493bc 41a 45a 421abc 0.6
pH 5 Insoluble 22.2 542 478bd 55b 40a 427bc 0.7
Soluble 60.3 225 518ac 49b 41a 392ab 0.6
pH 7 Insoluble 7.4 609 451d 52b 39a 459c 0.8
Soluble 67.3 283 534a 49b 42a 375a 0.5
a
Values are the means of three replicates, and the standard error values are < 10%;b
organic molecules smaller than the dialysis membrane MW cut-off.
The sum of the ash content of the soluble and insol-uble fractions is not the same at each pH. However, this difference is only apparent when considering the value corrected by the yield (21.2, 24.5, 25.6, and 23.6 g at pH 1, 3, 5, and 7 respectively, for extracts from 1 kg of soil). This is demonstrated by the following calculation:
Gram of ash at each pH ¼ Yeld IF %IF ash
100
þ Yeld SF%SF ash
100
where IF is the insoluble fraction and SF is the soluble fraction.
The high ash content in all fractions emphasizes the importance of employing a purification step if ash-free humic fractions are to be obtained. The effectiveness of the purification step in HA prepared from a histosol was demonstrated by Piccolo [18] who reported a decrease in the ash content from 500 to 10 g kg−1following HF-HCl washing. The ash contents of more than 500 g kg−1in the insoluble fractions at pH 5 and pH 7 attest that there is more inorganic than organic material and is the likely reason for the lack of solubility of these fractions.
Elemental composition
The elemental composition of the humic fractions is re-ported in Table 1 on a moisture- and ash-free basis. There-fore, the following considerations concern the organic component of each fraction. While the insoluble fractions at pH 1 and 3 were richer in C and poorer in O than the soluble fractions, the O increased at pH 5 and 7 indicating that the precipitation pH of the HA affected the distribu-tion of the funcdistribu-tional groups between the precipitated and the liquid phase. The C content was lower at pH 5 and 7 than at pH 1 and 3 in the insoluble fractions, while the opposite was true for the soluble fractions. The O content and O/C ratio were lower in the insoluble fractions at pH 1 and 3 than at pH 5 and 7 indicating that polarity in-creased along with pH, while the opposite occurred in the soluble fractions. In the case of the N content, no clear trend could be identified indicating that pH did not affect the distribution of the N-containing moieties in the solid or liquid phase. The H content was higher at pH 5 and pH 7 than at pH 1 and pH 3 in both the insoluble and sol-uble fractions. This would appear to be an artifact, since the sum of each element present in the soluble and insol-uble fractions deriving from the same alkali solution should be the same at any pH. The highest H contents were found in the fractions exhibiting the highest ash con-tents. This suggests that the presence of inorganic compo-nents could induce an overestimation of the H content. One explanation for this result is that the elemental ana-lysis includes a high-temperature incineration step (up to 1,000°C) which could provoke the release of some
hydration water and lead to the partial decomposition of some inorganic components, such as kaolinite, thereby releasing OH groups and leading to an overestimation of the hydrogen content.
Acidic groups
The carboxylic, phenolic, and total acidity distribution in each fraction are reported in Table 2. The wet method used to determine the carboxylic group content is based on titration with Ca acetate. The aim of this technique is to convert the complex mixture of acids in HS into an equivalent amount of acetic acid by the reaction [19]:
2RCOOHþ Ca CH3COOð Þ2↔Ca RCOOð Þ2þCH3COOH
This method is reliable only if the carboxylic groups are completely combined. This is why the carboxylic group content, measured using the wet chemical method, de-creased at decreasing pH. The total acidity was not meas-urable at pH 5 and 7. This was most likely due to the carbonation of the barium hydroxide solution used in titration, as reported by Stevenson [20]. Consequently, the content of phenolic groups could not be calculated.
13
C NMR
The distribution of the different forms of carbon calcu-lated according to the area of the different NMR spectra regions (alkyl, 0 to 45 ppm; N- and O-alkyl, 45 to 95 ppm; aromatic, 95 to 160 ppm; carboxyl, 160 to 195 ppm) are reported in Table 2.
The amount of carboxyl carbon calculated from the integration of the signal in the 160 to 195 ppm region was much higher than expected considering the chem-ical titration. This discrepancy has already been reported and discussed in the previous papers [21,22].
The insoluble fractions at pH values 1 and 3 are largely aromatic (33.1% and 33.9% of the total carbon respectively) with a medium amount of aliphatic carbon (23.0% and 21.0% of the total carbon respectively) and a low content of substituted aliphatic groups (16.0% and 18.3% of the total carbon respectively). Similar concen-trations of aromatic carbon were found in HA from histosols by13C NMR investigation [15,23,24] and reflect the high maturity of the HA expected in such soils. By contrast, the soluble fractions at pH 1 and pH 3 contain a very low amount of aromatic C (2.9% and 7.5% of the total carbon) but are very rich in aliphatic substituted carbons (58.8% and 42.1% of the total carbon). These results, to-gether with the high O content of these fractions (Table 1), suggest the presence of polar aliphatic compounds (sugars, amino acids, proteins, carboxylic acids) which are most likely responsible for the solubility at low pH values.
as proposed by several authors [25-28]. This is given by the areas relative to resonance intervals, as follows:
HB
HI ¼
0−45
ð Þ þð95−160Þ
½
45−95
ð Þ þð160−195Þ
½
The fractions insoluble at pH 1 and 3 have a degree of hydrophobicity (Table 2) greater than the soluble frac-tions, with values (> 1.0) that are consistent with those observed for HA (between 0.61 and 2.87) by Piccolo et al. [26]. On the other hand, the values of the soluble fractions at pH 1 and 3 of HB/HI are more similar to the same authors’findings for fulvic acids (< 0.5).
The13C NMR spectra of the insoluble fractions at pH 5 and 7 with a high ash content exhibit a low signal-to-noise ratio probably due to the presence of paramagnetic com-pounds as already observed in soils [29] and humic samples [30]. Consequently, no reliable evaluation of the carbon distribution could be made.
The soluble fractions at pH 5 and pH 7 exhibited a high content of aromatic carbon (38.7% and 35.2% of the total carbon respectively) and a low content of N- and O-substituted aliphatic groups. This is in agreement with the decrease in soluble fraction polarity as pH increases, which is assumed on the basis of the elemental analysis and the degree of hydrophobicity.
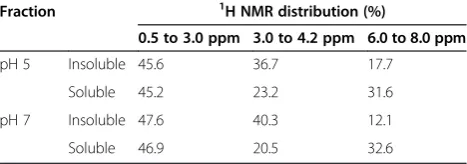
The organic component of the fractions obtained at pH 5 and 7 was also studied with 1H NMR in order to obtain more information regarding their chemical characteristics. This technique proved easier to use with samples having a higher ash content than did 13C NMR. The1H NMR data agree well with the data obtained from the13C NMR but tend to underestimate the aromaticity, above all when the aromatic molecules are substituted with atoms other than hydrogen [31].
The distribution of the different forms of hydrogen was calculated by integration in three regions of the spectrum (0.5 to 3 ppm, 3 to 4.2 ppm, and 6 to 8 ppm) and expressed as a percentage of the total area of each
spectrum. The allocation of the three regions was based on the work of Francioso et al. [32]. The region from 0.5 to 3 ppm corresponds to the H forms linked to aliphatic groups, the region from 3 to 4.2 ppm is assigned to the H forms linked to carbohydrate structures, and finally the region between 6 and 8 ppm is allocated to the H forms linked to aromatic molecules.
From Table 3, which relates to the distribution of the1H forms, it can be seen that the aliphatic region is similar for all the fractions obtained at pH 5 and 7, while the region related to carbohydrates (between 3 and 4.2 ppm) is higher in insoluble fractions than soluble. Moreover, the latter is more aromatic than the insoluble one. In agree-ment with the eleagree-mental analysis, these components are more polar than the soluble fractions (Table 1).
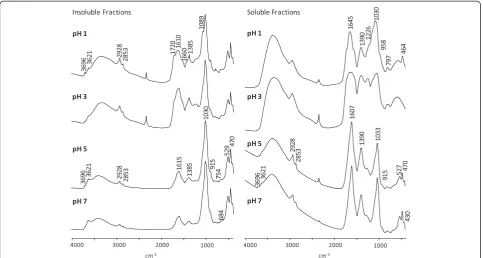
FT-IR
The FT-IR spectra indicate some large differences between the humic fractions, attesting to the different structures of both the inorganic and organic material (Figure 2). The spectra of the insoluble fractions at pH 5 and 7 (containing more than 50% inorganic component) were identical and dominated by the intense absorption of the Si-O vibration centered at 1,030 cm−1 typical of montmorillonite [33]. The other bands attributable to the inorganic components have the same frequencies as those of montmorillonite defiled with kaolinite [33,34] as follows: 3,696 cm−1, OH stretching of inner-surface hydroxyl groups of kaolinite; 3,621 cm−1, OH stretching Table 2 Acidic groups’concentration and distribution of C intensity of13C NMR spectra of humic fractions
Fraction Acidic groupsa(meq g−1) 13C NMR distribution (%) HB/HI Carboxyl Phenol Total acidity 0 to 45 ppm 45 to 95 ppm 95 to 160 ppm 160 to 195 ppm
pH 1 Insoluble 3.8 7.3 11.1 23.0 16.0 33.1 28.0 1.3
Soluble 4.0 6.7 10.7 14.2 58.8 2.9 24.2 0.2
pH 3 Insoluble 3.1 5.9 8.9 21.0 18.3 33.9 26.9 1.2
Soluble 2.8 6.7 9.4 14.5 42.1 7.5 35.9 0.3
pH 5 Insoluble ndb ndb ndc ndc ndc ndc
-Soluble ndb ndb 20.8 6.0 38.7 34.5 1.5
pH 7 Insoluble ndb ndb ndc ndc ndc ndc
-Soluble ndb ndb 19.1 1.3 35.2 44.3 1.2
a
Values are the means of three replicates. The standard error values are < 10%;b
analytical method not applicable at these pH;c
not determinable because of the poor signal-to-noise ratio of the spectra.
Table 3 Distribution of H intensity of the1H NMR spectra of the humic fractions
Fraction 1H NMR distribution (%)
0.5 to 3.0 ppm 3.0 to 4.2 ppm 6.0 to 8.0 ppm
pH 5 Insoluble 45.6 36.7 17.7
Soluble 45.2 23.2 31.6
pH 7 Insoluble 47.6 40.3 12.1
of hydroxyl groups; 915 cm−1, AlAlOH deformation; 754 cm−1, Si-O perpendicular (kaolinite); 470 cm−1, Si-O-Si deformation; 430 cm−1, Si-O deformation (kaolinite). The band at 529 cm−1could be the Al-O-Si deformation of montmorillonite, although it is generally reported at lower frequencies (521 to 523 cm−1). Some of the typical bands of montmorillonite are missing (790, 623, and 578 cm−1). The lack of such bands has already been ob-served in soil montmorillonites and attributed to a larger disorder which provokes the broadening and vanishing of these bands [33]. Besides the bands of the inorganic com-pounds, the main organic bands are the aliphatic absorp-tions at 2,928 and 2,853 cm−1(CH2stretching). Also, the
two bands centered at 1,615 and 1,385 cm−1, typical of the asymmetric and symmetric vibrations of carboxylates, reflect the presence of metal carboxylates.
The spectra of the soluble fractions at pH 5 and pH 7 show the same bands as those attributed to the vibra-tions of kaolinite and montmorillonite for the insoluble fractions (3,696, 3,620, 1,033, 915, 527, 470, and 430 cm−1) but with lower intensity due to their lower ash content. The COOH vibration is missing, while very strong bands are present at 1,607 (νasCOO−) and 1,390 cm−1(νsCOO−).
The frequency of theνasCOO−has been seen to decrease
in parallel to an increase in the ionic radii of the metallic ion [35]. According to these authors, theνasCOO− band
shift toward higher frequencies corresponds to the transi-tion from ionic to covalent bond and can be used to estab-lish the ionic-covalent nature of metal carboxylates. This
statement was contested by Piccolo and Stevenson [36], given the possibility that the metal-complexed ketonic group could give a band in the 1,620 to 1,610 cm−1region. However, the νasCOO− on the spectra of the soluble
frac-tions at pH 5 and 7 (1,607 cm−1) does not fall in the ketonic region and is between those reported by Vinkler et al. [35] for Na humate (1,590 cm−1) and by Piccolo and Stevenson [36] for K humate at pH 5 (1,610 cm−1). This suggests the formation of ionic humates, probably with a great pres-ence of Na ions in the solution at these pH values.
The spectra of the insoluble fraction at pH 1 and pH 3 exhibit the same, but weaker, bands as those attributed to the inorganic component in the insoluble fractions at pH 5 and 7. In contrast, the HA bands are stronger and some new peaks are present, in particular, the COOH vibration at 1,720 cm−1; the band in the 1,610 to 1,660 cm−1region is broader with a shoulder at 1,660 cm−1and is likely due to an overlap betweenνasCOO−vibration, aromatic -C =
C-vibration and N-containing groups. A partial influence on this band can also come from the OH stretching of water bonded to the clay minerals which has been seen to absorb in the 1,630 to 1,660 cm−1range [33].
The spectrum of the insoluble fraction at pH 1 exhibits a strong band at 1,089 cm−1similar to that shown on the spectrum of a montmorillonite and attributed to the Si-O stretching of a cristobalite-like phase impurity [34].
bands of the inorganic components. The silicates O-Si-O vibration band centered at 1,030 cm−1on the other spec-tra is broad and shifted at higher frequencies (up to 1,075 cm−1at pH 1). A Si-O vibration at 1,075 cm−1, be-sides weaker bands at 1,200, 958, 797, and 464 cm−1, has been attributed to the silica gel [37]. The same bands are present on the spectrum of the soluble fraction at pH 1 which also exhibits the two carboxylate group bands (1,645 and 1,390 cm−1). Very similar spectra were reported for the soluble products formed between hydroxy-Al ions and orthosilicic acid in the presence of citric acid [37] and HS [38]. This suggests that the fractions which do not pre-cipitate at low pH are organo-mineral colloids in which the inorganic phase is similar to the silica gel. However, the frequency of the broad band centered at 1,645 cm−1is higher than those reported by Vinkler et al. [35] also in the case of covalent humates with Fe and Al (1,625 cm−1) and should be overlapped by other absorptions, for example, the OH vibration of water molecules bonded to silica gel which occurs at 1,630 cm−1[33].
Although the FT-IR spectra of these fractions provided evidence of the presence of phyllosilicates and silica gel, we cannot exclude that the inorganic fractions also con-tain iron and aluminum oxides. The FeOH bending and the Fe-O stretching of a Fe(III) synthetic polycation absorb at 550 and 680 cm−1 respectively [39,40]. Other authors report that the main absorption of ferrihydrite took place at 587 cm−1while hematite gave sharp bands at 460 and 580 cm−1[41]. On the spectra for those insol-uble fractions at pH 5 and pH 7, a weak band is present at 684 cm−1which could be attributed to Fe-O stretch-ing, while the other bands typical of Fe vibrations could be overlapped or dwarfed by the strong absorption of sil-icates. The hydroxides are generally identified by several diagnostic bands in the OH stretching region, their number and frequency depending on the grade of crys-tallinity of the minerals [42]. However, in the presence of silicates with water in the interlayer, these bands have been seen to mix in a single broad absorption band in the 3,000 to 3,630 cm−1 range [42]. Therefore, the lack of such bands in our samples does not mean that they do not contain aluminum hydroxides. The other typical Al hydroxide bands are at 1,025, 970, and 531 cm−1[43]. The first two bands are overlapped by Si-O absorption at 1,030 cm−1, but a strong band at 530 cm−1cannot be attributed to silicates and could indicate the presence of aluminum hydroxides.
Metal concentrations in the inorganic components
The total metal content and the DCB extractable concen-tration of Al and Fe in the humic fractions are reported in Tables 4 and 5. The highest concentrations of Si and Al (as total Al) were found in the insoluble fractions, which indicate the presence of phyllosilicates (Table 4). In the
insoluble fractions at pH 5 and pH 7, less than 5% Al was DCB extractable showing that this metal was mainly present in clay mineral structures. In the insoluble frac-tions at pH 1 and pH 3, 28% and 32% of the total aluminum were DCB extractable indicating that part of the Al was present as oxyhydroxides or HA bound. In contrast, the DCB extractable Fe was more abundant in the insoluble fractions at pH 1 and 3 (64%) than at pH 5 and 7 (34 and 46% respectively). The high proportion of DCB extractable Fe in the HA-rich fractions at pH 1 and 3 suggests the presence of organo-metallic compounds in which the Fe atom could act as a bridge between the humic and inorganic phases.
In the soluble fraction at pH 3, all the Al and Fe were DCB extractable attesting to a lack of clay minerals, which agrees with the silica-gel structure deduced from the FT-IR spectra. In the soluble fractions at pH 5 and 7, more than 70% of the total amount of Fe and more than 40% of the total amount of Al were DCB extract-able indicating the presence of oxyhydroxides and HA bound forms.
The presence of Na humates and phyllosilicates in the soluble and insoluble fractions, respectively, affected the Na concentration with the increasing of pH value (Table 5).
K was much less abundant than Na. The highest con-centrations were found in the insoluble fractions suggest-ing that besides Na+, K+ also neutralized the negative surface charges of the clay minerals. Mg followed more or less the same trend as K. As far as Ca was concerned, no trend could be identified suggesting that this cation is ex-changeable on both the phyllosilicate and Ca humates. It can also act as a bridge between the organic and inorganic phases.
Discussion
and columbic interactions, but Schutless et al. [46] rec-ommend being careful in interpreting adsorption studies since at low pH values, adsorption and precipitation mechanisms are difficult to differentiate. The organo-mineral aggregates could also have been stabilized by the presence of Al and Fe, not included in phyllosilicate structures, and low amounts of alkaline and alkaline earth metals. Polyvalent cations are known to promote the interaction of HA with phyllosilicates through the formation of cation bridges [47,50].
The soluble fractions at pH 1 and pH 3 account for less than 10% of the total material but this data is under-estimated because part of this fraction has been lost dur-ing the dialysis step. The organic phase contains less than 10% aromatic carbon and is rich in O- and N-containing groups and carboxylic groups. Therefore, it should be composed of soluble polar molecules such as polysaccha-rides, organic acids, and amino acids. The inorganic frac-tion is mainly composed of a silica gel-like phase whose formation could be an artifact due to the polymerization of silicic acid by freeze-drying [34]. On the other hand, orthosilicic acid occurs in solutions and on the surface of
solid particles in soil [51]. The FT-IR spectra suggest the presence of Al and Fe oxides whose solubility is consistent with the low pH and a possible complexation by small organic molecules.
The fractions insoluble at pH 5 and pH 7 contain a large amount of inorganic material (54% and 61% at pH 5 and 7 respectively). The inorganic phase mainly consists in phyllosilicates (kaolinite and montmorillonite).
Less than 5% Al is DCB extractable indicating that all the Al atoms are included in phyllosilicate structures.
These results suggest that the material precipitated at pH 5 and 7 does not exhibit a typical humic structure. It is more likely an organo-mineral association of clay min-erals bound to polar molecules. This result is in agreement with the study by Yong and Mourato [52], performed on the interaction of kaolinite and dextran, which demon-strated the capability of polysaccharides to act as floccu-lants of clay minerals.
The soluble fractions at pH 5 and pH 7 account for 73% and 90% of the total humic material, respectively. These fractions are particularly rich in aromatic and ali-phatic groups and exhibit a very low polar group content as indicated by both the NMR results and the low O/C ratio. The fact that most of the polar molecules were no longer present in this typical humic material, but precip-itated as organo-mineral associations (see the above paragraph), suggests that contrary to the usual assump-tion, they were not strongly bound to the humic acid.
There is evidence of the presence of kaolinite and montmorillonite whose solubility, probably as a colloidal solution, is promoted by the presence of large amounts of Na+. On the other hand, the phyllosilicates account for only part of the inorganic phase since more than 40% Al and 70% Fe are DCB extractable, indicating the presence of oxihydroxides and/or Al and Fe humates. The increased solubility of the humic fraction at increas-ing pH is expected due to the deprotonation of the carboxylic and phenolic groups. The carboxyl groups are Table 4 Total and DCB extractable Al and Fe in the humic fractions
Fraction Si Fe Al
Total Total DCB extractable Total DCB extractable
(mol kg−1) (mol kg−1) (mol kg−1) (%)a (mol kg−1) (mol kg−1) (%)a
pH 1 Insoluble 1.81a 0.47abe 0.30ab 64 1.02a 0.29ac 28
Soluble nd nd nd nd nd nd nd
pH 3 Insoluble 1.67ae 0.60ace 0.35ab 58 1.03a 0.33a 32
Soluble 0.87be 0.24bde 0.24a 100 0.08b 0.10b 125
pH 5 Insoluble 3.67c 0.73c 0.25a 34 2.33cd 0.09b 4
Soluble 0.84be 0.37de 0.28ab 76 0.46a 0.22c 48
pH 7 Insoluble 4.22d 0.83c 0.37b 46 2.74d 0.10b 4
Soluble 1.26e 0.38e 0.27ab 71 0.60a 0.26c 43
a
Percentage of the total. Within columns, values followed by the same letter are not significantly different (P< 0.05). nd, not determined.
Table 5 Total metal concentration of the humic acid fractions
Fraction Ca K Mg Na
(mol kg−1) (mol kg−1) (mol kg−1) (mol kg−1) pH 1 Insoluble 0.07ad 0.13ad 0.17ad 0.31a
Soluble nd nd nd nd
pH 3 Insoluble 0.11abcd 0.18a 0.22a 0.50a
Soluble 0.14abcd 0.06b 0.03b 1.69b
pH 5 Insoluble 0.12abcd 0.28c 0.55c 0.97c
Soluble 0.16bcd 0.07b 0.11d 2.32d
pH 7 Insoluble 0.09cd 0.33c 0.67e 1.00c
Soluble 0.14d 0.10bd 0.17ad 2.21d
known to be completely undissociated at pH < 3 and mostly ionized at pH > 7, while the dissociation of the hydroxyl phenolic groups occurs at higher pH values. It is surprising that this fraction, whose organic phase has the typical features of mature humic acid, rich in aromatic and aliphatic moieties and therefore largely hydrophobic, was soluble at pH 5.
Our results are in contrast with the reported data con-cerning the solubility of HA which are usually found to be completely soluble at much higher pH (at least > 8) [53]. One of the reasons for such a discrepancy could be the solubilization procedure which several studies re-port as affecting the behavior of the humic substances. Klucakova et al. [54] have observed that the fresh, wet HA precipitate is very easily peptized upon washing with water which is accompanied by a gradual increase in pH. Solubility of dried, solid preparation in water is much more difficult, especially when not freeze-dried. This last observation is consistent with the experiments by Brigante et al. [12] which observed a complete solubilization only at pH ≥9 (eliminato un pezzo perché usato nell’ introdu-zione). The discrepancy between our results and those of Brigante et al. [12] could be explained by the different pro-cedure for modifying the pH. In our experiment, we started from a humate solution to which amounts of HCl were added, while Brigante et al. [12] started from a solid humic acid brought to higher pH by NaOH addition. This suggests that it is less easy to form aggregates by acidifying a humate solution than to disrupt them by bringing solid HA to higher pH. Therefore, the solubilization-precipitation process of HS should behave hysteretically.
Our study points out that a decrease in the pH of a humate solution from 5 to 3 provokes a drastic change in the aggregation of the humic molecules. This pH range has not yet been fully investigated. The average pKaof the
carboxylic groups of the HA is 4.5 [55,56]. More recent studies [57], based on the Anderson-Hasselbach interpret-ation, have established that the apparent pKa of a peat
humic acid was 4.93. Alvarez-Puebla and Garrido [58] measured the zeta potential of a grey humic acid against pH and observed a drop in the pH intervals 3.6 to 4.2 and 5.9 to 6.2, with a section of null slope between the two. The null slope section between these drops seems to indi-cate that the electrokinetic properties of the colloids do not change in this interval. The plot of the size variation against pH showed great similarity. The porosity mea-sured through CO2 adsorption isotherms indicated a
de-crease in the pore size and surface area between pH 4 and pH 5, while no relevant difference was observed between pH 2 and pH 4. The results of Alvarez-Puebla and Garrido [58] indicate that the decrease in colloidal size appears to be more influenced by the ionization of phenolic groups than by the ionization of carboxylic groups. This is be-cause the phenolic groups and the undissociated
carboxylic groups can participate in forming hydrogen bonds thus promoting the coiling of the molecules and the formation of aggregates.
Another factor affecting the solubility of HS is the amount and composition of the inorganic phase. Ex-tracted HA are usually treated with HCl-HF solution until a low ash content is reached, usually < 2%. Little at-tention is given to the residual inorganic phase because it is assumed that it does not affect the behavior of the organic material. Klucakova et al. [59] reported the equi-librium constants concerning lignitic HA treated or not treated with HCl-HF. From these results, it appears that the ratio between HA(aq) and HA(s) decreased as ash content increased.
To better understand the behavior of the HA at pH 5, especially the possibility of forming metallic humates, it would be useful to have more information on the nature of the carboxylic groups. Powell and Fenton [53] per-formed a titration of the carboxylic groups of a peat HA. They found that up to 20% of the COOH groups were weak acids, with titration constants above log K= 5.0, indicative of polyprotic moieties which contribute sig-nificantly to the metal binding properties of HS. This suggests that the dissociated COOH groups below pH 5 are monoprotic moieties unable to bind bivalent and triva-lent cations. The soluble fractions at pH 5 and 7 contain more than 20% of inorganic material probably present as a colloidal solution whose stability is promoted by the sodium ions. According to the results of Powell and Fenton [53], the formation of metal humates with bi-valent and tribi-valent ions could take place at pH 7. On the other hand, the complete ionization of the carboxylic groups at this pH could explain the solubility of the corre-sponding fraction.
Conclusions
Our results indicate a notable change in the behavior and composition of the humic acid we studied in the pH range from 3 to 5. In this pH range, the humic acid changes from insoluble to a colloidal solution, notwithstanding the hydrogen bonds and weak molecular forces. On the other hand, it has also been demonstrated [54,59] that solubilization of HA is not only dependent on the de-protonation of COOH and that undissociated molecules can be water soluble.
Most of the fraction consisting in O-containing groups, notwithstanding its high polarity, does not remain in solution at pH 5 and pH 7 but precipitates with the phyllosilicate-rich inorganic phase. This suggests that it is not strongly bound to the humic fraction.
very poor and composed of a silica gel-like associated with polar organic material.
The results emphasize the effect that the prepar-ation procedure can have on the behavior of the humic substances.
Abbreviations
HS:humic substances; HA: humic acids; IHSS: International Humic Substances Society; NMR: nuclear magnetic resonance.
Competing interests
The authors declare that they have no competing interests.
Authors’contributions
The work presented here was carried out in collaboration between all authors. MN defined the research theme; MN and AB designed methods and experiments; DV carried out the laboratory experiments, AB, MG and MN analyzed the data, interpreted the results, AB and MN wrote the paper. All authors have contributed to, seen, and approved the final manuscript.
Author details
1Dipartimento di Scienze delle Produzioni Agrarie e Alimentari, University of Catania, Via S. Sofia 98, 95123 Catania (CT), Italy.2Dipartimento di Scienze Agrarie, Forestali e Alimentari, University of Turin, Largo Paolo Braccini 2, 10095 Grugliasco (TO), Italy.
Received: 25 February 2014 Accepted: 14 July 2014
References
1. Lal R (2004) Soil carbon sequestration impacts on global climate change and food security. Science 30:1623–1627
2. Piccolo A, Spaccini R, Nieder R, Richter J (2004) Sequestration of a biologically labile organic carbon in soils by humified organic matter. Clim Change 67:329–343
3. Nardi S, Muscolo A, Vaccaro S, Baiano S, Spaccini R, Piccolo A (2007) Relationship between molecular characteristics of soil humic fractions and glycolytic pathway and Krebs cycle in maize seedlings. Soil Biol Biochem 39:3138–3146
4. Canellas LP, Zandonadi DB, Busato JG, Baldotto MA, Simoes ML, Martin-Neto L, Facanha AR, Spaccini R, Piccolo A (2008) Bioactivity and chemical characteristics of humic acids from tropical soils sequence. Soil Sci 173:624–637
5. Nebbioso A, Piccolo A (2009) Molecular rigidity and diffusivity of Al3+and
Ca2+humates as revealed by NMR spectroscopy. Environ Sci Technol 43:2417–2424
6. Nègre M, Boursier C, Abbate C, Baglieri A, Gennari M (2008) Use of soil colloids to evaluate adsorption of phenanthrene and its mobilization by different solutions. J Environ Sci Health A 43:443–451
7. Baglieri A, Abbate C, Borzì D, Gennari M (2009) Adsorption of pyrimethanil on soil and some of its colloids. Fresenius Environ Bull 18:578–584 8. Hayes MHB, Swift RS, Wardle RE, Brown JK (1975) Humic materials from an
organic soil: a comparison of extractant and of properties of extracts. Geoderma 13:231–245
9. Swift RS (1996) Organic matter characterisation. In: Methods of soil analysis. Part 3. Chemical methods. Soil Science Society of America and American Society of Agronomy, Madison, pp 1011–1069
10. Piccolo A, Conte P (2000) Molecular size of humic substances.
Supramolecular associations versus macromolecular polymers. Adv Environ Res 3:508–521
11. Sutton B, Sposito G (2005) Molecular structure in soil humic substances. Environ Sci Technol 39:9009–9015
12. Brigante M, Zanini G, Avena M (2007) On the dissolution kinetics of humic acid particles: effects of pH, temperature and Ca2+concentration. Colloids
Surf A: Physicochem Eng Aspects 294:64–70
13. Choudhri MB, Stevenson FJ (1957) Chemical and physicochemical properties of soil humic colloids: III. Extraction of organic matter from soil. Soil Sci Soc Am Proc 21:508–513
14. Gascho GJ, Stevenson FJ (1968) Improved method for extracting organic matter from soil. Soil Sci Soc Am Proc 32:117–119
15. Nègre M, Vindrola D, Spera S, Ferraris L, Gennari M (2002) Effect of the chemical composition of soil humic acids on their viscosity, surface pressure and morphology. Soil Sci 167:636–651
16. Sanders JKM, Hunter BK (1993) Modern NMR spectroscopy: a guide for chemists, 2nd edn. Oxford University Press, New York
17. Mehra OP, Jackson ML (1960) Iron oxide removal from soils and clays by a dithionite-citrate system buffered with sodium bicarbonate. Clays and Clay Minerals 7:317–327, Proceedings of the 7th National Conference on Clays and Clay Minerals, Washington, DC
18. Piccolo A (1988) Characteristics of soil humic extracts obtained by some organic and inorganic solvents and purified by HCl-HF treatment. Soil Sci 146:418–426
19. Perdue EM (1985) Acidic functional groups of humic substances. In: Aiken GR, McKnight DM, Wershaw RL, McCarthy P (eds) Humic substances in soil, sediment, and water: geochemistry, isolation and characterization. Wiley, New York, pp 493–526
20. Stevenson FJ (1994) Extraction, fractionation, and general chemical composition of soil organic matter. In: Stevenson FJ (ed) Humus chemistry. Genesis, composition, reactions. Wiley, New York, pp 26–54
21. Hatcher PG, Schnitzer M, Dennis LW, Maciel GE (1981) Aromaticity of humic substances in soils. Soil Sci Soc Am J 45:1089–1094
22. Schnitzer M, Preston CM (1986) Analysis of humic acids by solution and solid-state carbon-13 nuclear magnetic resonance. Soil Sci Soc Am J 50:326–331 23. Mao JD, Hu WG, Schmidt-Rohr K, Davies G, Ghabbour EA, Xing B (2000)
Quantitative characterization of humic substances by solid-state carbon-13 nuclear magnetic resonance. Soil Sci Soc Am J 64:873–884
24. Yanagi Y, Tamaki H, Otsuka H, Fujitake N (2002) Comparison of
decolorization by microrganisms of HA with different C-13 NMR properties. Soil Biol Biochem 34:729–733
25. Spaccini R, Mbagwu JSC, Conte P, Piccolo A (2006) Changes of humic substances characteristics from forested to cultivated soils in Ethiopia. Geoderma 132:9–19
26. Piccolo A, Conte P, Spaccini R, Mbagwu JSC (2005) Influence of land use on the characteristics of humic substances in some tropical soils of Nigeria. Eur J Soil Sci 56:343–352
27. Saab SD, Martin-Neto L (2007) Condensed aromatic rings and E4/E6 ratio: humic acids in gleysoils studied by NMR CP/MAS C-13 and dipolar dephasing. Quim Nova 30:260–263
28. Forte C, Piazzi A, Pizzanelli S, Certini G (2006) CP MAS13C spectral editing and relative quantitation of a soil sample. Solid State Nucl Mag 30:81–88
29. Mathers NJ, Xu Z, Berners-Price J, Senake Perera MC, Saffigna PG (2002) Hydrofluoric acid pre-treatment for improving13C CPMAS NMR spectral
quality of forest soils in south-east Queensland, Australia. Aust J Soil Res 40:655–674
30. Piccolo A, Campanella L, Petronio BN (1990) Carbon-13 nuclear magnetic resonance spectra of soil humic substances extracted by different mechanisms. Soil Sci Soc Am J 54:750–756
31. Stevenson FJ (1982) Humus chemistry: genesis, composition, reactions. Wiley, New York
32. Francioso O, Ciavatta C, Montecchio D, Tugnoli V, Sàncez-Cortés S, Gessa C (2003) Quantitative estimation of peat, brown coal and lignite humic acids using chemical parameters,1H-NMR. Bioresource Technol 88:189–195
33. van der Marel HW, Beutelspacher H (1976) Atlas of infrared spectroscopy of clay minerals and their admixtures. Elsevier, Amsterdam
34. Madejovà J, Komadel P (2001) Baseline studies of the clay minerals society source clay: infrared methods. Clay Clay Mineral 49:410–432
35. Vinkler P, Lakatos B, Meisel J (1976) Infrared spectroscopic investigation of humic substances and their metal complexes. Geoderma 15:231–242 36. Piccolo A, Stevenson FJ (1982) Infrared spectra of Cu2+, Pb2+, and Ca2+
complexes of soil humic substances. Geoderma 27:195–208
37. Inoue K, Huang PM (1985) Influence of citric acid on the formation of short-range ordered aluminosilicates. Clay Clay Mineral 33:312–322 38. Inoue K, Huang PM (1990) Perturbation of imogolite formation by humic
substances. Soil Sci Soc Am J 54:1490–1497
39. Bartoli F, Philippy R, Portal JM, Gerard B (1992) Poorly ordered Fe oxides, colloidal dispersion and soil aggregation. I. Effect of humic macromolecules on surface and colloidal properties of Fe(III) polycations. J Soil Sci 43:47–58 40. Leone P, Nègre M, Gennari M, Boero V, Celis R, Cornejo J (2001) Adsorption
41. Cornejo J (1987) Porosity evolution of thermally treated hydrous ferric oxide gel. J Colloid Interf Sci 115:260–263
42. Hsu PH (1989) Aluminum hydroxides and oxyhydroxides. In: Dixon JB, Weed SB (eds) Minerals in soil Environments, SSSA Book Series: 1. Soil Science Society of America, Madison, pp 331–378
43. De Cristofaro A, He JZ, Zhou DH, Violante A (2000) Adsorption of phosphate and tartrate on hydroxy-aluminum-oxalate precipitates. Soil Sci Soc Am J 64:1347–1355
44. Watanabe A, Takada H (2006) Structural stability and natural13C abundance
of humic acids in buried volcanic ash soil. Soil Sci Plant Nutr 52:145–152 45. Tombacz E, Gilde M, Abraham I, Sza’nto’F (1988) Effect of electrolyte
concentration on the interaction of humic acid and humate with montmorillonite. Appl Clay Sci 3:31–52
46. Schulthess CP, Huang CP (1991) Humic and fulvic acid adsorption by silicone and aluminium oxide surfaces on clay minerals. Soil Sci Soc Am J 55:34–42
47. Elfarissi F, Pefferkorn M (2000) Kaolinite: humic acid interaction in the presence of aluminium ion. Colloids Surf A 168:1–12
48. Tombacz E, Libor Z, Illes E, Majzik A, Klump E (2004) The role of reactive surface sites and complexation by humic acids in the interaction of clay mineral and iron oxide particles. Org Geochem 35:257–267
49. Nègre M, Leone P, Trichet J, Defarge C, Boero V, Gennari M (2004) Characterization of model soil colloids by cryo-scanning electron microscopy. Geoderma 121:1–16
50. Feng X, Simpson AJ, Simpson M (2005) Chemical and mineralogical controls on humic acid sorption to clay mineral surfaces. Org Geochem 36:1563–1566
51. Wada SI, Wada K (1980) Formation, composition and structure of hydroxy-aluminosilicate ions. J Soil Sci 31:457–467
52. Yong R, Mourato ND N (1990) Influence of polysaccharides on kaolinite structure and properties in a kaolinite-water system. Can Geotechnical J 27:774–788
53. Powell HJK, Fenton E (1996) Size fractionation of humic substances: effect on metal binding properties. Anal Chim Acta 334:27–38
54. Klucakova M, Peka M (2008) Behaviour of partially soluble humic acids in aqueous suspensions. Colloids Surf A 318:106–110
55. Christensen JJ, Hansen LD, Izatt RM (1976) Handbook of proton ionization heats and related thermodynamic quantities. Wiley, New York
56. Martell AE, Smith RM (1977) Critical stability constants: Other organic ligands, vol 3. Plenum, New York
57. Terashima M, Fukushima M, Tanaka S (2004) Influence of pH on the surface activity of humic acid: micelle-like aggregate formation and interfacial adsorption. Colloids Surf A 247:77–83
58. Alvarez-Puebla RA, Garrido JJ (2005) Effect of pH on the aggregation of a gray humica acid in colloidal and solid states. Chemosphere 59:659–667 59. Klucakova M, Peka M (2005) Solubility and dissociation of lignitic humic
acids in water suspension. Colloids Surf A 252:157–164
doi:10.1186/s40538-014-0009-x
Cite this article as:Baglieriet al.:Chemical and spectroscopic characterization of insoluble and soluble humic acid fractions at different pH values.Chemical and Biological Technologies in Agriculture 20141:9.
Submit your manuscript to a
journal and benefi t from:
7Convenient online submission
7Rigorous peer review
7Immediate publication on acceptance
7Open access: articles freely available online 7High visibility within the fi eld
7Retaining the copyright to your article