ORIGINAL ARTICLE DOI 10.1007/s10086-004-0659-6
M. Eikenes (*) · G. Alfredsen · H. Solheim
Norwegian Forest Research Institute, Høgskoleveien 12, N-1432 Ås, Norway
Tel. 47-64-94-9170; Fax 47-64-94-2980 e-mail: morten.eikenes@skogforsk.no B.E. Christensen
Department of Biotechnology, Norwegian University of Science and Technology, N-7491 Trondehim, Norway
H. Militz
Institute of Wood Biology and Wood Technology, University of Göttingen, Büsgenweg 4, D-37077 Göttingen, Germany
Morten Eikenes · Gry Alfredsen · Bjørn Erik Christensen Holger Militz · Halvor Solheim
Comparison of chitosans with different molecular weights as possible wood
preservatives
Received: November 10, 2003 / Accepted: June 7, 2004
Abstract Fungi cause serious problems in wood utilization,
and environmentally benign wood protection is required as an alternative to traditional chemicals. Chitosan has shown promising antimicrobial properties against several micro-organisms. In this study, we present the characterization of and antifungal properties of a commercial chitosan formu-lation developed for impregnation of wood. A broad range of chemical and mycological methods were used to evaluate the uptake, fixation, and antifungal properties of chitosan for wood preservation. The results show that the higher the uptake of chitosan the lower the relative recovery of chitosan in wood after leaching, and the higher the molecu-lar weight of chitosan the higher the recovery. Chitosan with high molecular weight proved to be more efficient against decay fungi than chitosan with low molecular weight. The fungi tested on chitosan-amended nutrient agar medium were totally inhibited at 1% (w/v) concentration. In decay studies using small wood blocks, 4.8% (w/v) chitosan concentration gave the best protection against brown rot fungi.
Key words Antifungal activity · Chitosan · Decay fungi ·
Impregnation · Molecular weight
Introduction
There has been enhanced focus from environmental organisations, consumers, and governments on
environ-mentally sustainable treatments of wood for preservation against wood-decaying organisms, due to the fact that use of traditional preservatives containing chromium and arsenic has been banned in several European countries and the USA. Application of fungicides is the most widely used method to control fungal decay in wood. However, chemi-cal control may induce biocide resistance in fungi and there are also health risks to consider when using fungicides. Thus, there is a growing need to develop antifungal chemi-cals that are not toxic to humans and the surrounding environment.
Chitin, a 1–4 linked polymer of 2-acetamido-2-deoxy-
-d-glucose, is the most abundant natural nitrogen-containing
polysaccharide and its annual production is estimated to be
almost as much as cellulose.1
It has been estimated that chitin is synthesized in nature at a level of up to 1–10 billion
tonnes per year.2
The major source of chitin is crustacean shells, which are a by-product of the seafood refining indus-try, although chitin is also found in the skeletons of several
insects and in the cell walls of several fungi.3 Chitosan is
partially deacetylated chitin and is mainly produced from
chitin by hydrolysis of the amide C-N bond by strong alkali.4
In contrast to chitin, which is completely insoluble in water, chitosans are generally water soluble under acidic
condi-tions, and chitosans with FA (fraction of N-acetylated
residues) of around 0.5 are also soluble under alkaline
conditions.5,6
Because chitosans are derived from a natural product, they vary in both relative content of the
mono-mers, i.e., FA and in molecular size of the polymer (average
molecular weight).
The antifungal activity of chitosan has been documented
by several authors, e.g., Allan and Hadwiger,3 Reddy et al.,7
Benhamou and Theriault,8
Roller and Covill,9
and Li and
Yu.10
Much interest in the antimicrobial properties of chitosans is focused on its possible role in plant protection. It has also been claimed that chitosans may act as elicitors of
defensive metabolism in pines.11
However, there are only a few reports describing its antifungal activity against forest
pathogenic fungi and wood-decaying fungi.12–15
In general, chitosans are believed to act both as fungistatic agents and
as fungicides at higher concentrations.7
demonstrated that chitosan is not only effective in re-ducing the radial growth of fungi, but also induces severe morphological and ultrastructural changes in the fungi. The precise mechanisms by which chitosans exert their antifun-gal activities are not yet elucidated and a number of hypoth-eses have been suggested over the years. At least two concepts have been presented to explain the mode of action of chitosans:
1. Chitosan, which is a polycationic polymer, interferes with the charged phospholipids in the fungal cell wall membranes, causing alterations in the permeability of the membrane. Such an interaction would trigger
internal osmotic imbalances,16,17
and cause leaching of electrolytes and proteins from the fungus leading to pronounced cell disorganization and ultimately to
plasmolysis.7,12,18
2. Chitosan may enter the fungal cell, interact with DNA and alter its conformation, thus inhibiting the synthesis
of mRNAs and proteins.19
Jung et al.20
and Shin et al.21
showed that the effect of chitosans on microbial activi-ties does not always reveal a linear dose–response curve. For some species, microbial activities did not change much even at higher concentrations after reaching a stable state of inhibition.
Several authors claim that all fungi, except those con-taining chitosan as a major cell wall compound, i.e.,
Zygo-mycetes, are vulnerable to chitosan.3,17
Other authors9,18
have questioned this generalization given results of antifun-gal activity also among Zygomycetes.
The electrostatic interaction between chitosan and the negatively charged surface cellulose is important for the
adsorption of chitosan to cellulose. Roberts22
reported that there is a positive correlation of both pH and the degree of acetylation of chitosan with the adsorption of chitosan to wood. The pH at maximum adsorption of chitosan to
wood22
was used by Frederiksen14
in an attempt to fixate chitosan in wood, which was, however, unsuccessful.
Kobayashi and Furukawa23 studied the formation of
chitosan-metal salts and their fixation in wood. Chitosan has been tested both as a pretreatment before impregnation
with chrome–copper–arsenic (CCA) salts24,25
and in
combi-nation with zinc or copper.26
The mass loss in Cryptomeria japonica treated with 0.6% CCA had a mass loss of 12.8% after a 3-month exposure to
Tyromyces palustris. This was reduced to a mass loss of
1.7% by pretreatment with chitosan.25 In a study using
scanning electron microscopy with wave dispersive X-ray analysis (SEM-WDX), it was found than chitosan formed a membrane at the lumen surfaces in chitosan-treated C.
japonica. Furthermore, the absorption of CCA was greater
for samples pretreated with chitosan than for samples
with-out chitosan pretreatement.24,25
Weathering did not easily remove the CCA elements from the chitosan membrane
and the cell walls.24
In this study we present a commercial product developed for wood preservation based on chitosan. The main objec-tive of this work has been to evaluate the efficacy of this chitosan formulation for wood preservation with varying
average molecular weights and concentrations. Focus was put on impregnation studies, uptake and leaching of chitosan, and fungal assays of wood treated with chitosan.
Materials and methods
Chitosan solutions
Four aqueous 5% (w/v) solutions of commercial chitosan products (M302–M305), with additives for fixation as
de-scribed by Mikalsen et al.,27
were provided by Multimar AS (Haugesund, Norway). The chitosan in the solutions was of different molecular weight (MW), M302 having the highest MW, and M305 the lowest MW. The solutions were diluted with tap water to 2.5% (w/v) and 1% (w/v). The pH of each solution used for impregnation was determined with a Sentron pH Meter (Type Argus, Sentron Red-Line probe) using a two-point calibration.
The molecular weight distributions were analyzed by size-exclusion chromatography combined with on-line multiangle light scattering as described by Fredheim and
Christensen.28
The chemical compositions of the chitosans
where determined by 1
H nuclear magnetic resonance
(NMR) spectroscopy as described by Vårum et al.5
Preparation and impregnation of wood samples
Wood samples were prepared from Scots pine (Pinus
sylvestris L.) sapwood. All samples were dried at 103°C for
18 h before the initial dry weight was recorded. For each
treatment, 50 miniblock samples of 10 5 30 mm29
were randomly selected and impregnated by placing the samples in the impregnation solution and applying 4 kPa (30 Torr) vacuum for 30 min followed by 0.8 MPa (6000 Torr) pres-sure for 2 h. The weight of each wood sample after impreg-nation was recorded. The samples were stored at 65% relative humidity and 22°C for 4 weeks until further use. Eight miniblock samples for each treatment were then analyzed for uptake of chitosan.
Leaching of impregnated wood samples
Twenty-four wood samples for each treatment, including control samples (water-impregnated), were placed in
sepa-rate test tubes of 16 150 mm with a 10-mm glass sphere on
irradiation of 25 Gy at the Institute for Energy Technology at Kjeller, Norway.
Quantification of chitosan in wood and water samples
Both wood and water samples were analyzed for the con-tent of chitosan by a method described by Eikenes et al. (Eikenes, 2004, personnal communication). The wood samples were ground in a Retch mill to fine wood powder. Each ground wood sample (100 mg) was hydrolyzed by 1.5 ml of 6 M hydrochloric acid in a 2-ml centrifuge tube for 64–70 h, and then filtered and stored at 4°C until further use. For each water sample, 0.5 ml was transferred to a 2-ml centrifuge tube and 1.0 ml of 9 M hydrochloric acid was added. The sample was then hydrolyzed at 100°C for 24 h, diluted with deionised water, and stored at 4°C until further use. An appropriate internal standard was used for all samples. The hydrolyzed samples containing glucosamine were then analysed by high performance liquid chromatog-raphy (HPLC) with fluorimetric derivatization and detec-tion. The results of the chemical analysis expressed in micromoles per liter were converted to mass of chitosan by
the use of an average molar mass of 170.4 g mol1, based on
an assumption that the fraction of N-acetylated residues
(FA) was 0.22.
Growth rate on chitosan-supplemented media
Fungi used in the experiments were (1) Poria placenta (Fries) Cook sensu J. Eriksson. (FPRL 280) – Basidi-omycete – brown rot, (2) Coniophora puteana (Schumacher ex Fries) Karsten (BAM Ebw. 15) – Basidiomycete – brown rot, and (3) Coriolus versicolor (Linnaeus) Quélet (CTB 863 A) – Basidiomycete – white rot. The stock solutions of chitosan (M302–M305) were added to sterile molten 4% (w/ v) malt extract-agar medium (MA) to obtain the final con-centrations of each solution at 0.01%, 0.1%, and 1% (w/v). For each fungus, chitosan solution, and chitosan concentra-tion, five standard 9-cm Petri dishes containing 20 ml chitosan-supplemented medium were inoculated with a 3-mm fungal plug. The dishes were sealed with parafilm and incubated in the dark at 21°C. For each fungus, five dishes of plain malt agar were used for control. The radial growth rates in four directions were recorded daily until the con-trols reached the edge of the dish. Growth inhibition was recorded as the reduction in fungal growth in chitosan-amended plates compared with the control. The antifungal activity (AFA) was expressed as the growth rate of the respective fungus on chitosan-supplemented medium rela-tive to the fungal growth in the control dish:
AFA %
(
)
[
(
GC - GT GC)
]
100where GC is the hyphal growth (mm) on the control medium without test solution and GT is the hyphal growth (mm) on the test medium.
Miniblock assay
Petri dishes (diameter 9 cm, height 2 cm) containing 20 ml 4% (w/v) malt agar were inoculated with P. placenta or C.
puteana, two brown rot fungi recommended by van Acker
et al.30 A plastic mesh was used to separate the samples from
direct contact with the media, and each dish contained one treated and one untreated control sample. Six replicates for each impregnation and fungus were used. For each chitosan treatment, six Petri dishes containing one treated and one untreated wood sample on media without fungi were in-cluded to obtain correction values for calculation of mass
loss as described in EN113.31
For both fungi, four Petri dishes containing two untreated wood samples were in-cluded to measure the viability of the fungal strains. The incubation time was 8 weeks at 22°C and 65% relative humidity. Calculations of decay (mass loss) and water
con-tent after decay were performed as described in EN113.31
Results
Chitosan solutions
Initial experiments indicated that the samples were highly aggregated. They were therefore diluted and subjected to ultracentifugation prior to analysis by size-exclusion chro-matography combined with multiangle light scattering (SEC-MALLS). The SEC concentration profiles [refractive index (RI) detection] gradually shifted to higher elution
volumes in the order M302 M303 ⬇ M304 M305,
reflecting the decrease in molecular weight which follows from increasing extents of depolymerization (Fig. 1). Furthermore, the profiles are quite broad, reflecting the polydispersity of the samples (Table 1).
The molecular weight at each point (Mi) of the elution
curve was calculated on the basis of the combined detector outputs using the standard Zimm equation:
Kc
R M A c
i
i i
i
1 2 2
3
1.0x10
4
1.0x10
5
1.0x10
6
1.0x10
7
1.0x10
15 20 25 30 35
Mol
a
r Mas
s (g
/m
ol
)
Volume (mL) Molar Mas s vs . Volume
1703__09 Standar d 1 ( Cl 213) 1703__10 Standar d 2 ( Cl 113) 1703__03 Sample 302 1703__04 Sample 303 1703__05 Sample 304 1703__06 Sample 305
where ci is the concentration (given by the RI detector), Ri
is the Rayleigh factor extrapolated to zero angle, and K is the optical constant.
The calculated Mi values are included in Fig. 1. For
per-fectly dispersed chains of the same type, only differing in molecular weight, all data should ideally fall on a single line, corresponding to the calibration curve obtained with mono-disperse standards. It was indeed observed that the two chitosan standards, that were included in the analysis for comparison, behaved normally by having totally overlap-ping curves. However, the samples M302–M305 generally
showed Mi curves that were nonlinear, and to various
ex-tents shifted to higher molecular weights. Such behavior may be attributed to the presence of contaminants or aggre-gates which contribute with additional scattering. To com-pensate for this behavior, further calculations for samples M302–M305 were performed on the basis of the calibration curve obtained with the chitosan standards. Samples M303– M305 showed small but distinct peaks eluting near the exclusion limit. It is assumed these peaks are due to contaminating material and were not included in the calculations.
The weight average MW of the chitosans varied from 215 k dalton for M302 to 35 k dalton for M305 (Table 1). The pH was 3.0 for the 5% solutions, 3.3–3.4 for the 2.5% solutions, and 3.5–3.6 for the 1% solutions (Table 1). The
fraction of N-acetylated residues (FA) was 0.22 for all
samples, corresponding to a degree of de-N-acetylation of 78%. The chitosan concentrations in the impregnation solu-tions were determined by chemical analysis and ranged from 4.8% (w/v) for 5% M303 to 0.7% (w/v) for 1% M304 (Fig. 2). The 2.5% dilutions of M302–M305 all contained chitosans in the range of lay 2.1%–2.3% (w/v). The 5% M304 dilution was determined to contain 3.8% (w/v) chitosans.
Uptake and leaching
The higher the concentration of chitosan in the impregna-tion soluimpregna-tions (Fig. 2) the higher the concentraimpregna-tion of chitosan in impregnated wood (Fig. 3). The chitosan con-tent in the wood samples after leaching show that higher content of chitosan in wood resulted in more chitosan in wood after leaching than did low content (Fig. 3). However, the relative recovery of chitosan after leaching (content of
chitosan in wood after leaching divided by content before leaching) decreased with increasing content of chitosan in the wood samples (data not shown). For the high concentra-tions (5% M303 and 5% M304) the recovery was approxi-mately 60%, while for the low concentrations (1% M303
Table 1. Results from the 1H nuclear magnetic resonance spectroscopy and size-exclusion chro-matography with multiangle light scattering for the chitosans M302–M305 and pH measurements of the impregnation solutions of M302–M305 at 5%, 2.5%, and 1% (w/v) concentration Chitosan Fraction of N-acetylated MW Mn Polydispersity pH
a
solution residues (FA) (daltons) (daltons) Mw/Mn
5% 2.5% 1%
M302 0.22 215 k 93 k 2.3 – 3.3 –
M303 0.22 70 k 41 k 1.7 3.0 3.4 3.5
M304 0.22 67 k 37 k 1.8 3.0 3.4 3.6
M305 0.22 35 k 24 k 1.5 – 3.4 –
aM302 and M305 were tested only at 2.5% concentration
Fig. 2. Chitosan concentration (% w/v) in the chitosan solutions used for impregnation of wood samples (n 3, 1 SD)
and 1% M304) the recovery rates were approximately 90%. For the 2.5% solutions, the recovery rates decreased with decreasing MW.
Fungus tests
All the fungi were totally inhibited in agar plates supple-mented with 1% chitosan solutions (Fig. 4). Poria placenta and Coniophora puteana were totally inhibited using 0.1%
M302 and P. placenta was also inhibited with 0.1% M303. The chitosan solutions showed a tendency of decreasing antifungal activity (AFA) with decreasing MW. M304 showed the lowest AFA of all three fungi both for the 0.1% and 0.01% concentrations. The 0.01% concentration gener-ally made a minor impact on the growth rate. The 0.1% solution of M304 and all chitosan solutions at 0.01% con-centration showed negative growth inhibition effects on
C. puteana.
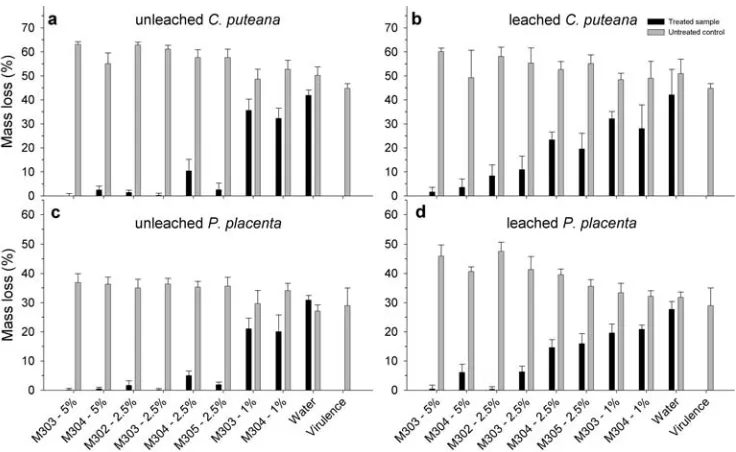
Coniophora puteana caused more decay in the samples
than P. placenta; the average mass loss of the virulence samples of C. puteana was 44.7% while for P. placenta the average mass loss was 28.9%. The untreated control samples showed a slightly higher decay rate than the viru-lence samples. Mean mass loss with C. puteana was 53.1% for the leached control samples and 57.0% for the unleached control samples (Fig. 5). For P. placenta the mean mass loss for leached control samples was 40.1% and 36.4% for unleached control samples (Fig. 5). Generally, there was an inverse correlation between the decay rate of the treated samples and the untreated control samples.
There was a common effect of all chitosan formulations at all concentrations tested on wood-decaying fungi. For the unleached chitosan-treated samples at 5% and 2.5%, the decay caused by both fungi was below 5% mass loss, except for the 2.5% concentration of M304 where the mass loss was slightly higher. The M302, M303, and M305 solutions at 2.5% and M303 and M304 solutions at 5% concentration inhibited the decay to below 3% mass loss for both fungi,
which according to EN11331
is acceptable for wood pre-servatives. For the leached samples, the decay was more
Fig. 4. Reduction in colony size for three concentrations of chitosan solutions. Black bars for Poria placenta, gray bars for Coniophora puteana, and white bars for Coriolus versicolor
Fig. 5. Decay results as average mass loss (n 6) after 8 weeks incuba-tion time at 22°C and 70% relative humidity for a Coniophora puteana on unleached wood samples, b C. puteana on leached wood samples, c Poria placenta on unleached wood samples, and d P. placenta on
severe. M302 performed best among the solutions at 2.5% concentration. Both 5% solutions showed low decay after leaching, but again the best results were obtained by 5% M303. Mass loss was 1.6% using C. puteana and 0.1% using
P. placenta. M304 at 5% concentration resulted in 3.5%
mass loss with C. puteana and 6.8% mass loss using P.
placenta. The 1% solutions showed only limited effects on
the decay rate caused by the fungi. The average moisture content relative to dry weight for all samples decayed by fungi (both leached and unleached) was above 30% (Fig. 6). For P. placenta (Fig. 6b), all leached and unleached samples were below 80% moisture content, except for both the unleached samples treated with 1% concentrations of M303 and M304. For C. puteana (Fig. 6a), all leached chitosan-treated samples were below 80% water content after decay. The virulence samples had 92.8% water content, and water-impregnated control samples with and without leaching had 83.4% and 85.1% water content, respectively. The unleached samples treated with 2.5% and 5% chitosan had water content after fungal decay with C. puteana between 90.8% and 128.3% (Fig. 6). The 1% unleached samples of M303 had 74.4% moisture and M304 had 88.3%.
The impregnated samples, which were placed on agar without fungi during the decay period, had an average water content for all leached and unleached samples slightly above 30%, except for the unleached M303 and M304
samples that, for the 5% concentration, had just above 60% water content.
Discussion
The higher the concentration of chitosans in a solution, the higher the viscosity of the solution becomes, and it becomes more difficult to dissolve the chitosans. Therefore we lim-ited the highest concentrations of chitosan in this study to 5% (w/v).
The results of uptake of chitosan in wood are well corre-lated with the concentration of chitosan in the impregnation solutions. There is no indication that there are any differ-ences in penetration for these small samples with regard to MW. However, preliminary results with larger wood samples show that there is a gradient in the penetration of chitosan with high MW during impregnation (Eikenes, 2004, personal communication).
The chitosan solutions had a very broad range of average MW. The results clearly show that the chitosan with high MW are superior to lower-MW chitosan for impregnation solutions due to the fact that they tend to fixate better in wood, and hence prevent leaching during service. There is a positive correlation between the total amounts of chitosan in the leaching water samples and the difference in uptake versus recovery of chitosan. This verifies that the choice of method was suitable for quantification of chitosan.
The differences in relative recovery of chitosan after leaching with respect to uptake indicate that there is an interaction between the chitosan and the wood cell wall. The cell wall’s ability to interact with chitosan seems to decrease with increasing concentration. This indicates a cer-tain saturation of chitosan adsorbed to the cell wall of impregnated wood at higher concentrations of chitosan. Alternatively the fixation of chitosan may be less effective at higher concentrations due to less effective oxidation of
the sulfuric compounds to sulfates,27
which will precipitate and fixate chitosan, by oxygen in air. One possible explana-tion for this is that when the wood sample is drying the chitosan precipitates, and complete fixation of the chitosan is prevented by an air-tight coating shield of chitosan.
Decreasing fungal growth rate with increased chitosan concentration in agar plates has been observed in several
previous studies (Laflamme et al.,12
Chittenden et al.,15
El
Ghaout et al.,18
Bell et al.32
). The results showed no appar-ent difference between white rot, brown rot, and mould fungi. The effect of the 0.1% chitosan-amended media on decay fungi seems to be in accordance with the work of
Frederiksen.14
He found that this concentration totally inhibited Serpula lacrymans, and delayed growth of
Coniophora puteana and Coriolus versicolor.
Morphologi-cal changes of fungal strains on chitosan were reported
earlier by Roller and Covill,9
Laflamme et al.12
and
Chittenden et al.15
In this study, Poria placenta tended to make fewer and thicker hyphae on chitosan supplemented media and C. versicolor made denser hyphal mats than on control media with more aerial mycel.
The results from the 0.1% chitosan solutions demon-strate that the growth reduction may be a function of MW; the higher the MW the larger the reduction in growth rate. These results are the opposite of the results reported by
Chittenden et al.,15
who studied three different molecular weights of chitosan against mould and sapstain fungi. In
contrast to this, Frederiksen14
reported no differences in the results with varying MW in his studies of Aspergillus niger
growth on filter papers. Interestingly, Shin et al.21
found that chitosan with high MW was more effective in inhibiting bacterial growth on cotton fabrics than chitosan with low MW. By studying chitosan oligomers, Kendra and
Hadwiger33
reported that antifungal ability against
Fusa-rium solani increased as the oligomer MW increased. The
heptamer was on a level with high MW chitosan with regard
to antifungal ability. Matsubara and Kuroda34
reported that the elicitor activity of the chitosan hexamer and octamer had almost the same activity as commercially available chitosan.
The slight enhancement of C. puteana growth (faster growth rate than the control) was present for all chitosans at 0.01% concentrations as well as for 0.1% M304. Therefore, this is not regarded as a methodical artifact. One explana-tion is that low concentraexplana-tions of the chitosan might act as a growth promoter for C. puteana rather than as a growth inhibitor, with the chitosan and/or additives having a fertil-izing effect.
Comparison of the 2.5% solutions of the leached wood samples showed an increasing decay rate with decreasing MW. These results are supported by the agar plate growth rate study. The results from the leaching experiments also support this, because there was a positive correlation be-tween the MW and the relative recovery of chitosan after
leaching. Mehrtens13
and Frederiksen14
both tested the per-formance of chitosan by a fungal decay test. Both tested different chain lengths and fixation methods, but found no effect for either of the parameters. The lack of effect in both cases might be caused by problems with the test system or the chitosan concentrations.
Wood samples impregnated with chitosan solutions at 1% (w/v) concentration showed only a small effect in reduc-ing wood fungal decay. The results are nearly the same as those for wood samples treated with tap water. However, at higher chitosan concentrations wood treated with these chitosan solutions seems to have been very effectively pro-tected, with only minor mass loss after decay. A concentra-tion of 5% seems adequate for total protecconcentra-tion of wood against these brown rot fungi. However, further studies with larger wood samples in the laboratory and the field will have to be performed to provide results to support these effects gained from testing small samples.
Frederiksen14
found no effect of chitosan compared with the control before or after leaching, using C. puteana and C.
versicolor in a modified EN11331
test for the concentration used. The maximum concentration was 0.4% (w/v), which is approximately tenfold lower than what seems to be
neces-sary according to our results. Kobayashi and Furukawa26
found in a study using chitosan-metal salts as wood
preser-vative that retention of 11.6 kg m3
chitosan was ineffective
in controlling the growth of the brown rot fungi Tyromyces
palustris. This should resemble a 1.5%–2.0% (w/v) chitosan
solution. Concentrations of this level were also found to be insufficient to make a substantial impact on fungal growth rate in the present study.
These tests confirm that chitosan exerts some effect when impregnated in wood, even though the leaching
pro-cedure was performed according to a down-scaled EN84,35
which is a relatively rough procedure on these small samples. The decay in the virulence and untreated control samples was also significantly higher than required in
EN113,31
proving the activity of the fungi used.
The moisture content values in all the leached chitosan-treated wood samples after the fungal decay tests are within the limits of the moisture content required for fungal decay. However, some of the treatments showed significantly higher moisture content in wood for the unleached samples. This is probably due to the hygroscopic ingredients in the formulation that assists in fixating chitosan in wood. Some samples, like the 1% treatment, water-treated, and viru-lence samples, showed relatively high moisture contents and also high degrees of decay. The high moisture content
itself can also be a result of the decay process. Shin et al.21
also found that the moisture gain increased as the treatment concentration and the MW of the chitosan were increased. Their explanation was that this was due to the amino and hydroxyl groups, which provide reactive sites for moisture. Furthermore, a coating of chitosan of high MW on the surface of the cotton fibers made it easier for water mol-ecules to approach reactive sites.
In conclusion, results of the decay tests and leaching experiments showed that a 5% solution of high-MW chitosan was adequate for preserving the small miniblock samples. However, further work needs to be done to test whether this is also valid for larger samples and longer exposure time in the field. An improvement of the fixation process will further enhance the properties of chitosan-impregnated wood exposed to leaching in water.
The differences in an effective concentration between the growth rate in agar plates and decay studies using solid wood were as expected. An inhibition of radial growth of fungi or a reduction of sporulation point to a biocidal action of chitosan; however, they do not provide an answer to the fungal ability to degrade impregnated wood.
Acknowledgments The authors thank Sigrun Kolstad, Monica Fongen, Gabriele Remedios, and Eva Grodås for their laboratory work, Ivar Feste for providing the wood samples, and MultiMar AS for providing chitosan solutions. Nicholas Clarke is thanked for revising the English. The Research Council of Norway is gratefully acknowl-edged for providing funding for this work. The cooperation between Skogforsk and The University of Göttingen was supported by the “Project based personnel exchange program between Germany (DAAD) and Norway (NFR).”
References
2. Ratajska M, Struszczyk M, Boryniec S, Peter M, Loth F (1997) The degree of deacetylation of chitosan: optimization of the IR method. Polimery 42:572–575
3. Allan CR, Hadwiger LA (1979) The fungicidal effect of chitosan on fungi of varying cell wall composition. Exp Mycol 2:285–287 4. Mima S, Miya M, Iwamoto R, Yoshikawa S (1983) Highly
deacetylated chitosan and its properties. J Appl Polym Sci 28:1909– 1917
5. Vårum K, Anthonsen M, Grasdalen H, Smidsrød O (1991) Deter-mination of the degree of acetylation and the distribution of N-acetyl groups in partially N-deN-acetylated chitins (chitosans) by high-field NMR. spectroscopy. Carbohydr Res 211:17–23 6. Vårum K, Ottøy M, Smidsrød O (1994) Water-solubility of
partially N-acetylated chitosans as a function of pH: effect of chemical composition and depolymerisation. Carbohydr Polym 25:65–70
7. Reddy MVB, Arul J, Ait-Barka E, Angers P, Richard C, Castaigne F (1998) Effect of chitosan on growth and toxin production by Alternaria alternate f. sp. Lycopersici. Biocontrol Sci Technol 8:33– 43
8. Benhamou N, Theriault G (1992) Treatment with chitosan en-hances resistance of tomato plants to the crown and root rot patho-gen Fusarium oxysporum f. sp. radicis-lycopersici. Physiol Mol Plant Pathol 41:33–52
9. Roller S, Covill N (1999) The antifungal properties of chitosan in laboratory media and apple juice. Int J Food Microbiol 47:67–77 10. Li HY, Yu T (2001) Effect of chitosan on incidence of brown rot,
quality and physiological attributes of postharvest peach fruit. J Sci Food Agric 81:269–274
11. Miller R, Berryman A, Ryan C (1986) Biotic elicitors of defence reactions in lodgepole pine. Phytochemistry 25:611–612
12. Laflamme P, Benhamou N, Bussires G, Dessureault M (1999) Dif-ferential effect of chitosan on root rot fungal pathogens in forest nurseries. Can J Bot 77:1460–1468
13. Mehrtens S (1999) Untersuchungen zur Schutzwirkung von Chitosan gegenüber Holzpilzen. (In German) Diplom-Holzwirt Thesis, Universität Hamburg, Germany, p 111
14. Frederiksen O (2001) Fungicid fra rejer. (In Danish) Nordic Wood Project P99088, p 29
15. Chittenden C, Wakeling R, Kreber B (2003) Growth of two se-lected sapstain fungi and one mould on chitosan amended nutrient medium. The International Research Group of Wood Preserva-tion, IRG/WP 03–10466, p 10
16. Kauss H, Jeblick W, Domard A (1989) The degrees of polymeriza-tion and N-acetylapolymeriza-tion of chitosan determine its ability to elicit callose formation in suspension cells and protoplasts of Catharanthus roseus. Planta 178:385–392
17. Leuba JL, Stössel P (1986) Chitosan and other polyamines: anti-fungal activity and interaction with biological membranes. In: Muzzarelli R, Jeauniaux C, Gooday GW (eds) Chitin in nature and technology. Plenum, New York, pp 215–222
18. El Ghaouth A, Arul J, Grenier J, Asselin A (1992) Effect of chitosan and other polyions on chitin deacetylase in Rhizopus stolonifer. Exp Mycol 16:173–177
19. Hadwiger LA, Loschke DC (1981) Molecular communication in host–parasite interactions: hexosamine polymers (chitosan) as regulator compounds in race-specific and other interactions. Phy-topathology 71:756–762
20. Jung BO, Kim CH, Choi KS, Lee YM, Kim JJ (1999) Preparation of amphiphilic chitosan and their antimicrobial activities. J Appl Polym Sci 72:1713–1719
21. Shin Y, Yoo DI, Jang J (2001) Molecular weight effect on antimi-crobial activity of chitosan treated cotton fabrics. J Appl Polym Sci 80:2495–2501
22. Roberts GAF (1992) Chitin chemistry. Macmillan, London, p 352 23. Kobayashi T, Furukawa I (1995) Optimum conditions for the formation of chitosan-metal salts and their fixation in wood (in Japanese). J Antibact Antifung Agents 23:263–269
24. Lee J-S, Furukawa I, Sakuno T (1992) Microdistribution of ele-ments in wood after pretreatment with chitosan and impregnation with chrome–copper–arsenic preservative (in Japanese). Mokuzai Gakkaishi 38:186–192
25. Lee J-S, Furukawa I, Sakuno T (1993) Preservative effectiveness against Tyromyces palustris in wood after pretreatment with chitosan and impregnation with chromated copper arsenate (in Japanese). Mokuzai Gakkaishi 39:103–108
26. Kobayashi T, Furukawa I (1995) Wood-preserving effectiveness of chitosan-metal salts against wood decaying fungi. J Antibact Antifung Agents 23:343–348
27. Mikalsen M, Ørstavik A, Falck R, Steinstø E (2001) Preservative composition and kit and method for its production and use. Norwe-gian Patent Application No. 20013007
28. Fredheim GE, Christensen BE (2003) Polyelectrolyte complexes: interactions between lignosulfonate and chitosan. Biomacromol 4:232–239
29. Bravery AF (1979) A miniaturised wood-block test for the rapid evaluation of wood preservative fungicides. Swedish Wood Preser-vation Institute, Stockholm, p 136
30. van Acker J, Stevens M, Carey J, Sierra-Alvarez R, Militz H, Le Bayon I, Kleist G, Peek RD (2003) Biological durability of wood in relation to end use. Part 1: towards a European standard for labo-ratory testing of the biological durability of wood. Holz Roh Werkst 61:35–45
31. EN113 (1996) Wood preservatives – test method for determining the protective effectiveness against wood destroying basidi-omycetes – determination of toxic values. European Committee for Standardization (CEN), Brussels, Belgium
32. Bell AA, Hubbard JC, Liu L (1998) Effects of chitin and chitosan on the incidence and severity of Fusarium yellows of celery. Plant Dis 82:322–328
33. Kendra DF, Hadwiger LA (1984) Characterization of the smallest chitosan oligomer that is maximally antifungal to Fusarium solani and elicits pisatin formation in Pisum sativum. Exp Mycol 8:276– 281
34. Matsubara M, Kuroda H (1991) Isolation and physiological activity of the chitosan from conidia and mycelia of Mycosphaerella pinodes. Chem Pharm Bull 39:1484–1488
35. EN84 (1997) Wood preservatives – Accelerated ageing of treated wood prior to biological testing – leaching procedure. European Committee for Standardization (CEN), Brussels, Belgium