ORIGINAL ARTICLE
Practical techniques for the vibration method with additional
mass: effect of crossers’ position in longitudinal vibration
Yoshitaka Kubojima1 · Satomi Sonoda2 · Hideo Kato1
Received: 12 October 2016 / Accepted: 7 January 2017 / Published online: 9 March 2017 © The Japan Wood Research Society 2017
Introduction
As vibration test is a simple and nondestructive method to measure Young’s modulus, it is applied to machine stress grading. Measuring density of a specimen is necessary for this testing method.
Grading machines that use a nondestructive method have been introduced in many sawmilling factories; however, numerous factories are unable to afford such machines. Large machines cannot be used for material inspection at a construc-tion site. Weighing each piled lumber is time consuming and labor intensive. Hence, a testing method to determine Young’s modulus of lumber without measuring weight is required.
Based on the theories of vibration, the effect of an additional mass bonded to a wooden bar on Young’s modulus of the bar has been previously investigated, and frequency equations incorporating the effect of the addi-tional mass and its position have been developed [1–3]. These frequency equations can be used to obtain density and Young’s modulus values after vibration tests without weighing the specimen. This method is called the “vibra-tion method with addi“vibra-tional mass” [4, 5].
Various test conditions must be assessed to apply this method to piled lumber. The weight of the upper lumber is applied to the lower lumber through crossers. Thus, the effect of the crosser’s position on the vibration method with additional mass was investigated.
Vibration method with additional mass
Young’s modulus using the longitudinal vibration E is expressed as follows:
(1) E= 𝜌c2,
Abstract The effect of the crosser’s position used for piled lumber on longitudinal vibration was investigated. As a model case, specimens with and without a concentrated mass were compressed in their thickness direction at nodal and antinodal positions of longitudinal vibration, following which, longitudinal vibration tests were conducted. Den-sity and Young’s modulus were unaffected by compression of the specimen at the nodal position but was affected by compression at the antinodal position. By placing crossers at the nodal positions, accurate density and Young’s modu-lus values can be determined using the vibration method with additional mass without the influence of weight of the upper lumber.
Keywords Antinodal position · Crosser · Longitudinal vibration · Nodal position · Vibration method with additional mass
This study was presented in part at the 66th Annual Meeting of Japan Wood Research Society, Nagoya, March 2016 and the World Conference on Timber Engineering (WCTE 2016), Vienna, August 2016.
* Yoshitaka Kubojima [email protected]
1 Forestry and Forest Products Research Institute, 1
Matsunosato, Tsukuba, Ibaraki 305-8687, Japan
2 Toyama Prefectural Agricultural, Forestry & Fisheries
where ρ and c are density and velocity, respectively. The frequency equation for the free–free longitudinal vibration with concentrated mass M placed at x = al (x: distance along the bar, 0 ≤ a ≤ 1) of a rectangular bar with length l is expressed as follows [3]:
where
and
The suffix n is the resonance mode number, and µ is the ratio of the concentrated mass to the mass of the bar.
If µ = 0, Eq. (2) is as follows:
For a bar without the concentrated mass, Eqs. (3) and (5) give
where the suffix 0 is the value without the concentrated mass.
Using Eqs. (3) and (6),
The value of µ can be calculated by substituting mn from Eq. (7) into Eq. (2). By substituting the calculated µ, con-centrated mass, and dimensions of a bar into Eq. (4), the density can be obtained. The Young’s modulus can be cal-culated by substituting the density from Eq. (4) and veloc-ity from Eq. (6) into Eq. (1) [4]. In the present study, this procedure is refferred to as the “vibration method with additional mass.”
Materials and methods
Specimens
Sitka spruce (Picea sitchensis Carr.) was used as speci-mens. Specimens with the dimensions of 1000 mm length (L), 30 mm width (R), and 10 mm thickness (T) and those with the dimensions of 1600 mm length (L), 105 mm width (R), and 105 mm thickness (T) were con-ditioned to a constant weight at 20 °C and 65% relative humidity. Twelve 1000-mm-long specimens and four
(2) sin mn+ 𝜇mncos amncos(1−a)mn=0,
(3)
mn= 𝜔nl
c (𝜔: angular frequency,𝜔= 2πf, f : resonance frequency),
(4) 𝜇= M
𝜌Al
(A:cross sectional area of the bar)
(5)
sinmn=0.
(6) nπ = 𝜔n0l
c ,
(7) mn= fn
fn0nπ.
1600-mm-long specimens were used. All the tests were conducted under the same conditions.
The specimens with the length of 1000 mm were used for the following reason. Plural crossers are usually used for piled lumber, and the resonance mode numbers with plural nodes are ≥2. In the present study, the second and third modes were examined as the resonance modes with plural nodes. The upper detection limit of the microphone used in the present study was approximately 10 kHz. The specimens with the length of 1000 mm were neces-sary for the resonance frequency of the third mode to be ≤10 kHz from the density and Young’s modulus of Sitka spruce [6].
Longitudinal vibration test
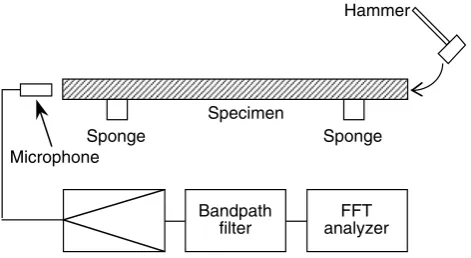
Longitudinal vibration tests were conducted using the following procedures to obtain the Young’s modulus under the simplest testing condition: Specimens without crossers were placed on small sponges at the nodal posi-tions of the second modes (x = l/4 and 3l/4) and the third modes (x = l/6 and 5l/6). Longitudinal vibration tests were performed under a free–free condition using speci-mens without a concentrated mass (Fig. 1).
The 1000-mm-long specimens were compressed at the nodal positions of the second and third modes mentioned above and the antinodal positions for the second modes (x = l/2) and third modes (x = l/3 and 2l/3), whereas the 1600-mm-long specimens were compressed at the nodal positions of the second and third modes.
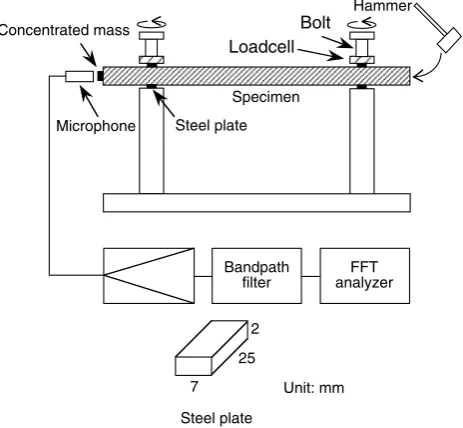
A model testing system (Takachiho Seiki Co., Ltd. KS-200) [7, 8] was used to examine the effect of cross-ers for the 1000-mm-long specimens. The specimens were supported at the compressing position by col-umns with a cross-sectional area of 25 mm × 25 mm of the apparatus. The test beam was compressed screwing a bolt attached to a load cell. The compressing load was
Specimen
Hammer
Microphone
Bandpath
filter analyzerFFT
Sponge Sponge
measured by the load cell and recorded by a data logger. For reducing the contact area of 25 mm × 25 mm, four steel plates with dimensions of 7 mm (L-direction of the specimen) × 25 mm (R-direction of the specimen) × 2 mm (T-direction of the specimen) were inserted (Fig. 2).
A tensile and compression testing machine (Minebea Co., Ltd. TCM-10000) was used for the 1600-mm-long specimens. For reducing the contact area, the specimens were supported at the compression position by the jig with an area of 10 mm (L-direction of the specimen) × 200 mm (R-direction of the specimen) of the apparatus. The test beams were compressed in a manner similar to that of the four-point bending test [8]. When the specimens came directly in contact with the jig, clear wave forms did not appear. Although the reason for this tendency should be studied in the future, this tendency was circumvented by inserting four rubber sheets with dimensions of 10 mm (L-direction of the specimen) × 200 mm (R-direction of the specimen) × 5 mm (T-direction of the specimen) between the specimen and each jig (Fig. 3).
Longitudinal vibration tests were performed using speci-mens with and without a concentrated mass. Vibration was initiated in the longitudinal direction at one end with a hammer, whereas the motion of the bar was detected by a microphone at the other end. The signal was processed through an FFT (Fast Fourier transform) digital signal ana-lyzer to yield high-resolution resonance frequencies.
A staple (approximately 0.057 g) was used as the con-centrated mass for the 1000-mm-long specimen. Two, four, six, and eight staples were driven into the specimen at
x = 0 on the RT-plane; the values of µ were approximately
0.000809, 0.00162, 0.00243, and 0.00324, respectively, as calculated using the masses of the staple and the specimen.
A steel plate (163.23 g) with dimensions of 70 mm × 70 mm × 4 mm was used as the concentrated mass for the 1600-mm-long specimen and was screwed at
x = 0 on the RT-plane; the values of µ were approximately 0.0233, as calculated using the masses of the steel plate and the specimen. According to Sonoda et al. [9], this µ value is suitable for specimens of this size.
Results and discussion
The means (standard deviation) of the density obtained using weight and volume of the specimen were 463 (24.6) and 411 (12.5) kg/m3 for the 1000- and 1600-mm-long
specimens, respectively. Those of the Young’s modulus using free–free longitudinal vibration without compres-sion from the second mode were 14.3 (0.65) GPa and 12.6 (0.57) GPa for the 1000 and 1600-mm-long specimens, respectively.
First, the results of the 1000-mm-long specimens are discussed.
Figure 4 shows an example of the wave forms of the specimens compressed at the nodal positions without the concentrated mass. Only the peaks of the second and third modes appeared upon compressing the specimens at the Specimen
Concentrated mass
Hammer
Microphone
Bandpath
filter analyzerFFT
Loadcell Bolt
Steel plate
7 2
25
Steel plate
Unit: mm
Fig. 2 A schematic diagram of the longitudinal vibration test with the compression of a 1000-mm-long specimen
Load
Specimen Concentrated mass
Hammer
Microphone
Bandpath
filter analyzerFFT Rubber sheet
Supporting jig
10
60 50
200
10 5
200
Unit: mm
Rubber sheet Supporting jig
nodal position of the second (x = l/4, 3l/4) and third modes (x = l/6, 5l/6), respectively.
To discuss these results, the minimum distance between the compression and antinodal positions dmin was used. Nodal and antinodal positions of the free–free longitudinal vibration are shown in Table 1.
When the specimens were compressed at the nodal posi-tion of the second mode, dmin was l/4 (=l/4–0) for the first mode and l/12 (=l/3 – l/4) for the third mode. When the specimens were compressed at the nodal position of the third mode, dmin was l/6 (=l/6–0) for the first mode and l/6 (=l/6–0) for the second mode. The results indicated that
dmin = l/12, l/6 and l/4 were so small that the peaks did not appear.
Figure 5 shows the relationship between resonance fre-quency (second and third modes) and compression stress. The concentrated mass did not exist for these cases. The resonance frequencies of the compressed specimens were approximately equal to those of the specimens without compression. Hence, compression at the nodal positions did not affect the resonance frequency.
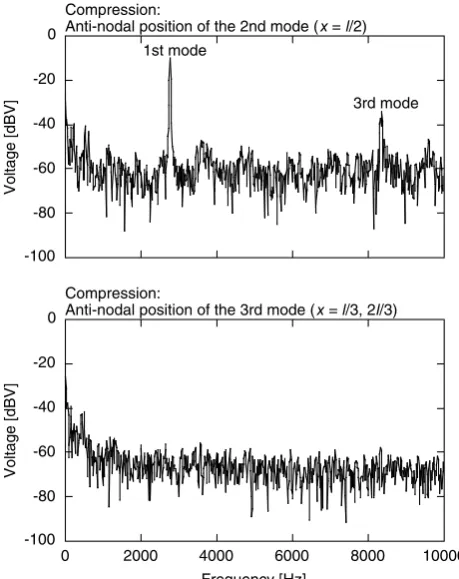
Figure 6 shows an example of the wave forms of the specimens compressed at the antinodal positions with-out the concentrated mass. The peak of the second mode disappeared upon compressing the specimens at the anti-nodal position of the second mode (x = l/2). The peaks of the first and third modes appeared in this case because the compression position corresponded to the nodal posi-tions of the first and third modes as shown in Table 1. In contrast, the peaks of the first, second, and third modes disappeared upon compressing the specimens at the anti-nodal position of the third mode (x = l/3). dmin was l/3 (= l/3–0) for the first mode and l/6 (= l/2 – l/3) for the second mode. The results indicated that dmin = l/3 and l/6 were so small that the peaks did not appear. Therefore, the appropriate resonance frequencies may not be meas-urable by compressing at the antinodal positions.
Table 2 shows the results for the vibration method with additional mass for the 1000-mm-long specimens. The vibration method with additional mass was effective for the specimens compressed at the nodal positions of the second and third modes for eight and six staples, but not in the case for four and two staples.
-100 -80 -60 -40 -20 0
Compression:
Nodal position of the 2nd mode (x = l/4, 3l/4)
Voltage [dBV]
-100 -80 -60 -40 -20 0
0 2000 4000 6000 8000 10000 Compression:
Nodal position of the 3rd mode (x = l/6, 5l/6)
Voltage [dBV]
Frequency [Hz] 2nd mode
3rd mode
Fig. 4 Wave forms (1000-mm-long specimen compressed at the nodal positions without the concentrated mass, Compression stresses were 6.05 and 7.20 MPa for the second and third modes, respectively)
Table 1 Nodal and antinodal positions of free–free longitudinal vibration
Mode Node Anti-node
1st l/2 0, l
2nd l/4, 3l/4 0, l/2, l
3rd l/6, l/2, 5l/6 0, l/3, 2l/3, l
4th l/8, 3l/8, 5l/8, 7l/8 0, l/4, l/2, 3l/4, l
5th l/10, 3l/10, l/2, 7l/10, 9l/10 0, l/5, 2l/5, 3l/5, 4l/5, l
5000 5500 6000 6500 7000 7500 8000 8500 9000
0 2 4 6 8 10
Resonance frequency [Hz]
Compression stress [MPa] Compression at the nodal position of 2nd mode (x = l/4, 3l/4) 3rd mode (x = l/6, 5l/6) Without compression
3rd mode
2nd mode
This phenomenon is believed to result from the exist-ence of a suitable range of µ. Figure 7 shows the relationship between mn and µ calculated using Eq. (2). The large abso-lute value of the differential coefficient is suitable because the effect of any errors in mn caused by measuring the resonance frequency on µ is small [4]. Thus, a very light concentrated mass (0.4568–0.1142 g) was used in the present study so that µ would to be small. Theoretically, the error of estima-tion of Young’s modulus becomes small when the mass ratio
is small. However, the measurement error increases at a very small mass ratio because the difference between the reso-nance frequency with the concentrated mass and that without the concentrated mass becomes too low [9]. An example of resonance frequency for a specimen is shown in Table 3.
The resonance frequencies of the 1600-mm-long speci-mens without a concentrated mass increased with an increase in the compression stress; for example, from 5177 Hz (third mode) without compression to 5280 Hz at 7.01 MPa. The reason for this tendency is a subject for future research. The resonance frequencies of the specimens on which 10 lumber is placed are discussed in the present study. The stress applied to the specimen by two crossers was calculated using density (411 kg/m3), volume (1600 mm × 105 mm × 105 mm = 0.
01764 m3), gravitational acceleration (9.81 m/s2), and
con-tact area (10 mm × 105 mm = 1.05 × 10− 3 m2), calculated as
0.34 MPa from the following equation:
(8) 411 kg/m3×0.01764 m3×9.81 m/s2
×10∕2∕(1.05×10⁻³m2)∕106=0.34 MPa.
-100 -80 -60 -40 -20 0
Compression:
Anti-nodal position of the 2nd mode (x = l/2)
Voltage [dBV]
-100 -80 -60 -40 -20 0
0 2000 4000 6000 8000 10000
Voltage [dBV]
Frequency [Hz] 1st mode
3rd mode
Compression:
Anti-nodal position of the 3rd mode (x = l/3, 2l/3)
Fig. 6 Wave forms (1000-mm-long specimen compressed at the anti-nodal positions without the concentrated mass,Compression stresses were 5.74 and 6.03 MPa for the second and third modes, respectively)
Table 2 Ratios of density and Young’s modulus obtained by the vibration method with additional mass to those without the concen-trated mass (1000-mm-long specimens)
Mean (standard deviation) of twelve specimens Mode Number of staples
8 6 4 2
Versus compressed specimen without a concentrated mass
2nd 0.93 (0.063) 0.98 (0.090) 1.13 (0.17) 4.22 (9.22) 3rd 0.99 (0.11) 1.00 (0.097) 1.27 (0.72) 2.51 (3.15) Versus non-compressed specimen without a concentrated mass
2nd 0.93 (0.065) 0.98 (0.091) 1.14 (0.17) 4.22 (9.21) 3rd 0.99 (0.11) 1.00 (0.096) 1.27 (0.72) 2.52 (3.16)
0 5 10 15 20
0 2 4 6 8 10
mn
µ
m1 m3m2 m4 m5
Fig. 7 Relationship between mn and µ (a = 0)
Table 3 An example of resonance frequency [Hz] of the second and third modes of a compressed specimen with and without the concen-trated mass (1000-mm-long specimens)
Mode Number of staples
8 6 4 2 0
2nd 5466 5471 5475 5479 5484
Table 4 shows the results for the vibration method with additional mass of the 1600-mm-long specimens, indicat-ing that the vibration method with additional mass was accurately performed for these specimens.
Hence, the vibration method with additional mass was effective for the specimens compressed at the nodal posi-tions under a suitable concentrated mass. These results suggest that when crossers are placed at the nodal posi-tions, accurate density, and Young’s modulus values can be obtained using the vibration method with additional mass without the influence of the weight of the upper lumber.
The next step is to examine the applicability of this measurement method to full-sized lumber. For this pur-pose, Sonoda et al. [9] examined the connecting method of the concentrated mass (screw connection and tape con-nection) and mass ratio and found that the screw connec-tion provides better estimaconnec-tion than the adhesive tape con-nection. The specimen with a screw connection showed remarkable resonance. The damping of the vibration of the specimen with an adhesive tape connection was observed, as evidenced by the increase in additional mass. The damp-ing affected the measurement of the resonance frequencies. The mass ratio was suitable for estimation at approximately 2%. The estimated Young’s modulus decreased according to the increase in the mass ratio or damping. The difference depends on certain conditions, such as the resonance fre-quency and the performance of the frefre-quency analyzer.
In addition, in practice, accurately placing crossers at the nodal positions will require a considerable amount of time and labor. Hence, the effect of the distance between the nodal position and a crosser on the vibration method with additional mass should be investigated. The influence of the number of crossers should be studied because more than two crossers are occasionally used. Furthermore, the moisture content of a specimen for the vibration method with additional mass is an important consideration.
Conclusions
The effect of the crosser’s position used for piled lumber on longitudinal vibration was investigated. As a model case, specimens with and without a concentrated mass were compressed in their thickness direction at the nodal and antinodal positions of longitudinal vibration, and longitu-dinal vibration tests were conducted. The following results were obtained:
1. Clear peaks appeared when the specimens were com-pressed at the nodal positions. The resonance frequen-cies of the compressed specimens at the nodal positions were approximately equal to those of the specimens without compression. Hence, compression at the nodal positions did not affect the resonance frequency. 2. The second mode disappeared in compression at the
antinodal position of the second mode, whereas the first, second, and third modes disappeared upon com-pression at the antinodal position of the third mode. It is possible that the appropriate resonance frequencies could not be measured by compression at the antinodal positions.
3. The vibration method with additional mass was effec-tive for the specimens compressed at the nodal posi-tions of the second and third modes for eight and six staples, whereas it was not effective for four and two staples. Hence, the vibration method with additional mass was effective for the specimens compressed at the nodal positions under a suitable concentrated mass. 4. When crossers are placed at the nodal positions,
accurate density and Young’s modulus values can be obtained without the influence of the weight of the upper lumber using the vibration method with addi-tional mass.
Acknowledgements This study was supported by JSPS KAKENHI Grant Number JP15K07522.
References
1. Kubojima Y, Tonosaki M, Yoshihara H (2003) Effect of the additional mass applied at an end of a wooden beam on its flex-ural vibrational properties. Wood Industry 58:370–372
2. Kubojima Y, Tonosaki M, Yoshihara H (2005) Effect of addi-tional mass on Young’s modulus of a wooden beam. J Test Eval 33:278–282
3. Kubojima Y, Suzuki Y, Tonosaki M (2014) Effect of additional mass on the apparent Young’s modulus of a wooden bar by lon-gitudinal vibration. BioRes 9:5088–5098
4. Kubojima Y, Sonoda S (2015) Measuring Young’s modulus of a wooden bar using longitudinal vibration without measuring its weight. Eur J Wood Wood Prod 73:399–401
Table 4 Ratios of density and Young’s modulus obtained by the vibration method with additional mass to those without the concen-trated mass (1600-mm-long specimens)
Mean (Standard deviation) of four specimens
Versus compressed specimen without a concentrated mass
2nd 0.96 (0.043)
3rd 0.92 (0.050)
Versus non-compressed specimen without a concentrated mass
2nd 0.96 (0.043)
5. Kubojima Y, Kato H, Tonosaki M, Sonoda S (2016) Measuring Young’s modulus of a wooden bar using flexural vibration with-out measuring its weight. BioRes 11:800–810
6. Hearmon RFS (1948) The elasticity of wood and plywood. His Majesty’s Stationary Office, London
7. Kubojima Y, Ohsaki H, Kato H, Tonosaki M (2006) Fixed-fixed flexural vibration testing method of beams for timber guardrails. J Wood Sci 52:202–207
8. Kubojima Y, Kato H, Tonosaki M (2012) Fixed-fixed flexural vibration testing method of actual-size bars for timber guardrails. J Wood Sci 58:211–215