www.j-sens-sens-syst.net/6/97/2017/ doi:10.5194/jsss-6-97-2017
© Author(s) 2017. CC Attribution 3.0 License.
Evaluation of dynamic measurement uncertainty –
an open-source software package to bridge
theory and practice
Sascha Eichstädt1, Clemens Elster1, Ian M. Smith2, and Trevor J. Esward2
1Physikalisch-Technische Bundesanstalt, Braunschweig and Berlin, Germany 2National Physical Laboratory, Teddington, UK
Correspondence to:Sascha Eichstädt ([email protected])
Received: 1 September 2016 – Revised: 5 December 2016 – Accepted: 17 January 2017 – Published: 14 February 2017
Abstract. The analysis of dynamic measurements provides numerous challenges that significantly limit the use of existing calibration facilities and mathematical methodologies. For instance, dynamic measurement anal-ysis requires the application of methods from digital signal processing, system and control theory, and mul-tivariate statistics. The design of digital filters and the corresponding evaluation of measurement uncertainty for high-dimensional measurands are particularly challenging. Several international research projects involv-ing national metrology institutes (NMIs), academia and industry have developed mathematical, statistical and technical methodologies for the treatment of dynamic measurements at NMI level. The aim of the European research project 14SIP08 is the development of guidelines and software to extend the applicability of those methodologies to a wider range of users. This paper outlines the required activities towards a traceability chain for dynamic measurements from NMIs to industrial applications. A key aspect is the development and provision of a new open-source software package. The software is freely available, open for non-commercial distribution, and contains the most important data analysis tools for dynamic measurements.
1 Introduction
The analysis of dynamic measurements, i.e. measurements where at least one of the quantities of interest is time-dependent, is becoming increasingly important in metrology and industry. Dynamic measurements are encountered in a wide range of application areas, covering, for instance, single sensors to complex sensor networks, and measured quantities changing on scales from picoseconds up to several minutes. Examples of dynamic measurements of mechanical quanti-ties can be found in, for instance, (Link et al., 2005) for accel-eration, in (Schlegel et al., 2012) and (Kobusch et al., 2015) for force, in (Klaus et al., 2015) for torque and in (Gardner, 1981), (Matthews et al., 2014) and (Wilkens and Koch, 2004) for pressure. A more general overview on the current state of dynamic measurements in industrial applications is given in (Schäfer, 2015). Dynamic measurement of electrical quanti-ties is covered, for instance, by (Younan et al., 1991), (Hale et al., 2009) and (Humphreys et al., 2015).
Despite the widespread occurrence of dynamic measure-ments, there is a lack of guidelines and standards for their treatment, application and analysis. For static measurements, i.e. measurements where no quantity of interest is time-dependent, the Guide to the Expression of Uncertainty in Measurement (GUM) and its supplements (BIPM et al., 2008a, b, 2011) are widely considered as quasi-standards re-garding the evaluation of uncertainty. These documents have led to the development of many software packages of vary-ing complexity, which provide easy-to-use implementations of the GUM framework. This, together with the availability of international standards with uncertainty evaluation based on the GUM framework, has led to an acceptance and ap-plication of metrologically validated uncertainty treatment. Moreover, it provides the foundation of traceability for static measurements.
mea-surement analysis, as outlined in (Eichstädt et al., 2016), (Ruhm, 2016) and others.
Dynamic metrology is a very active field of development, and various approaches to the evaluation and propagation of uncertainty can be found in the literature. For instance, on-line evaluation of uncertainty in the application of fi-nite impulse response (FIR) filters is addressed by (Elster and Link, 2008), and infinite impulse response (IIR) filters by (Link and Elster, 2009); efficient Monte Carlo meth-ods for uncertainty propagation is presented in (Eichstädt et al., 2012), the efficient reporting of high-dimensional co-variance matrices is addressed by (Humphreys et al., 2015), regularized deconvolution in the frequency domain is con-sidered by (Hale et al., 2009) and (Dienstfrey and Hale, 2014), and propagation of uncertainty in the application of the discrete Fourier transform (DFT) is addressed by (Eich-städt and Wilkens, 2016). Moreover, the European Metrology Research Programme (EMRP) projects IND09, “Traceable dynamic measurement of mechanical quantities1”, (2011– 2014) and IND16, “Metrology for ultra-fast electronics and high-speed communications2”, (2011–2014) laid the founda-tions for primary dynamic calibration of force, torque and pressure sensors, as well as bridge amplifiers and ultra-fast electronic devices. However, application of the methods de-veloped within IND09 and IND16 is still mostly limited to national metrology institutes (NMIs). Consequently, the main goal of the European Metrology Programme for In-novation and Research (EMPIR) project 14SIP08 Standards and software to maximize end user uptake of NMI calibra-tions of dynamic force, torque and pressure sensors3(2015– 2018) is to bridge the gap between the analysis of dynamic measurements at NMI-level and that within industry. There-fore, NMIs PTB (Physikalisch-Technische Bundesanstalt, Germany) and NPL (National Physical Laboratory, UK), to-gether with international companies HBM GmbH and Rolls-Royce Ltd., aim to develop practical guidelines, tutorials, training material and software. In this contribution we out-line the challenges to be tackled by the analysis of dynamic measurements, indicate recent publications on the state of the art at NMI level, and give an introduction to the pub-licly available open-source software package PyDynamic4 being developed within 14SIP08. The newly developed soft-ware allows for the first time an off-the-shelf application of NMI-level data analysis and measurement uncertainty eval-uation methods. As mentioned above, this is a pre-requisite for achieving a wide acceptance and application of dynamic measurement analysis. Moreover, a wide acceptance and val-idation of this software is ensured by a clear documentation as part of the source code and in terms of documented ex-amples together with a transparent and open system for the
1https://www.ptb.de/emrp/ind09.html 2https://www.ptb.de/emrp/ultrafast.html
3http://mathmet.org/projects/14SIP08 4https://github.com/eichstaedtPTB/PyDynamic
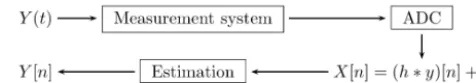
Figure 1.Basic outline of a dynamic measurement with analogue-to-digital conversion (ADC) of the measured system output before processing.
documentation of the software development using a public repository. Finally, the deployment through the established platform PyPi5allows for an easy installation with the sim-ple commandpip install PyDynamic.
2 Development of standards for dynamic measurements
Harmonization and standardization are underpinning most of today’s metrology and industrial areas where compara-bility, conformity and quality assurance play an important role. The Guide to the Expression of Uncertainty in Mea-surement (GUM) (BIPM et al., 2008a) and its supplements (BIPM et al., 2008b, 2011) represent a well-established foun-dation of an uncertainty framework that can be applied to a large variety of application areas. It is based on a clear def-inition of the measurand, i.e. the quantity of interest, and a mathematical model for its evaluation. An important aspect of metrology research for dynamic measurements is thus the development of a framework that allows the adaption of the GUM methodology for dynamic metrology. Here we give a comprehensive overview for the challenges to be addressed by such adaptions and provide questions and tasks to be con-sidered in future standardization activities.
For most applications in dynamic metrology, the analysis of dynamic measurements follows the basic workflow illus-trated in Fig. 1.
The measurand is thus the sequence Y=
(Y[1], Y[2], . . .Y[N])T of discrete time values and, conse-quently, its uncertainty is a covariance matrix of dimension
N×N, with N typically larger than 1000. In some ap-plications, certain parameters are to be derived from this sequence. Such single parameter values can, for instance, be positive and negative peak values, an integral over a certain time interval, the rise time of a step or the frequency of an oscillation. However, the propagation of uncertainties to such parameters often require knowledge of the uncertainty over a certain time interval. The typical example is the calculation of an integral which also requires correlations between different time instants to be accounted for. Thus, we here consider as measurand the whole sequenceY.
Although the top-level workflow for dynamic measure-ments is the same as that for static measuremeasure-ments, the
dividual low-level steps differ significantly for the following reasons:
1. The measurement system input is a function of time;
2. The measuring device is a dynamic system (often linear and time-invariant);
3. The estimation task requires the solution of an ill-posed inverse problem;
4. The measurand is a high-dimensional multivariate quantity.
In contrast, (1) in static measurements all quantities are static, i.e. time dependence can be neglected; (2) the mea-surement system is usually not dynamic, but can be described by algebraic equations; (3) the model for the evaluation of a static measurand is usually not an ill-posed inverse prob-lem, but an algebraic equation; and (4) measurands in static measurements are typically univariate or of small dimension (<10) whereas dynamic measurands may contain several thousand values. Altogether, the distinction between static and dynamic measurements is that, for the latter, the fre-quency content of the involved time series in relation to the frequency-dependent (i.e. dynamic) behaviour of the measur-ing device has to be taken into account. For instance, when the bandwidth of the dynamic measurand exceeds that of the measuring system employed, significant time-dependent er-rors are to be expected in the output of the measuring system. For the compensation and correction of such errors, method-ologies from static measurement analysis are not sufficient.
These differences pose various challenges for metrology and require the development of a new metrological vocabu-lary, the adaptation of methods from signal processing and system theory for metrological purposes, and the harmoniza-tion of regularizaharmoniza-tion methods regarding the corresponding evaluation of uncertainty. In particular:
1. Quantities whose values are continuous functions of time would require the translation of the GUM uncer-tainty framework to the treatment of stochastic pro-cesses as described in (Eichstädt, 2012). In order to avoid the corresponding mathematical complexities, a discretized measurand may be considered instead. That is, in the workflow in Fig. 1 the discrete-time sequence
Y[n] ≡Y(tn) is considered as the measurand in order to enable treatment within the GUM uncertainty frame-work.
2. Estimation of the measurand requires knowledge of the dynamic behaviour of the measurement system. Hence, a calibration has to identify and quantify the frequency-dependent characteristics of the complete measurement chain. As a consequence, measurement principles from the static case do not transfer to the dynamic case.
3. The estimation task is a mathematically ill-posed in-verse problem, which requires some kind of regulariza-tion to obtain valuable results. Although many regular-ization methods can be found in the literature, the ma-jority of the available approaches are heuristic and their application to metrology is an ongoing topic of research. In particular, evaluation of the uncertainty contribution of the regularization is a challenging task, because it in-corporates prior knowledge about the measurand in the estimation process. This approach is common, for in-stance, in Bayesian statistical inference, but is not yet considered within the GUM uncertainty framework.
4. The reporting and dissemination of a dynamic measure-ment result cannot be carried out in the same way as for static measurements, due to the high dimensional-ity of the measurand. Typically, a dynamic measurand is a time series of dimension greater than 1000 with its uncertainty being a corresponding covariance matrix. Conventional reporting for static measurements are of-ten based on a printed report with a table for the uncer-tainty budget. This kind of reporting is thus infeasible for dynamic measurands.
Several research efforts in dynamic metrology have devel-oped initial answers to some of the challenges listed above. For instance, primary dynamic calibration methods for sev-eral mechanical and electrical quantities have been devel-oped at NMIs during the last few years – see Sect. 1 and references therein.
Despite the availability of many publications on dynamic metrology, the translation into international standards and guidelines is still at an early stage. Some national guide-lines, such as the draft German DKD-R 3–10 on dynamic calibration of uni-axial testing machines, and international standards, such as (ISO 16063-43:2015) on methods for the calibration of vibration and shock transducers, directly ad-dress dynamic calibration. The majority of current standards and guidelines, however, either refer to the lack of common methods and harmonized treatment and the general need for research or they are limited to static measurements only.
certain examples this may result in the acceptance of larger errors and possibly unreliable uncertainties in order to ben-efit from easily applicable mathematical methods. For in-stance, the (CIE TC2-60:2013) guideline “Effect of instru-mental bandpass function and measurement interval on spec-tral quantities” advises the use of methods related to classi-cal approaches in that field despite well-known drawbacks, because of their easier application. In order to compensate for the mathematical complexity of a superior method, PTB had developed a software tool with a graphical user inter-face; see (Eichstädt et al., 2013). This resulted in a wider acceptance and application of the method, which would not have been possible with the availability of the method alone6. Similar situations can be found in many other applications. For instance, the parametric dynamic calibration method in ISO 16063 requires the availability of a measured frequency response with associated uncertainties and the propagation of uncertainties to the estimated transducer model param-eters. The required mathematical methods are beyond the standard toolbox of most dedicated laboratories. Another ex-ample can be found in the standard (IEC 62127-1:2007-11) for hydrophones used for the characterization of medical ul-trasound devices. There, the need of deconvolution for non-ideal hydrophones is identified. An incorporation of respec-tive mathematical procedures, though, is postponed until eas-ily applicable approaches are available. Therefore, several re-search activities are on the way in order to lay the foundation for a revision of this standard. The availability of approach-able methods and ready-to-use software will be an important aspect for the acceptance of the revision in practice.
3 PyDynamic – software for dynamic metrology
Many tasks in dynamic metrology involve the application of signal processing, for which ready-to-use implementa-tions are available in almost all major software packages. These software implementations, though, lack the corre-sponding evaluation of uncertainty. As a consequence, un-certainty evaluation is frequently undertaken using either rule-of-thumb methods or time-consuming simulation ap-proaches, or is neglected completely. The EMPIR project 14SIP08 develops a user-friendly software environment to carry out data processing for dynamic metrology. The soft-ware is called PyDynamic and it implements recently pub-lished mathematical and statistical methods required to carry out the workflow shown in Fig. 1. Since the methods have been published elsewhere, we will focus on the demonstra-tion of their simple applicademonstra-tion by using PyDynamic. There-fore, the currently implemented methods are illustrated using three typical tasks in the analysis of dynamic measurements.
6The software can be downloaded free of charge from the PTB
website.
3.1 Design of a compensation filter
Estimation of the dynamic measurand in the workflow de-picted in Fig. 1 can be undertaken through the application of a digital compensation filter; cf. (Eichstädt et al., 2010). To this end, a digital finite impulse response (FIR) filter,
g(z)=
M X k=0
bkz−k, (1)
can be designed such that its frequency response,
G(e−j ω/Fs)=
M X k=0
bke−j kω/Fs, (2)
approximates that of the inverse measurement system in a certain frequency interval, i.e.
H(j ω)G(e−j ω/Fs)e−j ωτ ≈1, |ω| ≤ω
1, (3)
withH(j ω) the frequency response of the measurement sys-tem. The time delayτ =n0Ts is introduced as a means of addressing the unphysical nature of the inverse system; cf. (Eichstädt et al., 2010). An example of such a filter is shown in Fig. 2.
Provided that the frequency response of the measurement system is available at a set of frequencies, the design of a compensation filter can be carried out by solving the lin-ear least-squares problem for the filter coefficient vectorb
of lengthM+1:
b=arg minb(H−Db)>W−1(H−Db), (4)
withDthe design matrix of dimension 2N×(M+1),Wa chosen 2N×2N symmetric weighting matrix, and the 2N
frequency response values of the measurement system ex-pressed in terms of real and imaginary parts,
H=(<H(j ω1), . . .,=H(j ωN)). (5)
See (Elster and Link, 2008). Typically, these values are deter-mined by dynamic calibration experiments or derived from information provided by the manufacturer. Thus, the values ofHare accompanied by a statement of their uncertaintyUH which has to be propagated to an uncertaintyUb associated with the filter coefficientsb. Since the filter coefficient esti-mate is evaluated by means of weighted linear least-squares, the associated uncertainty is the covariance matrix,
Ub=
D>WD−1D>WUHWD
D>WD−1. (6)
Figure 2.Frequency response of the measurement system of the FIR deconvolution filter and the resulting compensation as a product of the measurement system and deconvolution filter.
(iii) the numerical solution of the (weighted) least-squares problem and finally (iv) the propagation of uncertainties to the estimated filter coefficients. In PyDynamic, task (i) can typically be carried out by using the methods for working with the discrete Fourier transform, and tasks (ii)–(iv) are carried out by the functionLSFIR_unc:
b, Ub = LSFIR_unc(H, UH, M, n0, f, Fs)
withfthe vector of frequencies at which the system’s fre-quency response is given and Fs the sampling frequency. Thus, the mathematical complexity of the filter design task is encapsulated within one Python function call.
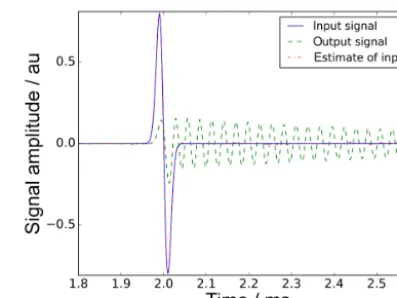
Figure 3 shows the result of applying an FIR deconvolu-tion filter to the output of a measurement system whose reso-nance frequency is excited by the simulated input signal. On the scale of Fig. 3, the FIR filter output is almost indistin-guishable from the simulated input signal.
If, instead of an FIR filter, an IIR filter is sought, the Py-Dynamic function
b, a, Uab = LSIIR_unc(H,UH,Mb,Ma,f,Fs)
which implements a Monte Carlo method for uncertainty propagation can be used. Here, Mb and Ma denote the or-der of the numerator and denominator IIR filter part, respec-tively.
3.2 Uncertainty propagation for digital filtering
The application of digital filters is one of the most basic tasks in the processing of dynamic measurement data. A common example is the application of a low-pass filter for noise at-tenuation or a compensation filter for input estimation, as described above. The implementation of digital filtering is straightforward in almost all scientific software packages, whereas the propagation of uncertainty is typically neglected.
Figure 3.Input signal for a simulated measurement, calculated out-put signal, and estimate obtained by the application of a FIR decon-volution filter to the system output.
This statement in particular holds true when the filter coeffi-cients have associated uncertainty. However, the propagation of uncertainties is a prerequisite for the final step in the work-flow depicted in Fig. 1.
3.2.1 FIR filtering
Consider the FIR filter with coefficient vector b having associated uncertainty Ub, and the filter input signal x= (x(t1), . . ., x(tN))> with associated point-wise uncertainties
ux=(ux1, . . ., uxN)
>. Following (Elster and Link, 2008), the
filter output is obtained as
y(tn)= M X k=0
bkx(tn−k), (7)
with uncertainty evaluated as
u2y
n=b
>U
X(n)b+X>(n)UbX(n)+Tr(UX(n)Ub), (8)
whereUX(n) denotes the covariance matrix associated with
X(n)=(x(tn), . . ., x(tn−M))> and Tr denotes the trace of a matrix. Whenb is a deconvolution filter, its application to the measured system output is typically complemented with a low-pass filter for noise attenuation; see (Elster and Link, 2008). ThenUX(n) also contains the correlation introduced by the low-pass filter. Otherwise, the covariance matrixUX(n) contains only a diagonal with elements equal toux. Hence, the propagation of uncertainties through an FIR filter with uncertain coefficients requires the calculation of the time-dependent covariance matrixUX(n) and the implementation of Eq. (8). InPyDynamic, this task is carried out simply by
y, uy = FIRuncFilter(x, ux, b, Ub)
Figure 4.Point-wise standard uncertainties associated with the out-put of the FIR deconvolution filter.
3.2.2 IIR filtering
The application of a digital filter with IIR is given mathemat-ically by
y(tn)= M X k=0
bkx(tn−k)− M X k=1
aky(tn−k). (9)
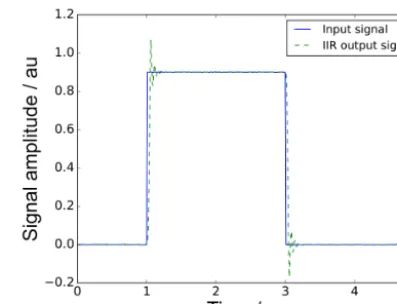
An example of the application of an IIR filter is given in Fig. 5.
The recursive structure of the IIR filter makes an analytic calculation of the uncertainty associated with its output dif-ficult. Therefore, (Link and Elster, 2009) considered a trans-formation of the model equation into a state-space system instead, yielding
z(n+1)=Az(n)+qx(n), (10)
y(n)=c>z(n)+b0x(n), (11)
withq=(0, . . .,0,1)>,c=(bM−b0aM, . . ., b1−b0a1)>and
A=
0 1 0 · · · 0 0
0 0 1 · · · 0 0
..
. ... ... . .. ... ...
0 0 0 · · · 1 0
0 0 0 · · · 0 1
−aM −aM−1 −aM−2 · · · −a2 −a1
.
(Link and Elster, 2009) derived an uncertainty propagation scheme based on a linearization of the state-space model with respect to the filter coefficients and the input sequencex[n]. The resulting uncertainty calculation can be carried out in parallel with the application of the IIR filter. The mathemati-cal procedure as proposed by (Link and Elster, 2009) requires the implementation of a state-space model with time-varying derivatives in order to propagate the uncertainty through the IIR filter with uncertain coefficients. In PyDynamic, this task is carried out simply by
y, uy = IIRuncFilter(x, ux, b, a, Uab)
Figure 5.Rectangular signal and corresponding output of a sixth-order IIR low-pass filter of Butterworth type.
It is well known that uncertainty evaluation using the GUM uncertainty framework can produce unreliable results due to the use of a linearization of the model function. A Monte Carlo method, as described in GUM Supplement 1 (cf. (BIPM et al., 2008b)), can instead be applied. A straight-forward implementation of the Monte Carlo method, though, is infeasible due to the high dimensionality of the measur-and. Therefore, (Eichstädt et al., 2012) developed an efficient sequential implementation of the GUM Monte Carlo proce-dure specifically for measurement models that involve digital filtering. With the sequential implementation of the Monte Carlo simulation, the required computer memory is indepen-dent of the length of the involved signals. In (Eichstädt et al., 2012), the corresponding algorithms are provided as pseudo-code. The implementation, however, may require advanced programming skills in order to carry out the required steps ef-ficiently. In PyDynamic, the sequential Monte Carlo method is used by calling
y, uy = SMC(x,noise,b,a,Uab,runs=10000)
and it also allows for the sequential calculation of point-wise coverage intervals with prescribed coverage probability. Figure 6 shows the uncertainty associated with the output of the low-pass filter depicted in Fig. 5 when the filter cut-off frequency is uncertain, which consequently results in uncer-tain filter coefficients.
3.3 Uncertainty evaluation for the discrete Fourier transform
Figure 6.Point-wise standard uncertainties associated with the IIR low-pass filter output signal, when the filter cut-off frequency is un-certain.
DFT, multiplication in the frequency domain, deconvolu-tion in the frequency domain, and the conversion from an amplitude–phase representation of a system’s frequency re-sponse to its representation by real and imaginary parts. In PyDynamic, these methods are contained in the module
propagate_DFT.
For instance, the propagation through the application of the DFT for the discrete-time signalywith associated uncer-taintyUyis carried out by
Y, UY = GUM_DFT(y,Uy)
A deconvolution in the frequency domain to obtain an es-timateXof the DFT of the system inputxfrom knowledge of the system output y and the system frequency response
H(j ω) with associated uncertaintyUH is carried out by
X, UX = DFT_deconv(H, Y, UH, UY)
A low-pass filter for noise-attenuation can then be applied to the result of the deconvolution by
Xl, UXl = DFT_multiply(X, UX, HL)
with HL the frequency response of the chosen low-pass filter.
The DFT domain methods in PyDynamic provide an end-to-end propagation of uncertainties in many important ap-plication areas. For instance, dynamic calibration of second-order systems based on measurement of the input and output signal can be carried out by using (i)GUM_DFTto propagate the time-domain signals and their uncertainty to the Fourier domain, (ii) DFT_deconv to calculate the frequency re-sponse of the system to be calibrated and its associated un-certainty, (iii) fit_sosto fit the parameters of a second-order system to the uncertain frequency response and calcu-late their associated uncertainties, (iv) LSFIR_uncto de-sign a corresponding FIR-type deconvolution filter with un-certain coefficients and, finally, (v)FIRuncFilterto ap-ply that filter to a measured system output and calculate an
estimate of its input and its associated uncertainty in line with the GUM framework. Similar workflows can be outlined for many other application areas of dynamic metrology. In this way PyDynamic lays the foundation for a wide implementa-tion of reliable NMI-level and GUM-compliant tools in the analysis of dynamic measurements.
4 Outlook
With the availability of a harmonized vocabulary, a princi-pal and general mathematical modelling approach, together with established routines for the evaluation of measurement uncertainties and the development of a traceability chain for industrial end users of dynamic measurement, can finally be achieved. The next steps in the development of PyDynamic will thus focus on the implementation of further mathemat-ical and statistmathemat-ical approaches to common tasks in dynamic metrology. This includes, for instance, the identification of general transfer function models to frequency response data with associated uncertainties, the propagation of the uncer-tainty associated with dynamic quantities of high dimension-ality, sub-sampling and interpolation of dynamic quantities. There is an increasing use of sensors in distributed networks with automated data assimilation and evaluation. This re-quires common data protocols in order to enable a reliable communication for the sensor network. Therefore, we are de-veloping a custom data format “Signal” for PyDynamic that allows the user to carry out standard data operations with-out the need to manually propagate the uncertainties. That is, “Signals” can be added, subtracted from one another us-ing standard “+” and “−” operations; digital filters with or without uncertain coefficients can be applied to a “Signal”; application of sub-sampling, interpolation and multiplication with a scalar or a vector can be carried out easily. Each “Sig-nal” has at least three properties: a time axis, signal values and associated uncertainties. For all operations on and with “Signals”, the propagation of uncertainties is carried without intervention of the user. In this way, complex programs and calculations can be carried out without additional costs re-garding the implementation of the corresponding uncertainty evaluation.
5 Conclusions
Analysis of dynamic measurements is the topic of a grow-ing number of research initiatives. The majority of publica-tions in this area focus on measurements at the level of NMIs. However, dynamic measurements are routinely carried out at the industrial level and mathematical and statistical methods, guidelines and best-practice guides, which are suitable for typical industrial applications, are required. The prerequisite for the development and wide acceptance of such guidance documents, though, is the availability of well-established and approachable methodologies. At present, there is a signifi-cant lack of methods and advice, standard software tools and international standards. This lack has been acknowledged in several publications and support is being requested by a growing number of standardization groups. Therefore, in the EMPIR project 14SIP08, NMIs PTB (Germany) and NPL (UK), together with international companies HBM GmbH and Rolls-Royce Ltd., aim to develop practical guidelines, tu-torials, training material and software. One of the outcomes of this project is the software package PyDynamic, which after only one year of development already provides imple-mentations of the major tools required for the analysis of dy-namic measurements. The software development will con-tinue throughout and beyond the duration of 14SIP08. The intention is for PyDynamic to act as ready-to-use software that removes the barrier between the analysis of static and dynamic measurements, and makes dynamic measurement analysis standard practice within both NMIs and industry. We outlined, for three typical-use cases in dynamic metrology, how such a software tool can enable the application of so-phisticated mathematical approaches. In many applications, the complete data analysis workflow can already be carried out with the help of PyDynamic functions, making the prop-agation of uncertainties through that workflow a simple task for the user. In the future, this will be improved even more by the provision of the custom data format “Signal” which allows the propagation of uncertainties without the need to know which PyDynamic function would be required for the operation on the data. Together with the cooperation of EM-PIR 14SIP08 with JCGM WG1 and the publication of guid-ance documents, this lays the foundation for future standards and international guidelines in dynamic metrology.
6 Code and data availability
The “data” used for this publication is simulated data, gen-erated by the code available for download at https://github. com/eichstaedtPTB/PyDynamic/tree/master/examples (Eichstädt and Smith, 2016).
Competing interests. The authors declare that they have no con-flict of interest.
Acknowledgements. This work has been carried out as part of the European Metrology Programme for Innovation and Research (EMPIR) project 14SIP08. The EMPIR initiative is co-funded by the European Union’s Horizon 2020 research and innovation programme and the EMPIR participating states.
Edited by: K.-D. Sommer
Reviewed by: three anonymous referees
References
BIPM, IEC, IFCC, ILAC, ISO, IUPAC, IUPAP, and OIML: Eval-uation of measurement data: Guide to the Expression of Uncer-tainty in Measurement, Joint Committee for Guides in Metrol-ogy, JCGM 100, 2008a.
BIPM, IEC, IFCC, ILAC, ISO, IUPAC, IUPAP, and OIML: Eval-uation of measurement data – Supplement 1 to the “1Guide to the Expression of Uncertainty in Measurement” – Propagation of distributions using a Monte Carlo method, Joint Committee to Guides in Metrology, JCGM 101, 2008b.
BIPM, IEC, IFCC, ILAC, ISO, IUPAC, IUPAP, and OIML: Evalua-tion of measurement data: Supplement 2 to the “Guide to the ex-pression of uncertainty in measurement” – Extension to any num-ber of output quantities, Joint Committee for Guides in Metrol-ogy, JCGM 102, 2011.
CIE TC2-60:2013: Effect of Instrumental Bandpass Function and Measurement Interval on Spectral Quantities, Guideline, Inter-national Commission on Illumination, 2013.
Dienstfrey, A. and Hale, P. D.: Analysis for dynamic metrology, Meas. Sci. Technol., 25, 1–12, 2014.
Eichstädt, S.: Analysis of Dynamic Measurements, PhD thesis, TU Berlin, 2012.
Eichstädt, S. and Smith, I.: PyDynamic – Python package for analysis of dynamic measurements, available at: https://github. com/eichstaedtPTB/PyDynamic/tree/master/examples (last ac-cess: 14 February 2017), 2016.
Eichstädt, S. and Wilkens, V.: GUM2DFT – a software tool for un-certainty evaluation of transient signals in the frequency domain, Meas. Sci. Technol., 27, 1–12, 2016.
Eichstädt, S., Elster, C., Esward, T. J., and Hessling, J. P.: Deconvo-lution filters for the analysis of dynamic measurement processes: a tutorial, Metrologia, 47, 522–533, 2010.
Eichstädt, S., Link, A., Harris, P., and Elster, C.: Efficient imple-mentation of a Monte Carlo method for uncertainty evaluation in dynamic measurements, Metrologia, 49, 401–410, 2012. Eichstädt, S., Schmähling, F., Wübbeler, G., Anhalt, K., Bünger,
L., Krüger, U., and Elster, C.: Comparison of the Richardson-Lucy method and a classical approach for spectrometer bandpass correction, Metrologia, 50, 107–118, 2013.
Eichstädt, S., Wilkens, V., Dienstfrey, A., Hale, P. D., Hughes, B., and Jarvis, C.: On challenges in the uncertainty evaluation for time-dependent measurements, Metrologia, 53, S125–S135, 2016.
Elster, C. and Link, A.: Uncertainty evaluation for dynamic mea-surements modelled by a linear time-invariant system, Metrolo-gia, 45, 464–473, 2008.
Hale, P. D., Dienstfrey, A., Wang, J., Williams, D. F., Lewandowski, A., Keenan, D. A., and Clement, T. S.: Traceable Waveform Cal-ibration With a Covariance-Based Uncertainty Analysis, IEEE T. Instrum. Meas., 58, 3554–3568, 2009.
Humphreys, D. A., Harris, P. M., Rodriguez-Higuero, M., Mubarak, F. A., Zhao, D., and Ojasalo, K.: Principal Component Compres-sion Method for Covariance Matrices Used for Uncertainty Prop-agation, IEEE T. Instrum. Meas., 64, 356–365, 2015.
IEC 62127-1:2007-11: Ultrasonics – Hydrophones – Part 1: Mea-surement and characterization of medical ultrasonic fields up to 40 MHz, Standard, International Electrotechnical Commission, 2007.
ISO 16063-43:2015: Methods for the calibration of vibration and shock transducers – Part 43: Calibration of accelerometers by model-based parameter identification, Standard, International Organization for Standardization, Geneva, CH, 2015.
Klaus, L., Arendacká, B., Kobusch, M., and Bruns, T.: Dynamic torque calibration by means of model parameter identification, Acta Imeko, 4, 39–44, 2015.
Kobusch, M., Eichstädt, S., Klaus, L., and Bruns, T.: Investigations for the model-based dynamic calibration of force transducers by using shock excitation, Acta Imeko, 4, 45–51, 2015.
Link, A. and Elster, C.: Uncertainty evaluation for IIR (infinite im-pulse response) filtering using a state-space approach, Meas. Sci. Technol., 20, 5 pp., 2009.
Link, A., Wabinski, W., and von Martens, H. J.: Identifikation von Beschleunigungsaufnehmern mit hochintensiven Stößen (Ac-celerometer Identification by High Shock Intensities), Tech. Mess., 72, 153–160, 2005.
Matthews, C., Pennecchi, F., Eichstädt, S., Malengo, A., Esward, T., Smith, I., Elster, C., Knott, A., Arrhén, F., and Lakka, A.: Math-ematical modelling to support traceable dynamic calibration of pressure sensors, Metrologia, 51, 326–338, 2014.
Ruhm, K. H.: Dynamics and stability – A proposal for related terms in Metrology from a mathematical point of view, Measurement, 79, 276–284, 2016.
Schäfer, A.: Dynamic Measurements as an Emerging Field in Indus-trial Metrology, in: PTB-Mitteilungen Traceable Dynamic Mea-surement of Mechanical Quantities, PTB-Mitteilungen, 2015. Schlegel, C., Kieckenap, G., Glöckner, B., Buß, A., and Kumme, R.:
Traceable periodic force calibration, Metrologia, 49, 224–235, 2012.
Wilkens, V. and Koch, C.: Amplitude and phase calibration of hy-drophones up to 70 MHz using broadband pulse excitation and an optical reference hydrophone, J. Acoust. Soc. Am., 115, 2892– 2912, 2004.