http://www.sciencepublishinggroup.com/j/ajdmkd doi: 10.11648/j.ajdmkd.20190402.11
ISSN: 2578-7810 (Print); ISSN: 2578-7837 (Online)
Data Mining Technique Used in Order to Analysis the
Capacitive Sensor
Nafise Masomi, Elham Ghanbari
*, Mohammad Taghi Adl
Department of Engineering, Yadegar-e-Imam Khomeini (RAH) Shahr-e-Rey Branch, Islamic Azad University, Tehran, Iran
Email address:
*
Corresponding author
To cite this article:
Nafise Masomi, Elham Ghanbari, Mohammad Taghi Adl. Data Mining Technique used in Order to Analysis the Capacitive Sensor.
American Journal of Data Mining and Knowledge Discovery.Vol. 4, No. 2, 2019, pp. 57-62. doi: 10.11648/j.ajdmkd.20190402.11 Received: May 31, 2019; Accepted: July 10, 2019; Published: October 23, 2019
Abstract:
Data mining, also referred to as knowledge extraction from databases, is one of the most important analytical methods for identifying the relationships between the various elements of the information collected in order to discover the useful knowledge and support of strategic decision-making and sustainable development systems in various industries. Mathematical modeling, quantitative analysis of data and new algorithms can identify new relationships between different data, which in turn leads to competitive advantage. Olive oil is one of the most important agricultural crops due to its digestive properties and economic status. However, olive oil production is a costly process which causes an expensive price of the final product. The most jobbery ways during olive oil production consist of mixing other oils such as maize, sunflower, Canola and corn into the olive oil. So, the aim of this study was to develop a dielectric-based system to Authenticate in olive oil using cylindrical capacitive sensor. For categorizing of fake olive oil by using frequency specification, Support vector machine, linear regression, Ensemble Trees and Gaussian was developed. A set of 16 samples of olive oil, sunflower, canola and corn oil which mixed with different ratio of Authentication, were used for calibration and evaluation of developed system.Keywords:
Data Mining, Regression, Olive Oil, Authentication1. Introduction
New information and communication technologies, as well as decision support technologies, can be very effective in providing timely, accurate, and relevant information to users by collecting, storing, evaluating, interpreting, analyzing, retrieving and disseminating information to specific users [1]. Data mining takes advantage of the progress made in artificial intelligence and statistics. Both of these areas work in model identification and data classification issues and will, in effect, be directly used in data mining, and both groups are active in identifying and using neural networks and decision trees [2].
Data mining simultaneously utilizes several disciplines such as artificial intelligence, machine learning, neural networks, statistics, pattern recognition, and science-based systems. Detecting the purity of different materials can be done in a variety of ways [3]. These methods are very
damaging, costly and time-consuming. In recent years, nondestructive methods have been considered in purification. The purpose of the development of these methods is to estimate the quantitative and qualitative characteristics of the materials rapidly, non-destructively and reliably [4].
plates of the capacitor are made of aluminum, zinc and silver, and among them, a dielectric can be placed in the air or other material. If the dielectric coefficient is bigger, it will be a better insulating property [6].
Based on the dielectric method, when a material is placed in the alternating electric field, the positive and negative charged particles in it will constantly tend to move in the electric field. Therefore, by measuring the dielectric coefficient, it is possible to extrapolate a lot of properties from the material [7]. The association of these properties with many quantitative and qualitative components of the product, high speed, low cost and high efficiency of its use as a new and non-destructive technology has been considered by many researchers to measure a wide range of qualitative and quantitative characteristics of agricultural products [8].
Olive oil that prevents heart failure and prevents the formation of cancer cells is not much used in our country. The latest statistics have shown that every Iranian consumes 100 grams of olive oil per year. One of the main reasons for this low consumption is the high price of this oil. When in a country where milk is eaten up by 30 percent as a result of a rise in the price of a few hundred tons, what else would you expect from a 60 to 80 thousand Riels per liter consumption of lubricants [9]? This high price, in addition to having an impact on consumption, has been motivated to enter the market for profits. This high price, in addition to having an impact on consumption, has been motivated to enter the market for profits [10]. The great benefit of mixing vegetable oils with lubricant makes it hard to find the type of product. Knowing the original oil is also not an easy task that anyone can handle. The second pertain to data mining algorithms; third part related to samples and used methods in the article. Also, processing of data and results were presented in fourth section [11].
2. Previous Work
Lizhi et al. (2010) conducted a research on olive oil for detecting adulteration using a dielectric spectrum. They used a 4V sine voltage in the range of 10Hz to 1 MHz to determine the dielectric properties of a binary mixture of olive oil. They also used the partial least squares model (PLS) to detect oil falsification. In addition, PCA has been used to classify virgin oil samples, separately from fake oils. The results of the PLS calibration model showed good results for the adulterated oils with soybean oil as a counterfeit oil. Also, the charts sorted by the method showed clear performance for all oil samples and easily categorize them in different clusters. From the result of this study it can be seen that the dielectric spectrum can be used to detect fake oils with different types of oils with a percentage of their mixture below 5% [12].
Soltani et al (2010) used a non-destructive capacitive method to detect the amount of banana fruit juice. The relationship between the rates of fruit dielectric constant in a frequency of 1 kHz to 10 MHz was investigated. The
results of the experiment showed that the dielectric constant is strongly affected by the size and volume of the fruit and also decreases with the increase in the fruit juice, which is clearer in a frequency of 1 MHz. The results of the prediction were satisfactory and the correlation coefficient between the actual yield and the expected value of the fruit was 0.85 [13].
Reggie et al. (2006) predicted egg quality parameters using its capacitive properties. They used 4-volt sin voltage with a frequency of 120 MHz and a rectangular parallel capacitor, which obtained capacitive capacitors (DCs) and voltages (DVs). Experiments were carried out on the day of laying, on the third day, on the sixth day, on the ninth and twelfth days after the laying. The results showed a significant difference between DC / DV ratio during storage period. This parameter had a good relationship with all the quality properties of eggs (elevation of the cell, height of albumin, etc.). Using this parameter and egg mass, they extracted regression models and reported that the application of this method to the egg production line and its grading based on quality properties requires more research [14].
Soltani et al. (2015) reported a research about egg grading using image and sensor processing. The correlation coefficients and the mean square error of the statistical indexes were 0.98 and 0.0006, respectively. They used a double-layer neural network with two inputs (large diameter and small diameter), a hidden slab and an outlet (egg volume) to predict the volume of eggs. 70% of the data was for network training, 15% for validation and 15% for the network testing. In order to select the best network, the number of hidden layer neurons was changed from 2 to 50 [15].
According to the researches that carried out in relation to the determination of the quality and content of agricultural products and food industries, it can be concluded that different methods have been developed to counteract the adulteration in these products. In this study, a recent study has been carried out to identify the authentication of olive oil.
3. Material and Method
In this article the experiment was done by olive, sunflower, Canola and corn oil. Then different classification algorithms by MATLAB software and various techniques such as support vector regression were done and finally output dates were processed.
3.1. Sample
and they made up a total of 9 classes with varying percentages (from 60 to 100% in 5% increments), each of which was shed separately, according to the desired amount, of 100 centimeters inside the sensor.
3.2. System
The device used consists of the Arduino board, ICL8083 and AD8302. The USB port is used to communicate or send and receive information between the device and the computer. Due to the high flow of data, the ch340g chip on the Arduino board is used to measure dielectric parameters as well as a device that can detect the purity of olive oil. The Arduino board is used on the Uno device, which uses the Atmega2560 microcontroller. When the microcomputer's components are placed in a chip and put together, a microcontroller is created. The microcontroller is an electronic application chip that can increase the speed and efficiency of the circuit versus reducing the volume and cost of the circuit. In general, the material of the constituent parts of the circuit is not important, but the mathematical relation between the voltage and current of these electrical components is important. Arduino has a variety of ports, controls, side panels, and screen connectivity, while it may be smaller, less expensive, and possibly faster than a microcomputer system.
The AD8302 chipset has been used to measure the domain and fuzzy detection, as well as to measure the dielectric parameters. The AD8302 phase detection chip provides a simple method for measuring the input ratio of the domain and the phase difference of the two signals simultaneously (22). The features of this chip include a very small component, a wide frequency range. (Figure 1.)
Figure 1. Diagram of dielectric system.
3.3. Support Vector Machine (SVM)
Support Vector Machine Regression (SVR) aims at finding a linear hyper plane, which fits the multidimensional input vectors to output values. One of the new ideas in identifying and categorizing patterns is a backup vector machine or SVM.
Backup machines have very valuable properties that make it suitable for pattern recognition. In particular, SVM does not have the problem of local optimization in its training, it builds the categorizer with maximum generalization, determines its structure and topology optimally, and functions nonlinear differentiation easily with low computing using It forms the concept of an inner product in the Hilbert space.
3.4. Linear Regression
Regression analysis is the most widely used method among statistical techniques. Initially, the analyst assumes that there is a kind of relationship between two variables; in fact, it guesses that a relationship exists as a line between two variables, and then it collects quantitative information from two variables, and these data Draws points in a two-dimensional graph. If the graph shows that the data are roughly (not necessarily accurate) scattered along a straight line, then the confirmed analyzer conjecture. There is a difference between some of the points and their image on the quantitative regression line, which we regard as the estimated error. This error may be due to errors in measurement, environmental conditions, natural differences, and so on.
3.5. Gaussian
Categorizers use the categorization of their own criteria to implement the classification process, and thus do not need additional information, but in contrast to the observer categories, in addition to the internal criteria for convergence, the need for Additional data. This supplementary information is the training data that the classmate must necessarily receive on training.
4. Result and Discussion
After providing adulterated samples and pouring them into a capacitive sensor, output data was analyzed by MATLAB software. The results were predicted and modeled using regression methods.In this article two factors (gain voltage and phase shift voltage) were measured. It is noticed that The AD8302 measures the magnitude ratio, defined here as gain, and phase difference between two signals. A pair of matched logarithmic amplifiers provides the measurement, and their hard-limited outputs drive the phase detector.
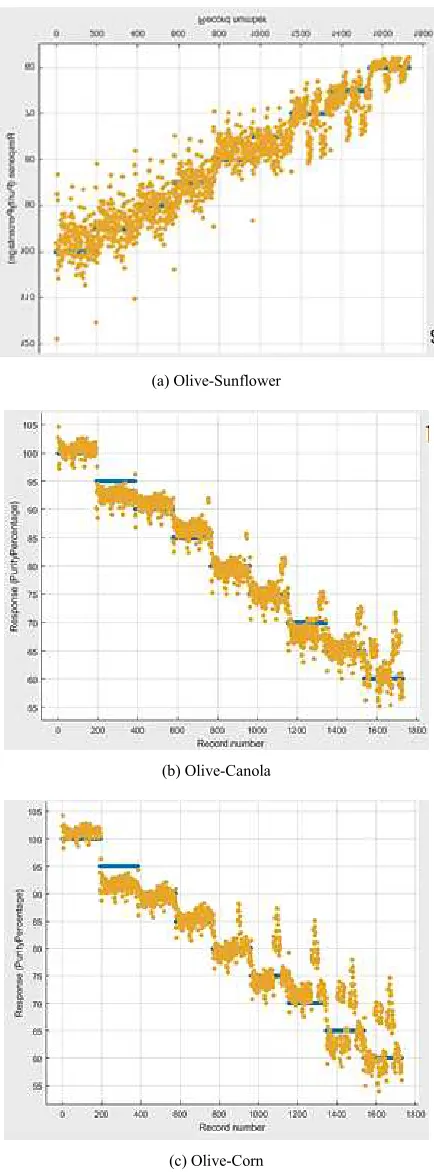
4.1. SVMs
(a) Olive-Sunflower
(b) Olive-Canola
(c) Olive-Corn
Figure 2. Response figure in range of record of Authentication of oil.
4.2. Linear Regression
Figure 3 shows the results of adulterated oil linear regression. According to the results, Most R2 related to Olive- Canola (0.96) and the least amount of R2 pertain to Olive-Sunflower (0.89). Also, in regard to the amount of RMSE, result has shown 4.29, 2.54, and 3.40 for
Olive-Sunflower, Olive- Canola and Olive-corn, respectively.
(a) Olive-Sunflower
(b) Olive-Canola
(c) Olive-Corn
Figure 3. Actual and dielectric predicted concentration of the oils used for
Authentication of oil.
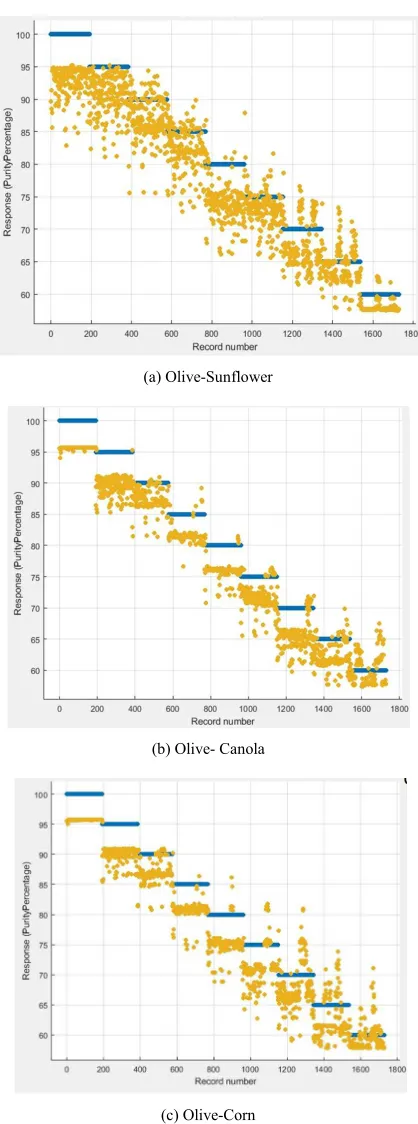
4.3. Gaussian
this technique, the amount of RMSE for the samples were equal to 3.56, 2.45, 3.05 and the amount R2 was equal to 0.92, 96 and 94, respectively.
(a) Olive-Sunflower
(b) Olive-Canola
(c) Olive-Corn
Figure 4. Response figure in range of record of Authentication of oil.
4.4. Ensemble Trees
Figure 5 shows the results of adulterated oil boosted tree regression. According to the results, Most R2 related to Olive- Canola (0.90) and the least amount of R2 pertain to Olive-Sunflower (0.86). Also, in regard to the amount of RMSE, result has shown 4.81, 2.54, and 4.38 for Olive-Sunflower, Olive- Canola and Olive-corn, respectively.
(a) Olive-Sunflower
(b) Olive- Canola
(c) Olive-Corn
Figure 5. Actual and dielectric predicted concentration of the oils used for
5. Conclusion
In the current research, three different techniques were applied to predict olive oil adulterated. Comparison of the testing stage of these techniques showed coarse tree was the best prediction. Interestingly, olive-Canola oil samples predicted with high accuracy in all techniques. As regards, the accuracy of the methods are close together, this can be concluded that all selected techniques, presented here, have a good potential to be used to determine olive oil fraud. Also device used can classify samples and use for other oils. As regards, the accuracy of the methods are close together, this can be concluded that all selected techniques, presented here, have a good potential to be used to determine olive oil fraud.
References
[1] Ramesh, D., & Vardhan, B. V. (2015). Analysis of crop yield prediction using data mining techniques. I nternational Journal of Research in Engineering and Technology, 4 (1), 47-473.
[2] Patel, H., & Patel, D. (2014). A brief survey of data mining techniques applied to agricultural data. International Journal of Computer Applications, 95 (9).
[3] Bharadi, V. A., Abhyankar, P. P., Patil, R. S., Patade, S. S., Nate, T. U., & Joshi, A. M. (2017). Analysis and Prediction in Agricultural Data using Data Mining Techniques. International Journal of Research in Science and Engineering, 386-393.
[4] Tayyebi, A., & Pijanowski, B. C. (2014). Modeling multiple land use changes using ANN, CART and MARS: Comparing tradeoffs in goodness of fit and explanatory power of data mining tools. International Journal of Applied Earth Observation and Geoinformation, 28, 102-116.
[5] Sahu, V., Pandey, A., Khan, M. Z., Mishra, V., & Shrivastava, A. K. (2018). Role of Dielectric Behaviour of Soil in Agriculture with Reference to Pond Area. Journal of Pure Applied and Industrial Physics, 8 (6), 62-65.
[6] Mahani, R., Atia, F., Al Neklawy, M. M., & Fahem, A. (2016). Dielectric spectroscopic studies on the water hyacinth plant collected from agriculture drainage. Spectrochimica Acta Part A: Molecular and Biomolecular Spectroscopy, 162, 81-85.
[7] Bertrand, S. (2018). Dielectric Properties of a Protein Probed by Reversal of a Buried Ion Pair. Journal of physical chemistry.
[8] Gaikwad, S. V., Gaikwad, A. N., Harsh, R., & Gupta, A. (2015). Simulation modeling and implementation of RF and MW system to control the insect pests in agriculture. In India Conference (INDICON), pp. 1-4. IEEE.
[9] Rodriguez-Morato, J., Xicota, L., Fito, M., Farre, M., Dierssen, M., & de la Torre, R. (2015). Potential role of olive oil phenolic compounds in the prevention of neurodegenerative diseases. Molecules, 20 (3), 4655-4680.
[10] García, A., Rodríguez-Juan, E., Rodríguez-Gutiérrez, G., Rios, J. J., & Fernández-Bolaños, J. (2016). Extraction of phenolic compounds from virgin olive oil by deep eutectic solvents (DESs). Food chemistry, 197, 554-561.
[11] Guasch-Ferré, M., Hu, F. B., Martínez-González, M. A., Fitó, M., Bulló, M., Estruch, R.,. & Fiol, M. (2014). Olive oil intake and risk of cardiovascular disease and mortality in the PREDIMED Study. BMC medicine, 12 (1), 78.
[12] Lizhi, H., Toyoda, K., & Ihara, I. (2010). Discrimination of olive oil adulterated with vegetable oils using dielectric spectroscopy. Journal of Food Engineering, 96 (2), 167-171.
[13] Soltani, M., Alimardani, R., & Omid, M. (2010). A new mathematical modeling of banana fruit and comparison with actual values of dimensional properties. Modern Applied Science, 4 (8), 104.
[14] Ragni. L, P. Gradari, A. Berardinelli, A. Giunchi, and A. Guarnieri. (2006). Predicting quality parameters of shell eggs using a simple technique based on the dielectric properties. Biosystems Engineering, 94, 255–262.