R E S E A R C H
Open Access
Validation of a health screening
questionnaire for primary care using
Rasch models
Jonathan David Comins
1,2,6*, Kirsten Schierup Freund
5, Karl Bang Christensen
4, Jørgen Lous
5and John Brodersen
1,3Abstract
Background:Health inequality is on the rise due to various social and individual factors. While preventive health checks (PHC) aim to counteract health inequality, there is robust evidence against the use of PHC in general practice. It is unknown which factors can identify persons who will benefit from preventive interventions that are more beneficial than harmful. Hence, valid screening instruments are needed.
Methods:The aim of this study was to assess the psychometric properties of a screening questionnaire (SQ-33), which targets vulnerable persons in primary care practice who can benefit from preventive consultations. Survey data were acquired from 20 primary care clinical practices in the Northern Region of Jutland, Denmark.
Respondents were 2056 persons between 20 and 44 years old who, for any reason, consulted their family doctor. The psychometric properties of the SQ-33 were assessed using Rasch item response modelling. Follow-up analysis was performed on a subsample of 364 persons one year subsequent to initial inclusion, in order to assess
responsiveness and predictive validity using a general health anchor item.
Results:Twenty-three of the SQ-33 items in four subscales fit a Graphical loglinear Rasch model (GLLRM) at baseline and follow-up, thus confirming the scaling properties. The modified 23-item version (HSQ-23) revealed superior responsiveness and predictive validity compared with the SQ-33.
Conclusions:The Health Screening Questionnaire (HSQ-23) was shown to possess adequate psychometric properties and responsiveness and can thus be used as an outcome measure in preventive intervention studies. Future study should address whether the HSQ-23 successfully identifies patients who will benefit from PHC consultations.
Keywords:Primary care practice, Preventive health checks, Consultation process, Clinical interventions, Screening questionnaires, Psychometric properties
Background
Preventive health checks (PHC) has been a controversial topic for at least a decade [1,2]. There is presently sub-stantial evidence against the use of PHC questionnaires used for screening in primary care medicine [1]. Screen-ing programs can be justifiably implemented so long as the instrument is capable of identifying persons who will benefit from some preventive intervention. However, benefits of screening must always outweigh harms, for
example due to unnecessary interventions or overdiag-nosis [3–5]. In Denmark, health inequality is on the rise [6], which can be attributed to various social and indi-vidual factors [6]. Numerous screening strategies and se-lection criteria have been applied to identify persons at risk of developing life-threatening or functionally debili-tating chronic diseases [7–9]. These strategies include stratifying the general population by age, gender, job-type, financial and sociodemographic factors, as well as specific diagnoses. Nevertheless, while screening in-struments should identify persons at risk who can benefit from a preventative intervention, they must not increase the risk of harm by introducing unnecessary diagnoses and treatments [3]. In addition, the * Correspondence:[email protected]
1
Centre of Research and Education in General Practice, University of Copenhagen, Copenhagen, Denmark
2Department of Rheumatology, Zealand University Hospital, Køge, Denmark
Full list of author information is available at the end of the article
instrument must possess acceptable diagnostic test ac-curacy and consist of meaningful indicators for the tar-get population in order to enhance self-efficacy.
A previous paper describes the development and im-plementation of a PHC screening instrument for vulner-able persons, called the Screening Questionnaire (SQ-33) [10]. The SQ-33 was developed to assess factors important to health, disease management, and child de-velopment using theories of salutogenesis, hierarchy of needs, and self-evaluated health [10]. For a full descrip-tion of the development of the original SQ-33 quesdescrip-tion- question-naire, and more context, the reader is referred to Freund and Lous (2012) and Hansen et al. (2014) [11,12].
The domains of the SQ-33 address aspects of Personal Resources (9 items), Lifestyle (8 items), Family Life (10 items), and Relationship with one’s Children) (6 items). The study revealed that a third of the screened popula-tion noted difficulties on at least seven of the 33 items [10], and a parallel study found that a number of SQ-33 items correlated positively with certain social and med-ical conditions and disease states [13]. The results of a 1-year follow-up survey showed that participants ran-domly assigned to a package of two follow-up consulta-tions with the GP had fewer social problems and an improved sense of psychological well-being compared with controls, as measured by the SF-12 Mental Health Component subscale [11,12]. This indicates a beneficial impact on these variables. However, evidence of prevent-ive effects on morbidity and mortality remains to be seen.
The SQ-33 screening instrument is a self-report ques-tionnaire where the categorical responses to each item are numericized and summed to a composite score. Summa-tion of raw item scores into a single index (i.e., a unidi-mensional scale) [14] assumes that each item describes a different aspect of the underlying latent trait [15–17]. The summated score is then used as a measure of the degree to which a person with limited resources is at risk of de-veloping a disease, which in turn can affect a person’s health-related quality-of-life (HRQoL).
Item Response Theory (IRT) models are popular and robust statistical tools for validation of scales used to measure HRQoL. IRT models add interesting features to measurement provided adequate data-model fit [18]. Item analyses using Rasch IRT explore in depth which items belong to a single dimension and how items in-cluded in each dimension are interrelated and ordered on a latent trait [19, 20]. Good scales exhibit adequate spread along the dimension of interest and are un-affected by subgroups in the population across sociode-mographic factors like gender and age [16, 21]. Such person factor bias is known as differential item function-ing (DIF) which can undermine the scale if not ad-dressed [22–25]. Local response dependence (LD) is
another source of bias that can result in lack of fit to a Rasch model [26]. LD is seen when items are too highly correlated, as items should only be correlated through the latent variable that is being measured [26]. Loglinear Rasch models permit some level of uniform DIF and LD and yet still yield robust scales [27,28].
Reliability coefficients such as Cronbach’s alpha are often used to estimate measurement error and scale preci-sion at the group level [29, 30]. However, using them to interpret scores at the level of the individual patient is problematic [31], as well as the use of alpha as an estimate of reliability based on a single survey administration [32]. When the purpose of screening instruments is to identify individuals above or below some predetermined cut point, the use of standard error of measurement (SEM) [33] is crucial in order to assess a respondent’s location on a scale relative to that cut point [31,34].
At present, rigorously validated self-report screening in-struments that target vulnerable persons are not available. Notwithstanding, considerable political emphasis has been placed on developing methods to identify premorbid vulnerable persons in order to create interventions that can prevent health inequity and morbidity, and improve HRQoL [7,9, 11]. Hence, there is a demand for validated self-report measures that consist of relevant indicators which can discriminate between vulnerable and non-vulnerable persons in primary care settings [35,36].
Purpose
The purpose of this study was to apply Rasch IRT models to assess the psychometric properties and criter-ion validity of the SQ-33 as applied to a sample of per-sons consulting primary care physicians in the Northern Jutland county of Denmark.
Material and methods
Analysis strategy
A graphical loglinear Rasch model (GLLRM) was fitted to the proposed subscales [27]. The item screening pro-cedure described by Kreiner and Christensen (2011) [28] was used to identify subscales with adequate fit. Overall model fit was evaluated using Andersen’s conditional likelihood ratio (CLR) test [37], which assesses measure-ment invariance across groups defined by total score, gender, and age. Individual item fit was assessed by com-paring observed and expected item rest-score correla-tions [28, 38,39] and by conditional versions of the infit and outfit item fit statistics [28, 38]. A thorough tech-nical description of the criteria used to determine item fit is presented in Kreiner and Christensen (2011) [28]. Measurement precision was evaluated using standard error of measurement (SEM) for the derived scales [33, 40]. The measurement models resulting from the above described procedures were tested in the 1-year follow-up data and the predictive validity of the original 33-item and the reduced versions were compared. Predictive validity evidence refers to the level of correlation between sum-mated domain scores and the anchor item, which is assessed by studying associations between changes in the
Fig. 1The Graphical loglinear Rasch models
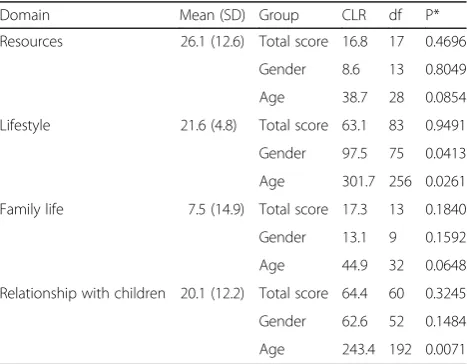
Table 1Mean, SD, and over-all model fit evaluated by Andersen’s conditional likelihood ratio (CLR) for each domain
Domain Mean (SD) Group CLR df P*
Resources 26.1 (12.6) Total score 16.8 17 0.4696
Gender 8.6 13 0.8049
Age 38.7 28 0.0854
Lifestyle 21.6 (4.8) Total score 63.1 83 0.9491
Gender 97.5 75 0.0413
Age 301.7 256 0.0261
Family life 7.5 (14.9) Total score 17.3 13 0.1840
Gender 13.1 9 0.1592
Age 44.9 32 0.0648
Relationship with children 20.1 (12.2) Total score 64.4 60 0.3245
Gender 62.6 52 0.1484
Age 243.4 192 0.0071
domain scores with the changes in an anchor item that evaluates general health. The association was calculated as partial Spearman rank correlations adjusting for baseline values of the anchor item.
Change scores were calculated as standardized effect size (ES) (i.e., the difference between baseline and follow-up scores relative to the standard deviation of baseline scores) [41, 42].
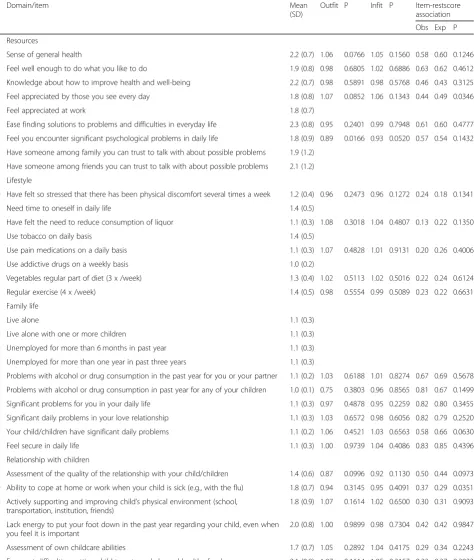
Table 2Details of the item analysis
Domain/item Mean
(SD)
Outfit P Infit P Item-restscore association
Obs Exp P
Resources
1 Sense of general health 2.2 (0.7) 1.06 0.0766 1.05 0.1560 0.58 0.60 0.1246
2 Feel well enough to do what you like to do 1.9 (0.8) 0.98 0.6805 1.02 0.6886 0.63 0.62 0.4612
3 Knowledge about how to improve health and well-being 2.2 (0.7) 0.98 0.5891 0.98 0.5768 0.46 0.43 0.3125
4 Feel appreciated by those you see every day 1.8 (0.8) 1.07 0.0852 1.06 0.1343 0.44 0.49 0.0346
5 Feel appreciated at work 1.8 (0.7)
6 Ease finding solutions to problems and difficulties in everyday life 2.3 (0.8) 0.95 0.2401 0.99 0.7948 0.61 0.60 0.4777
7 Feel you encounter significant psychological problems in daily life 1.8 (0.9) 0.89 0.0166 0.93 0.0520 0.57 0.54 0.1432
8 Have someone among family you can trust to talk with about possible problems 1.9 (1.2)
9 Have someone among friends you can trust to talk with about possible problems 2.1 (1.2)
Lifestyle
10 Have felt so stressed that there has been physical discomfort several times a week 1.2 (0.4) 0.96 0.2473 0.96 0.1272 0.24 0.18 0.1341
11 Need time to oneself in daily life 1.4 (0.5)
12 Have felt the need to reduce consumption of liquor 1.1 (0.3) 1.08 0.3018 1.04 0.4807 0.13 0.22 0.1350
13 Use tobacco on daily basis 1.4 (0.5)
14 Use pain medications on a daily basis 1.1 (0.3) 1.07 0.4828 1.01 0.9131 0.20 0.26 0.4006
15 Use addictive drugs on a weekly basis 1.0 (0.2)
16 Vegetables regular part of diet (3 x /week) 1.3 (0.4) 1.02 0.5113 1.02 0.5016 0.22 0.24 0.6124
17 Regular exercise (4 x /week) 1.4 (0.5) 0.98 0.5554 0.99 0.5089 0.23 0.22 0.6631
Family life
18 Live alone 1.1 (0.3)
19 Live alone with one or more children 1.1 (0.3)
20 Unemployed for more than 6 months in past year 1.1 (0.3)
21 Unemployed for more than one year in past three years 1.1 (0.3)
22 Problems with alcohol or drug consumption in the past year for you or your partner 1.1 (0.2) 1.03 0.6188 1.01 0.8274 0.67 0.69 0.5678
23 Problems with alcohol or drug consumption in past year for any of your children 1.0 (0.1) 0.75 0.3803 0.96 0.8565 0.81 0.67 0.1499
24 Significant problems for you in your daily life 1.1 (0.3) 0.97 0.4878 0.95 0.2259 0.82 0.80 0.3455
25 Significant daily problems in your love relationship 1.1 (0.3) 1.03 0.6572 0.98 0.6056 0.82 0.79 0.2520
26 Your child/children have significant daily problems 1.1 (0.2) 1.06 0.4521 1.03 0.6563 0.58 0.66 0.0630
27 Feel secure in daily life 1.1 (0.3) 1.00 0.9739 1.04 0.4086 0.83 0.85 0.4396
Relationship with children
28 Assessment of the quality of the relationship with your child/children 1.4 (0.6) 0.87 0.0996 0.92 0.1130 0.50 0.44 0.0973
29 Ability to cope at home or work when your child is sick (e.g., with the flu) 1.8 (0.7) 0.94 0.3145 0.95 0.4091 0.37 0.29 0.0351
30 Actively supporting and improving child’s physical environment (school, transportation, institution, friends)
1.8 (0.9) 1.07 0.1614 1.02 0.6500 0.30 0.31 0.9093
31 Lack energy to put your foot down in the past year regarding your child, even when you feel it is important
2.0 (0.8) 1.00 0.9899 0.98 0.7304 0.42 0.42 0.9847
32 Assessment of own childcare abilities 1.7 (0.7) 1.05 0.2892 1.04 0.4175 0.29 0.34 0.2243
In order to facilitate comparison of scores across domains, a linear transformation to a zero to 100 scale was used to re-port domain scores and standard error of measurement.
GLLRM was performed using the software program DIGRAM [39].
Results
Resources
The GLLRM item screening procedure for all nine items (items 1 to 9) indicated massive evidence of positive LD, whereupon no model with satisfactory fit was identified. After deleting items 5, 8, and 9, a relatively parsimonious GLLRM (top left panel in Fig. 1) and adequate overall model fit was identified (Table1).
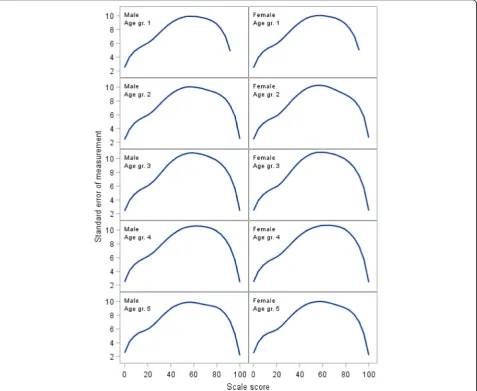
Individual item fit statistics for the GLLRM analysis are shown in Table2. Measurement error quantified as the standard error of measurement (SEM) is shown in
Fig.2. The figure illustrates how measurement error for
an individual patient can approach 10 points on the zero to 100 scale and differs slightly across gender and age groups.
Lifestyle
For the eight lifestyle items, the GLLRM item screening procedure could not identify a model with satisfactory fit for all items. After deletion of items 11, 13, and 15, a GLLRM was identified (Fig. 1, top right panel). Overall model fit was acceptable (Table 1). Individual item fit statistics are shown in the Table 2. The SEM for the GLLRM scale shows that measurement error is ex-tremely large across all age and gender groups (Fig.3).
Family life
The item screening did not identify a model with satis-factory fit for the original 10 item scale. After removal of
items 18, 19, 20, and 21, a scale consisting of six items was identified (Fig. 1, bottom left panel). Overall model fit was acceptable (Table1). Individual item fit statistics are shown in Table 2. The SEM for the GLLRM scale shows that measurement error is very large across all age and gender groups (Fig.4).
Relationship with child/children
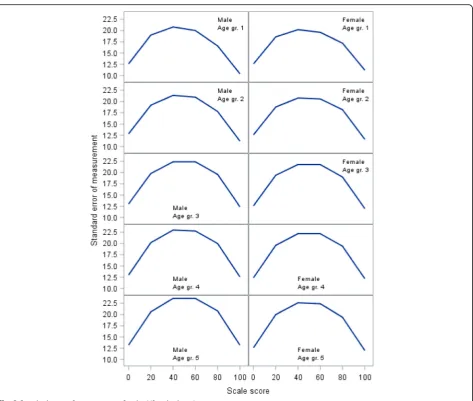
The GLLRM item screening procedure indicated that a scale for all six items had satisfactory fit (Table 1). The SEM is shown in Fig.5and demonstrates that measurement error is also very large across all age and gender groups.
Follow-up data
GLLRMs for the four scales identified in the baseline data were confirmed in the follow-up data (results not shown). The standardized effect sizes for the original and for the revised scales are of the same magnitude for all four do-mains. However, the revised scales consistently show
stronger associations with change in the anchor item (see Table3). Table3shows the fit statistics.
Discussion
awareness of how to improve health), which of course is a source of confounding. The fact that men and women respond differentially may warrant DIF equating, as de-scribed by Brodersen et al. (2006) [22], in order to quantify the level of discrepancy between genders and compensate in futures studies across groups.
Figures2,3, and 4demonstrate how measurement error distributed across the scale is problematic at the level of an individual respondent, as SEM varies substantially along the scale, reaching peak values in the midrange that are at least twice the magnitude of the low and high ends of the scale. While this is common [31], it has implications for the interpretation of individual scores, as confidence intervals expand with increasing SEM [34]. Hence, depending on an individual’s sum score (i.e., the person’s location on the scale), the uncertainty around the score can differ substan-tially, which jeopardizes conclusions based on cut points.
Ten of the 33 items did not fit a Rasch model and were removed from the a priori proposed subscales. There can
be different reasons for this misfit. For example, two items belonged to the domain of Lifestyle and addressed sub-stance abuse (tobacco and addictive drugs). A potential reason could be that persons with substance abuse are re-luctant to respond to questions addressing abuse [43], or the ability to discern the level and influence of the abuse might be distorted by that very abuse or denial [44]. The theme of substance abuse is also captured by items 22 and 23 (alcohol and drug) in the domain of Family Life, so the content does not disappear from the instrument.
It must be noted that items that misfit should be re-moved from subscales, as they do not contribute to the scaling properties. However, items can always be retained as single items. Thus, information concerning for example a patient’s perceived need to use tobacco on a daily basis can be kept as a single item (and not hidden away inside a scale that possibly measures something else). It is thus the practitioner’s prerogative to use the single item for qualita-tive assessment.
Other reasons for misfit could stem from local de-pendence. For example, GLLRM revealed LD between item 1 (sense of general health) and item 2 (feel well enough to do what you like). This makes sense, as both items address general health. Item 3 (knowledge about health) and item 4 (feel appreciated by those you see every day) do not necessarily intuitively address the same topics. It may indicate that cohabitation with fam-ily and proximity to friends and colleagues can influence health literacy and self-efficacy.
Poor scaling properties can also be due to the phrasing of the question or the response options [36]. For example, items 18–27 are dichotomous (yes/no). While 6 of these items in fact formed a Rasch scale (items 22–27), dichot-omous items may lack nuances that an ordinal response structure capture. Respondents must have adequate response options in order to meaningfully address the item themes. Such qualitative issues can be tackled in face-to-face interviews with the target group in future ex-plorative studies.
Fig. 5Standard error of measurement for the Relationship with Children domain
Table 3Effect size (ES) and Spearman’s rho for the original and for the revised domain scores
SQ-33 HSQ-23
Domain ES (95% CI) rho (95% CI) ES (95% CI) rho (95% CI)
Resources −0.32 (−0.42 to−0.22) 0.46 (0.38 to 0.54) −0.42 (−0.52 to−0.32) 0.54 (0.46 to 0.61)
Lifestyle −1.84 (−1.93 to−1.74) 0.00 (−0.10 to 0.11) −1.45 (−1.54 to−1.35) 0.05 (−0.06 to 0.15)
Family life −1.05 (−1.15 to−0.96) 0.10 (0.00 to 0.20) −0.84 (−0.93 to−0.74) 0.11 (0.01 to 0.22)
A weakness with this study is that follow-up data for just 495 out of the original 2056 persons was obtained (of which 364 participated in follow-up), in that personal identification numbers were registered only for patients with more than seven problems on the SQ-33 in the ori-ginal collection of data. The rationale behind including persons with 7 or more problems on the SQ-33 for follow-up stems from an a priori assumption by Freund and Lous (2012) that these persons could be classified as ‘vulnerable’[10,12,13]. Excluding the majority of subjects can introduce a bias if the scale is not psychometrically sound. However, the measurement properties of the re-duced scales were tested and confirmed in the available follow-up data, and the predictive validity of the revised version was confirmed. Thus, we can conclude that HSQ-23 performs better as a psychometric instrument than the SQ-33 and is responsive to clinical change (as seen by the standardized effect sizes in Table3).
Conclusion
Rasch IRT models were used to assess the psychometric properties of the four subscales of the SQ-33 screening questionnaire as applied to persons from the region of Northern Jutland in Denmark. A 23 item version was found to possess adequate psychometric properties and anchor based criterion validation showed responsiveness to clinical change. The revised instrument, the Health Screening Questionnaire 23 (HSQ-23), is appropriate for monitoring the constructs of Resources, Lifestyle, Family Life, and Relationship with children. These scales can be used for outcome assessment in studies of preventive in-terventions. Whether the scales possess predictive value for specific types of morbidity and mortality is a topic of future investigation.
Abbreviations
CLR:Conditional likelihood ratio; DIF: Differential item functioning; ES: Effect size; GLLRM: Graphical loglinear Rasch model; GP: General practitioner;
HRQoL: Health-related quality-of-life; HSQ-23: Health Screening Questionnaire; IRT: Item response theory; LD: Local dependence; PHC: Preventive health checks; SEM: Standard error of measurement; SQ-33: Screening Questionnaire
Acknowledgements Not applicable.
Funding
JDC and KSF received support from the Danish General Practice Research Foundation (PLU 541305 and PLU–FF-2-01-284 respectively).
Availability of data and materials
The datasets used and analyzed during the current study are available from the corresponding author upon reasonable request.
Authors’contributions
All authors contributed to the study design. JDC primarily drafted the manuscript. All authors contributed to and approved the manuscript. KBC, JDC, and JB conducted the statistical analyses. KSF and JL were responsible for data collection.
Ethics approval and consent to participate
The study complied fully with Danish data and research regulations and permissions. The Danish ethics committee waives the need for ethical approval in survey studies. Written informed consent from all respondents was obtained upon inclusion. The study was registered with
ClinicalTrials.gov. Registration: NCT 01231256.
Consent for publication Not applicable.
Competing interests
The authors declare that they have no competing interests.
Publisher’s Note
Springer Nature remains neutral with regard to jurisdictional claims in published maps and institutional affiliations.
Author details
1Centre of Research and Education in General Practice, University of
Copenhagen, Copenhagen, Denmark.2Department of Rheumatology, Zealand University Hospital, Køge, Denmark.3Zealand Region Primary Health
Care Research Unit, Sorø, Denmark.4Department of Public Health, Section of
Biostatistics, University of Copenhagen, Copenhagen, Denmark.5Research
Unit of General Practice, Institute of Public Health, University of Southern Denmark, Odense, Denmark.6Department of Orthopedic Surgery and Sports
Traumatology, Bispebjerg Hospital, Copenhagen, Denmark.
Received: 24 July 2018 Accepted: 7 February 2019
References
1. Gotzsche, P. C., Jorgensen, K. J., & Krogsboll, L. T. (2014). General health checks don't work.BMJ, 348, g3680.
2. Krogsboll, L. T., Jorgensen, K. J., & Gotzsche, P. C. (2013). General health checks in adults for reducing morbidity and mortality from disease.JAMA, 309, 2489–2490.
3. Brodersen, J., Jorgensen, K. J., & Gotzsche, P. C. (2010). The benefits and harms of screening for cancer with a focus on breast screening.Pol Arch Med Wewn, 120, 89–94.
4. Brodersen, J., Thorsen, H., McKenna, S., & Doward, L. (2005). Assessing psychosocial/quality of life outcomes in screening: How do we do it better?
J Epidemiol Community Health, 59, 609.
5. McCaffery, K. J., Jansen, J., Scherer, L. D., Thornton, H., Hersch, J., Carter, S. M., et al. (2016). Walking the tightrope: Communicating overdiagnosis in modern healthcare.BMJ, 352, i348.
6. Sundhedsstyrelsen. [Inequality in health- reasons and efforts] Ulighed i Sundhed - årsager og indsatser. Copenhagen-DK Denmark: Sundhedsstyrelsen; 2011.
7. Bender, A. M., Jorgensen, T., Helbech, B., Linneberg, A., & Pisinger, C. (2014). Socioeconomic position and participation in baseline and follow-up visits: The Inter99 study.Eur J Prev Cardiol, 21, 899–905.
8. Engberg, M., Christensen, B., Karlsmose, B., Lous, J., & Lauritzen, T. (2002). General health screenings to improve cardiovascular risk profiles: A randomized controlled trial in general practice with 5-year follow-up.J Fam Pract, 51, 546–552.
9. Niederdeppe, J., Fiore, M. C., Baker, T. B., & Smith, S. S. (2008). Smoking-cessation media campaigns and their effectiveness among
socioeconomically advantaged and disadvantaged populations.Am J Public Health, 98, 916–924.
10. Freund, K. S., & Lous, J. (2002). Potentially marginalized 20-44-years-olds in general practice. Who are they? The results of a questionnaire screening.
Ugeskr Laeger, 164, 5367–5372.
11. Freund, K. S., & Lous, J. (2012). The effect of preventive consultations on young adults with psychosocial problems: A randomized trial.Health Educ Res, 27, 927–945.
12. Hansen, E., Fonager, K., Freund, K. S., & Lous, J. (2014). The impact of non-responders on health and lifestyle outcomes in an intervention study.BMC Res Notes, 7, 632.
13. Diderichsen, F., Andersen, I., & Manual, C. (2011). Ulighed i Sundhed -aarsager og indsatser.Koebenhavn, 2011.
15. Birnbaum, A. (1968).Some latent trait models and their use in inferring an examinee's ability. Statistical Theories of Mental Test Scores. Reading, Mass. Addison-Wesley.
16. Irtel, H., & Schmalhofer, F. (1981). Psychological diagnosis from ordinal scale levels: Measurement theory principles, model test and parameter estimation.Arch Psychol (Frankf), 134, 197–218.
17. Rasch, G. (1960).Probabilistic models for some intelligence and attainment tests. Copenhagen: Danish National Institute for Educational Research. 18. Christensen, K. B., & Kreiner, S. (2007). A Monte Carlo approach to
unidimensionality testing in polytomous Rasch models.Appl Psych Meas, 31, 20–30.
19. Andrich, D. (2002). Understanding resistance to the data-model relationship in Rasch's paradigm: A reflection for the next generation.J Appl Meas, 3, 325–359.
20. Andrich, D. (2004). Controversy and the Rasch model: A characteristic of incompatible paradigms?Med Care, 42, I7–16.
21. Wolfe, F., & Kong, S. X. (1999). Rasch analysis of the Western Ontario MacMaster questionnaire (WOMAC) in 2205 patients with osteoarthritis, rheumatoid arthritis, and fibromyalgia.Ann Rheum Dis, 58, 563–568. 22. Brodersen, J., Meads, D. M., Kreiner, S., Thorsen, H., Doward, L., & McKenna, S.
P. (2007). Methodological aspects of differential item functioning in the Rasch model.J Med Econ, 10, 309–324.
23. Comins, J. D., Krogsgaard, M. R., Kreiner, S., & Brodersen, J. (2013). Dimensionality of the knee numeric-entity evaluation score (KNEES-ACL): A condition-specific questionnaire.Scand J Med Sci Sports, 23, e302–e312. 24. Kreiner, S. (2007). Validity and objectivity: Reflections on the role and nature
of Rasch models.Nordic Psychology, 59, 268–298.
25. Kreiner S. Rasch models: validity, sufficiency and–in principle– objectivityhttp://www.bmj.com/content/346/bmj.f232/rr/637148. BMJ rapid response. 2013.
26. Kreiner, S., & Christensen, K. B. (2004). Analysis of local dependence and multidimensionality in graphical Loglinier Rasch models.Communications in Statistics, 33, 1276.
27. Kelderman, H. (1984). Logliniear Rasch model tests.Psychometrika, 49, 223–245.
28. Kreiner, S., & Christensen, K. B. (2011). Item screening in graphical Loglinier Rasch models.Psychometrika, 76, 228–256.
29. Chronbach, L. J. S., & J, R. (2004). My current thoughts on coefficient alpha and successor procedures.Educ Psychol Meas, 64, 391–418.
30. Tavakol, M., & Dennick, R. (2011). Making sense of Cronbach's alpha.Int J Med Educ, 2, 53–55.
31. Harvill, L. M. (1991). Standard error of measurement.Instructional Topics in Educational Measurement, 10, 33–41.
32. Sijtsma, K. (2009). On the use, the misuse, and the very limited usefulness of Cronbach's alpha.Psychometrika, 74, 107–120.
33. Dierick, F., Aveniere, T., Cossement, M., Poilvache, P., Lobet, S., & Detrembleur, C. (2004). Outcome assessment in osteoarthritic patients undergoing total knee arthroplasty.Acta Orthop Belg, 70, 38–45. 34. Wilson, M. (2005).Constructing measures. London: Lawrence Erlbaum
Associates.
35. Godlee, F. (2012). Outcomes that matter to patients.BMJ.
36. Streiner, D. L. (2008). G.R. N. Health measurement scales - a practical guide to their development and use. InOxford: Oxford University press. 37. Andersen, E. B. (1973). Goodness of fit test for Rasch model.Psychometrika,
38, 123–140.
38. Kreiner, S. (2011). A note on item-rescore association in Rasch models.Appl Psychol Meas, 35, 557–561.
39. Kreiner, S., & Nielsen, T. (2007).Item analysis in Digram - notes on the use of DIGRAM for item analysis by graphical loglinear Rasch models. Department of Biostatistics - University of Copenhagen.
40. Kreiner, S., & Christensen, K. B. (2013).Person Parameter Estimation and Measurement in Rasch Models. Rasch Models in Health Hoboken, NJ(pp. 63– 78). USA: John Wiley & Sons, Inc..
41. Beauchamp, M. K., Jette, A. M., Ward, R. E., Kurlinski, L. A., Kiely, D., Latham, N. K., et al. (2015). Predictive validity and responsiveness of patient-reported and performance-based measures of function in the Boston RISE study.J Gerontol A Biol Sci Med Sci, 70, 616–622.
42. Wiebe, S., Guyatt, G., Weaver, B., Matijevic, S., & Sidwell, C. (2003). Comparative responsiveness of generic and specific quality-of-life instruments.J Clin Epidemiol, 56, 52–60.
43. Walvoort, S. J., van der Heijden, P. T., Kessels, R. P., & Egger, J. I. (2016). Measuring illness insight in patients with alcohol-related cognitive dysfunction using the Q8 questionnaire: A validation study.Neuropsychiatr Dis Treat, 12, 1609–1615.