http://www.sciencepublishinggroup.com/j/es doi: 10.11648/j.es.20190402.12
ISSN: 2578-9260 (Print); ISSN: 2578-9279 (Online)
Mechanical and Physical Properties of PP and HDPE
Ahmed Hassan Awad
*, Ramadan El Gamasy, Ayman Abd El Wahab, Mohamed Hazem Abdellatif
Design and Production Department, Ain Shams University, Cairo, Egypt
Email address:
*
Corresponding author
To cite this article:
Ahmed Hassan Awad, Ramadan El Gamasy, Ayman Abd El Wahab, Mohamed Hazem Abdellatif. Mechanical and Physical Properties of PP and HDPE. Engineering Science. Vol. 4, No. 2, 2019, pp. 34-42. doi: 10.11648/j.es.20190402.12
Received: September 27, 2019; Accepted: October 23, 2019; Published: October 25, 2019
Abstract:
The properties of these polymers, as in the case of any materials, depending on the molecular weight of the polymer and the structure of the polymer chains. The main objective of this work is to study the mechanical and physical properties of pure PP and HDPE. To obtain a full characterization of pure polymer, samples were produced using a compression molding technique. Polymeric samples successfully filled the cavity of the die. The mechanical properties of PP and HDPE were determined using three-point bending, compression, hardness and impact test. While the physical properties were studied through density and water absorption. Also, the thermal analysis behavior was determined by thermogravimetric analysis, differential scanning calorimetry and thermomechnical analysis. Results showed the structure affects the properties. The PP showed better elastic modulus and strength due to the methyl attached to the carbon that prevents the chain rotation and hence makes the material stronger but inflexible. On the other hand, the absorbed energy of PP is less than that of HDPE. The thermogravimetric analysis results show a single weight-loss event with a degradation temperature of 310°C for HDPE and 255°C for PP. The differential scanning calorimetry shows that the crystallinity of PP (≅51) is less than that for HDPE (≅68) due to the difference in the specific heat. The coefficient of thermal expansion of HDPE is higher than that of PP due to the stronger interatomic forces.Keywords:
PP, HDPE, Mechanical Properties, Physical Properties, Thermal Properties1. Introduction
Polymer borrowed from the Greek words; Poly means ‘many’ while meres mean “parts”. Polymers have a long molecule composed of small units [1]. Most of the polymer materials are organic which are based on hydrogen, carbon and nonmetallic elements. The polymer materials can be classified into thermoplastic and thermoset, this classification is according to the polymer behavior to the temperature. Thermoplastic polymers are softened at heating and hardened at cooling. This behavior is revisable and repeatable. Also, thermoplastic polymers are soft, having linear or branched structures. Examples of thermoplastic polymers are poly (ethylene terephthalate), poly (vinyl chloride), polypropylene, polyethylene and polystyrene, Thermosets polymer aren’t softened at heating. Also, thermoset polymers are hard, strong and have network structure. Examples of thermoset polymers are polyester, epoxies, and phenolics [2].
The properties of the polymer materials depend on the
molecular shape, weight, and structure. The polymer structure is linear when the repeat unit joined end to end in one chain. Polyethylene, polystyrene, nylon materials have a linear structure. Side branches may be connected to the main chain producing the branched structure. This reduces the packing efficiency of the polymer and its density. Low-density polyethylene contains branch chains. Linear branches can also be connected together at different positions forming crosslinked structures. Most rubber materials have a crosslinked structure. If three or more covalent bond is formed, network polymers structure occurred. Phenol-formaldehyde, epoxies, and polyurethanes have a network structure.
Since polymers have many applications, the study of thermoplastic composites got great interest during the last years [3]. In a lot of cases, the polymer has many processing techniques such as extrusion, injection and compression molding [4].
from. The coding scheme used was created by the Society of the Plastics Industry (SPI) and gives numbers 1 to 6 for PET, HDPE, PVC, LDPE, PP, and PS with many other plastics coded 7 respectively [5].
HDPE is one of the world's largest volume of commodity chemicals. The global demand amounted to 1.8×10¹⁰ kg in 1998. Blow molding is the most popular technique of handling HDPE, where the resin is converted into bottles (particularly for milk and juice), household goods, toys, pails, drums and gas tanks for automotive use. Housewares, toys, food containers, trash pails, milk crates, and cases are also frequently injected. HDPE films are frequently discovered as bags and garbage bags in supermarkets and department stores. Polypropylene is a versatile polymer used in film-to-fiber applications that demand more than 21 million pounds globally. It is comparable in composition to polyethylene, with the exception of replacing one hydrogen group with one methyl group [6].
In the research described herein, PP and HDPE samples were produced using a compression molding method. There are attempts to fully identify the characteristics of this polymer to be used in multiple applications and products. In
this research, the mechanical properties of PP and HDPE were determined using the 3-point bending test, compression, and hardness. Also, the physical properties such as the density and the water absorption of the PP and HDPE were obtained. Finally, the thermal properties were determined using thermogravimetric analysis or thermal gravimetric analysis (TGA), differential scanning calorimetry (DSC) and thermomechanical analysis (TMA).
2. Method
2.1. Materials
High-density polyethylene (HDPE) was selected because it is commonly used and widely recycled. Polypropylene (PP) was also used, because of its availability and variety.
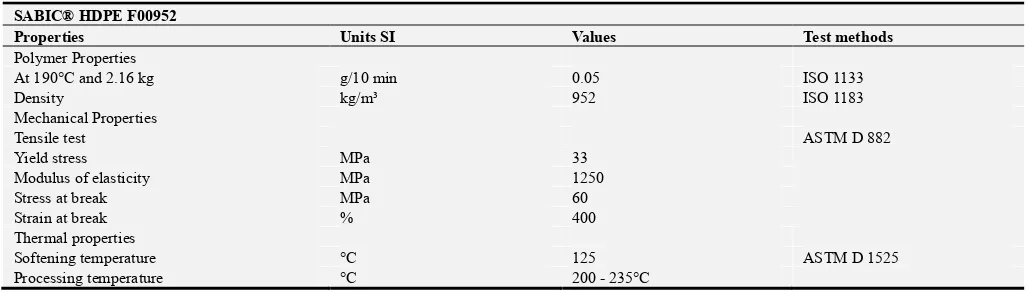
PP, 500P type, and HDPE, F00952 type, were obtained from the Saudi Sabic Company in pellets form. The basic, mechanical, and thermal properties of HDPE and PP are provided by the supplier and are presented in Table 1 and Table 2 respectively.
Table 1. Basic properties of HDPE (Datasheet of SABIC® HDPE F00952).
SABIC® HDPE F00952
Properties Units SI Values Test methods
Polymer Properties
At 190°C and 2.16 kg g/10 min 0.05 ISO 1133
Density kg/m³ 952 ISO 1183
Mechanical Properties
Tensile test ASTM D 882
Yield stress MPa 33
Modulus of elasticity MPa 1250
Stress at break MPa 60
Strain at break % 400
Thermal properties
Softening temperature °C 125 ASTM D 1525
Processing temperature °C 200 - 235°C
Table 2. Basic properties of PP (Datasheet of SABIC® PP 500P).
SABIC® PP 500P
Properties Units SI Values Test methods
Polymer Properties
At 190°C and 2.16 kg g/10 min 3 D 1238
Density kg/m³ 905 D 792
Mechanical Properties
Tensile strength at Yield MPa 35 D 638
Tensile elongation at Yield % 10 D 638
Flexural modulus MPa 1500 D 790A
Notched Izod Impact Strength J/m 25 D 256
Rockwell hardness, R-scale - 102 D 785
Thermal properties
Softening temperature °C 152 D 1525B
Processing temperature °C 235-250°C
2.2. Sample Preparation
PP and HDPE billets were extruded using special mixing machine, the hot extruded part was molded into a shaped die (200 mm length, 200mm width and 15 mm thickness die gap) using C-frame hydraulic press at 100°C for five minutes
under 50 bars. Finally, the compressed polymers were cooled by circulating water until are reach the room temperature.
2.3. Experimental Work
determined using the universal testing machine WDW-10 in accordance with ASTM D 790. Five bending test specimens of dimensions 140× 14× 9 mm were cut using circular disc saw. The test was performed with a span length of 80 mm and a crosshead speed of 3 mm/min at ambient temperature. The specimen was expanded to failure or fracture in this test. The bending modulus was obtained from the slope of the straight line in the load-deflection curve. While the bending toughness representing the specimen's absorbed energy capacity is also determined in terms of the region under load deflection curve and according to ASTM C 1018.
In the compression test of the polymeric samples, properties such as offset yield strength and compression modulus can be determined [7]. This test of five compression test specimens of the uniform rectangular cross section of 12.7×12.7×25 mm was performed using the WDW-10 universal testing machine at 2 mm/min crosshead velocity at ambient temperature and according to ASTM D 695. Since the specimens do not show compression fracture, compressive strength at a strain of 5% and 10% was determined. From previous work, the results were recorded at low strain because at high strain level there is a large rise in the stress applied due to the abnormal rise in the coefficient of friction [8].
In the impact test of the polymeric samples, the absorbed energy and the impact strength were determined using XJJU-5.5/50J Izod & Charpy impact tester machine. Five notched specimens were prepared according to ASTM D 6110. The specimens with dimensions 12.7×12.5×125 mm and a notch of 45° with a notch depth of 2.5 mm were prepared using a horizontal milling machine. The attachment of Notched Charpy was set with a span length of 102 mm and a hammer of 15 J at ambient temperature.
In the hardness test of the polymeric samples, shore D hardness was measured using GxPro-S60-10D instrument. A needle pin is exposed to the flat surface of the specimen using the shore D technique and pressure has been applied. The penetration depth is measured between 0 and 100 and the standard unit is expressed in the device, called Shore D grade degrees. The experiment was adapted at a vertical range of 25 mm between the presser and the specimen's flat surface for 1 sec.
In the density test of the polymeric samples, an analytical balance ADAM PW 240 with an extension kit was used in accordance with ASTM D 792. Five specimens of 10 mm length, 10 mm width and 8 mm thickness were weighed in air and then in the gasoline was used, the density of gasoline is 711 kg/m3. The density estimation process is based on the concept of Archimedes.
In the water absorption test of the polymeric samples, an analytical balance MUL-TEC KR-204 balance with a resolution of 0.0001 gram used in accordance with ASTM D570. Five specimens of 10 mm length, 10 mm width and 8 mm thickness were fully immersed in distilled water at ambient temperature for 24 hours.
Thermal assessment includes a set of methods in which a substance's physical property is measured using a monitored program of temperature. Differential scanning calorimetry (DSC) is a thermal method in which the difference in the
quantity of heat needed to raise a specimen's temperature (i.e., the material's heat capacity) is measured as a function of temperature. In DSC, when a specimen is physically transformed, such as a phase transition, more or less heat will be needed to flow to it than to the reference (naturally an empty sample pan) to maintain both at the same temperature. It relies on whether the method is exothermic or endothermic whether the heat must drift to the sample [9].
In the thermal analysis test of the polymeric samples, thermogravimetric universal analysis (TGA) method with the Q500 instrument was used to measure the mass loss percentage as a function of temperature. The specimens of 3 mg were heated, on alumina pan with aid of flow rate of 50.0 ml/min nitrogen, from the ambient temperature and up to 700°C with a heating rate of 10°C/min.
Also, differential scanning calorimetry (DSC) method with the Q2000 instrument was used to measure the heat flow as a function of temperature. The specimens of 4.5 mg were put in an alumina pan and sealed using the Tzero Press. Then, the capsules were heated twice from the ambient temperature and up to 300°C with a heating rate of 10°C/min. The capsules were cooled at the same rate while the results were reported from the second cycle [10]
The crystallization index of the polymer can be calculated from the equation number (1).
=∆ ∗
∆ (1)
Where:
∆H∗: Heat fusion of the sample (J/g), evaluated by measuring the area in the thermogram.
∆H HDPE : The heat fusion of 100% crystalline HDPE, which is 292.6 j/g [11].
∆H PP : The heat fusion of 100% crystalline PP, which is 209 j/g [12].
Finally, the thermomechanical analysis (TMA) method with a Q400 instrument was used to measure the change in length as a function of temperature. the specimens of 8 mm length, 5 mm width and (1.5-2.5) mm in thickness were heated from the ambient temperature and up to 130°C with a heating rate of 10°C/min and under applied compression load of 0.01 N.
3. Results and Discussion
3.1. Mechanical Properties
3.1.1. 3-Point Bending
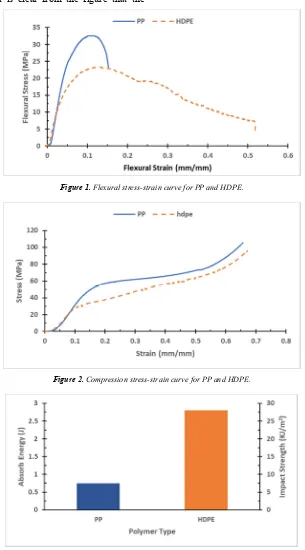
Figure 1 shows the flexural stress-strain curve of PP and HDPE. From the figure, the flexural strength for PP (31 MPa) is higher than that for HDPE (24 MPa). This may be due to that PP having methyl (CH3) attached to the carbon
atom repeat unit, which prevents the chain rotation making it much stronger but reducing its flexibility. While HDPE shows elastic behavior and exhibits lower flexural strength and higher deflection as compared to PP.
load-deflection curve. Therefore, the bending toughness of HDPE represented by the absorbed energy (8.334 J) is higher than that of PP (4.423 J).
The results indicate that PP has better mechanical properties (flexural strength and bending modulus) than pure HDPE except for toughness property. That is due to the fact that PP is strong as compared with HDPE [13].
3.1.2. Compression
The compression stress-strain curve of PP and HDPE is presented in Figure 2. It is clear from the figure that the
compression strength of PP is also higher than that for HDPE. The summary of the results obtained from the compression test is given in Table 3.
3.1.3. Impact Strength
The impact strength and the absorbed energy properties of PP and HDPE are presented in Figure 3. It is obvious from the figure that the impact strength of the HDPE is higher than that for PP. This is caused by the methyl (CH3) attached to the
chain of PP.
Figure 1. Flexural stress-strain curve for PP and HDPE.
Figure 2. Compression stress-strain curve for PP and HDPE.
3.1.4. Hardness
PP is more rigid and stronger than HDPE [13]. Results from the hardness test confirmed this fact as the HDPE (67 Shore D) has a lower hardness than PP (78.5 Shore D).
3.2. Physical Properties
3.2.1. Density
The density of PP (0.855 g/cm3) is lower than that of HDPE (0.926 g/cm3).
3.2.2. Water Absorption
The water absorption for pure PP which is 0.225% while it 0.045% for pure HDPE.
Table 3. Compression results for PP and HDPE.
Property/Material PP HDPE
Offset yield strength (MPa) 38.5 19.7 Compression Modulus (MPa) 662.7 530.0 Compression Strength at 5% strain (MPa) 41.36 22.22 Compression Strength at 10% strain (MPa) 52.01 28.62
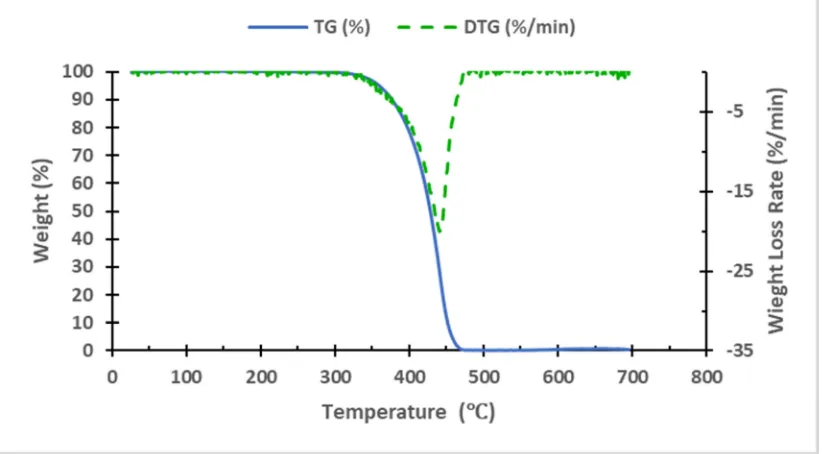
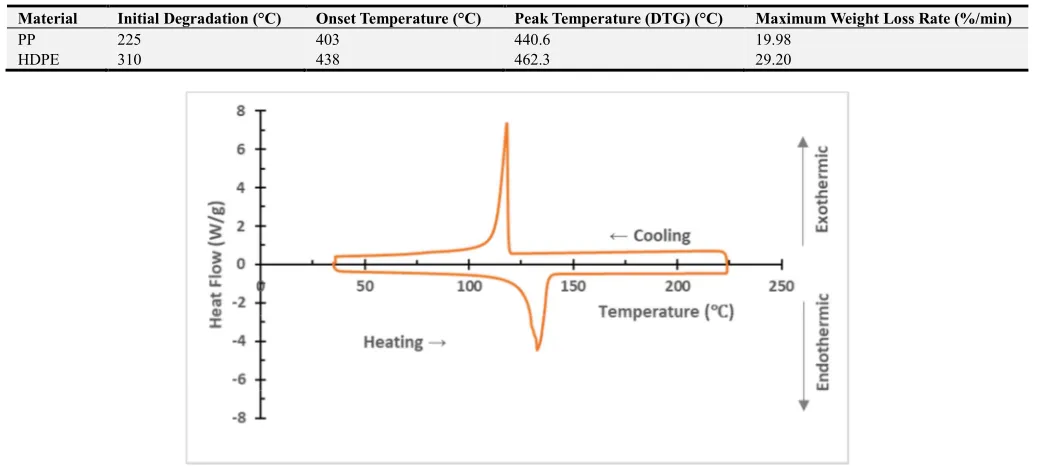
3.2.3. TGA
TGA analysis was performed on PP and HDPE. Figure 4 and Figure 5 show the TGA and DTG thermographs of the PP and HDPE, respectively. The Thermogravimetric analysis or thermal gravimetric analysis (TGA) is a technique of thermal analysis to measure the mass loss of the sample as the temperature change with the time. While the Derivative Thermogravimetry (DTG) is another type of thermal analysis to get the weight loss rate as the temperature change over time. These two methods are used to find the degradation of materials as appears in figures. It is clearly shown from Figure 6 that the initial degradation started around 255°C, while it was 310°C for HDPE. From the TGA results of PP, a single event weight loss occurred with an onset temperature
of 403°C. For HDPE, also, a single weight-loss event occurred with an onset temperature of 438°C.
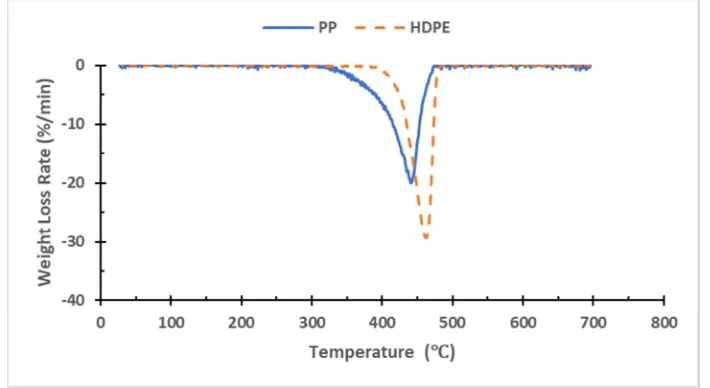
DTG thermographs shown in Figure 7 clearly show a single peak for both PP and HDPE. The peaks were around 440.6°C and 462.3°C for PP and HDPE respectively.
Figure 6 shows the TG thermographs of PP and HDPE while Figure 7 presents the DTG thermographs. The summary of the thermogravimetric analysis of the materials is given in Table 4.
3.2.4. DSC
Differential calorimetry scanning (DSC) is a thermo-analytical method in which the difference in the amount of heat required to increase a sample's temperature and comparison reference is determined as a function of temperature. When the HDPE subjected to a thermal cycle, as shown in Figure 8, it exhibited an endothermic reaction (negative heat flow) at heating and exothermic reaction (positive heat flow) at cooling. The DSC thermographs of the PP and HDPE samples are shown in Figure 9. The heat needed in PP is lower than that in HDPE in agreement with Mengeloglu [14] due to the lower specific heat of PP compared to that of HDPE. Also, from the figure, when comparing the area under the endothermic curve, it is clear that the crystallinity of PP is less than that for HDPE and this affects their properties in agreement with other researchers in their work on polymeric materials [15]. The summary of the thermogravimetric analysis of the materials is given in Table 5.
Based on the TGA and DSC analysis, the processing temperature of the mixer and the extruder should be above 163°C for PP and 129°C for HDPE. Also, the processing temperature should not exceed 225°C for PP and 310°C for HDPE to prevent degradation.
Figure 4. The TG and DTG results generated on the PP at the heating rate of 10°C/min. The plot shows the weight loss percentage as a function of sample
Figure 5. The TG and DTG results generated on the HDPE at a heating rate of 10°C/min. The plot shows the weight loss percentage as a function of sample temperature.
Figure 6. TG thermographs of the PP and HDPE at a heating rate of 10°C/min. The plot shows the weight loss percentage as a function of sample temperature.
Table 4. Thermogravimetric data for PP and HDPE.
Material Initial Degradation (°C) Onset Temperature (°C) Peak Temperature (DTG) (°C) Maximum Weight Loss Rate (%/min)
PP 225 403 440.6 19.98
HDPE 310 438 462.3 29.20
Figure 8. DSC cycle (heating and cooling) of the HDPE sample at a heating rate of 10°C/min. The plot shows the heat flow as a function of sample temperature.
Figure 9. DSC thermographs of the PP samples and HDPE samples an applied heating rate of 10°C/min.
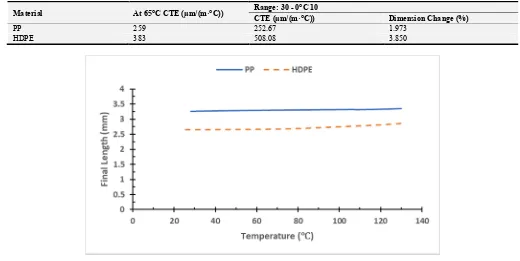
3.2.5. TMA
Thermomechanical Analysis (TMA) which tests a material's dimensional change over a predefined segment of temperature. TMA puts stress on a material and the resulting strain is measured while the material is exposed to a controlled system of temperature. Figure 10 shows the final length variation of the polymeric sample versus temperature. A dilatometer was used to determine the linear thermal expansion of the polymer material as a
function of temperature. The CTE and the percentage change in dimensions of PP and HDPE are summarized in Table 6.
From this test, it was observed that the PP has lower thermal expansion than that of HDPE and this is in agreement with Awad et al. [16, 17]. This can be related to the interatomic forces. PP has stronger interatomic forces than that of HDPE. Weak interatomic forces are allied with high thermal expansion, strong forces with low expansion.
Table 5. Thermal properties of PP and HDPE.
Material Onset Temp. (°C) Melting Temp. (Tm) (°C) Heat Flow (W/G) ∆H (J/G) Xr (%)
PP 109.61 163.22 -2.11 107.3 51.34
Table 6. The CTE and dimension change% of PP and HDPE.
Material At 65°C CTE (µm/(m·°C)) Range: 30 - 0°C 10
CTE (µm/(m·°C)) Dimension Change (%)
PP 259 252.67 1.973
HDPE 383 508.08 3.850
Figure 10. The final length variation of PP and HDPE versus temperature.
4. Conclusion
The given study investigates the mechanical and physical properties of pure PP and HDPE. Two polymers with different structures namely, PP and HDPE were studied. From the three-point bending, the flexural strength of PP is 31 MPa that is higher than that of HDPE (24 MPa). Also, from the compression test, the PP show higher resistance to force than that of HDPE. These tests prove that the PP is stronger than that of HDPE. The drawback of PP compared to HDPE is the lower resistance to impact force. This may be due to the fact that PP has methyl (CH3) connected to the
repeat unit of the carbon atom, which avoids the chain rotation, but reduces its flexibility. Also, the PP shows higher thermal properties than that of HDPE. PP has higher thermal dimensional stability than that of HDPE, (COE of PP is 259 µm/(m·°C), COE of HDPE is 383µm/(m·°C)) since the PP has stronger interatomic forces than that of HDPE.
Conflict of Interest
The authors have declared no conflict of interest.
References
[1] Massaro, R., et al., Flow-Induced Crystallization of Polyamide-6. International Polymer Processing, 2018. 33 (3): p. 327-335.
[2] Junior, C., WD Materials Science and Engineering an Introduction. 2000, EUA: John Wiley & Sons Inc.
[3] Mittal, V., Spherical and fibrous filler composites. 2016: John Wiley & Sons.
[4] AL-Oqla, F. M., Investigating the mechanical performance deterioration of Mediterranean cellulosic cypress and pine/polyethylene composites. Cellulose, 2017. 24 (6): p. 2523-2530.
[5] Cohen, R. E., Handbook of plastics and elastomers, Charles A. Harper, Editor‐in‐Chief, 1024 pages, 525 Illustrations, McGraw‐Hill Book Company, $39.50. AIChE Journal, 1976. 22 (2): p. 413-413.
[6] Paul, D., Concise encyclopedia of polymer science and engineering, Jacqueline I. Kroschwitz, John Wiley & Sons, New York, 1990. $135.00. Journal of Polymer Science B Polymer Physics, 1991. 29: p. 1653-1654.
[7] Dowling, N. E., Mechanical behavior of materials: engineering methods for deformation, fracture, and fatigue. 2012: Pearson.
[8] Awad, A. and M. H. Abdellatif, Assessment of mechanical and physical properties of LDPE reinforced with marble dust. Composites Part B: Engineering, 2019: p. 106948.
[9] Watson, E., et al., A Differential Scanning Calorimeter for Quantitative Differential Thermal Analysis. Analytical Chemistry, 1964. 36 (7): p. 1233-1238.
[10] Awad, A., et al., A study of some thermal and mechanical properties of HDPE blend with marble and granite dust. Ain Shams Engineering Journal, 2019. 10 (2): p. 353-358. [11] Peterlin, A., Macromolecular physics, vol. 2, Bernhard
Wunderlich, Academic Press, New York, 1976, 461 pp. Journal of Polymer Science: Polymer Letters Edition, 1976. 14 (9): p. 571-571.
[13] Salih, S. E., A. F. Hamood, and A. H. A. Alsalam, Comparison of the characteristics of LDPE: PP and HDPE: PP polymer blends. Modern Applied Science, 2013. 7 (3): p. 33.
[14] Mengeloglu, F. and K. Karakus, Thermal degradation, mechanical properties and morphology of wheat straw flour filled recycled thermoplastic composites. Sensors, 2008. 8 (1): p. 500-519.
[15] Bagher, A. M. and B. M. Reza, Polymer Optic Technology. Optics, 2015. 4 (1): p. 1.
[16] Awad, A., et al., Mechanical behavior of PP reinforced with marble dust. Construction and Building Materials, 2019. 228: p. 116766.