137
Effect Of Vibration Amplitude Level On Seated
Occupant Reaction Time
Amzar Azizan, Ratchaphon Ittianuwat, Zhengqing LiuAbstract: The past decade has seen the rapid development of vibration comfort in the automotive industry. However, little attention has been paid to vibration drowsiness. Eighteen male volunteers were recruited for this experiment. Before commencing the experiment, total transmitted acceleration measured at interfaces between the seat cushion and seatback to human body was adjusted to become 0.2 ms-2 r.m.s and 0.4 ms-2 r.m.s for each volunteer. Seated volunteers were exposed to Gaussian random vibration with frequency band 1-15 Hz at two level of amplitude (low vibration amplitude and medium vibration amplitude) for 20-minutes in separate days. For the purpose of drowsiness measurement, volunteers were asked to complete 10-minutes PVT test before and after vibration exposure and rate their subjective drowsiness by giving score using Karolinska Sleepiness Scale (KSS) before vibration, every 5-minutes interval and following 20-minutes of vibration exposure. Strong evidence of drowsiness was found as there was a significant increase in reaction time and number of lapse following exposure to vibration in both conditions. However, the effect is more apparent in medium vibration amplitude. A steady increase of drowsiness level can also be observed in KSS in all volunteers. However, no significant differences were found in KSS between low vibration amplitude and medium vibration amplitude. The results of this investigation suggest that exposure to vibration has an adverse effect on human alertness level and more pronounced at higher vibration amplitude. Taken together, these findings suggest a role of vibration in promoting drowsiness, especially at higher vibration amplitude.
Index Terms: human vibration, drowsiness, sleepiness, psychomotor-vigilance test, karolinska sleepiness scale
————————————————————
1
I
NTRODUCTIONThe understanding, assessment and prediction of seated occupant drowsiness in various transportation vehicles have been a topic of interest for many decades. Drowsiness can be attributed to many things such as sleep deprivation and alcohol influence [1], [2]. Although the national and international standards have been drafted to define the health risks and behavior of the human body when subjected to vibration for which guidelines and thresholds are established including weighting filters to estimate ride comfort, however, the formulation of drowsiness caused by vehicle vibration was not well understood or investigated. This is because drowsiness is multifactorial. Drowsiness or fatigue criteria are importance as it affects comfort (perception of quality), safety (judgement, concentration level) and health (long term exposure causes muscular-skeletal injuries) [2]. Although many studies have contributed much to the understanding and prediction of the subjective human body response to vibration [3], [4], none of these studies has considered the effect of vibration on drowsiness level for seated occupant in the vehicle. In other words, there is little knowledge to examine how the vehicle vibration influence the alertness level and how can we quantitatively measure the drowsiness caused by vibration. Research consistently shows that cumulative sleep restriction and drowsiness results in an increase in reaction time (RT), a decrease in response speed (1/RT), and increase in a number of lapse (RT > 500 ms) [5]–[7].
Although many studies have attempted to demonstrate the links between reaction time performances and drowsiness, drowsiness caused by vibration has not been experimentally assessed by reaction time measure. The experiments conducted follow the guidelines of the ISO2631-1, ‗Evaluation of human exposure to whole-body vibration‘ weightings and test procedures [8]. According to ISO2631-1, a fixed frequency weighted r.m.s value of vibration transmitted to the seated human body will return a constant subjective comfort rating regardless of the frequency content. The purpose of this study is to objective and subjectively measure the drowsiness level when volunteer exposed to the vibration.
2
METHODOLOGY2.1 Volunteer
Eighteen male and healthy university students with mean age 23.0 ± 1.3 years participated in this study. They were 168.2 ± 4.0 cm and weighed 69.3 ± 9.88 kg. The average BMI of volunteers was 22.6 (SD=2.54) kg/m². None of the volunteers had a history of neck pain, diseases of the cervical spine or musculoskeletal disorders. They had normal hearing and normal or corrected-to-normal vision. Volunteers were also screened using the Epworth Sleepiness Scale (ESS) to detect any abnormalities in sleepiness [9]. Volunteers with a score > 10, indicating excessive sleepiness were excluded from the experiment [10]. They were also instructed to have sufficient sleep the day before the experiment. The total ESS score ranged from 0 to 24; scores below 7 were considered as normal, scores between 8 to 10 as moderate sleepiness, scores between 11 to 15 was applied to define an elevated risk, whereas scores above 16, severe excessive daytime sleepiness (EDS) [11], was considered as high risk of falling asleep in various monotonous situations [12].
2.2 Ethical Consideration
Volunteers were recruited from university students. They were fit and healthy. They were provided with verbal and written explanations of the purpose and contents of the experiment. They were also informed that they have right to refuse participation in the experiment, and the results of the _____________________________
Amzar Azizan is currently pursuing Ph.D. in Aerospace Engineering at RMIT University, Australia, E-mail:
Ratchaphon Ittianuwat is currently pursuing Ph.D. in Mechanical Engineering at RMIT University, Australia E-mail: [email protected]
experiment would remain confidential. Following this, informed written consent form was obtained from all the volunteers after the procedure of the experiment was explained, and the laboratory facilities were introduced to them. The vibration exposure was set at a level that did not affect the health according to ISO 2631-1 (1997) International Standard [8]. The experimental protocol was reviewed and approved by the RMIT University Human Research Ethics Committee (Approval Number: EC 00237).
2.3 Objective Measure
Reaction time was assessed with the PC-based Psychomotor Vigilance Test (PVT-192: Ambulatory Monitoring Inc., Ardsley, New York) [13], a 10–minutes visual reaction time task that evaluate sustained attention in two conditions; before vibration exposure and after vibration exposure. Volunteers were instructed to respond to the appearance of a visual stimulus by clicking a mouse as quickly as possible. The stimulus was a red light emitting diode displaying time in milliseconds. During each 10-minutes session, visual stimuli appeared the variable intervals of 2-10 second. From each PVT condition, three PVT performance metrics that are mean reaction time, the number of lapses and median reaction time were extracted using a software program. A response is considered valid if it is > 100 ms. A response less than 100 ms will indicate a false signal [5]. During vibration condition, volunteers were asked to sit comfortably with their back on the backrest and hands on their lap. The volunteers were required to sit with their feet firmly placed on the footrest. The footrest was not connected to the vibration table and was isolated from the vibration. Volunteers were also instructed to limit any physical movement. Volunteers were exposed to a Gaussian random vibration, with 1-15 Hz frequency bandwidth, for 20-minutes. Similar experimental procedures were applied for no-vibration condition. Volunteers were asked to take a seat for 20-minutes after completed first PVT test. Second PVT test will be conducted immediately after 20-minutes of sitting
2.4 Subjective Measure
Volunteers rated their subjective sleepiness using Karolinska Sleepiness Scale (KSS) before vibration exposure, every 5-minutes of vibration and after vibration exposure. The rating was initiated by the test leader saying KSS. The use of the scale had been practice beforehand and consisted of the following scores: 1 = extremely alert, 2 = very alert, 3 = alert, 4 = rather alert, 5 = neither alert or sleepy, 6 = some sign of sleepiness, 7 = sleepy, but no effort to stay awake, 8 = sleepy, some effort to stay awake, 9 = very sleepy, great effort to stay awake [14]. No conversation was permitted between the volunteer and the test leader, unless in the event of an emergency
2.6 Experiment Procedures
The experiment was conducted in the controlled laboratory. An actual vehicle seat with adjustable headrest was used. The seat was mounted on a cast aluminium table (2 m x 1.2 m x 1.2 m), and the table was mounted on four air mountings. The seatback inclination angle was set at 15° to the vertical direction. The excitation input force for the table was provided by the servo-controlled hydraulic actuator (5 kN) that was placed vertically at the corner of the table. Prior to drowsiness measurement, measurement of total transmitted vibration to each volunteer has been done in accordance with ISO 2631-1
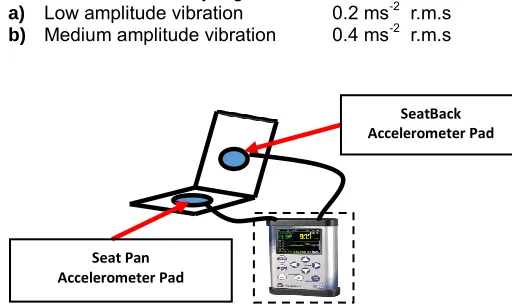
(1997) [8]. The measurement was carried out to adjust the required hydraulic input force for every volunteer using accelerometer pad (Fig. 1).The volunteer was instructed to avoid any caffeine intake and maintain a regular sleep pattern a week before the experiment. The experiment started at 9.00 AM. Before commencing the experiment, volunteers were screened using Epworth Sleepiness Scale (ESS). Score more than 10 will be excluded from the experiment [9]. To minimise the learning effect practise session was given to all volunteers. Volunteers were required to complete two conditions of vibration that were randomly organised.
a) Low amplitude vibration 0.2 ms-2 r.m.s b) Medium amplitude vibration 0.4 ms-2 r.m.s
FIG. 1. Transmitted vibration to human body was measured
by two accelerometer pad that are connected to the seatback and seat pan.
3
RESULTS3.1 Objective Measures - PVT
Influence of difference transmitted vibration amplitude (ms-2
r.m.s) on human drowsiness level, measured by PVT, is presented in Table 1. The following three PVT metrics were assessed and included in the analyses: (1) minor lapse, (2) mean RT and (3) median RT. Comparison of three PVT metrics before exposure and after exposure to vibration showed that the 20-minutes exposure to vibration had a significant (p < 0.05) influences on volunteer's RT in both conditions (low vibration amplitude - 0.2 ms-2 r.m.s and
medium vibration amplitude - 0.4 ms-2 r.m.s). Significant
increases of reaction time and increases in the number of lapses were found in all eighteen volunteers. From the data in Table 1, we can see that, following 20-minutes exposure to vibration, the average number of PVT lapses (mean ± SEM) in both conditions across eighteen volunteers were increased from (1.67 ± 0.36 to 3.67 ± 0.58, p = 0.0018 in low vibration amplitude and from 1.71 ± 0.36 to 4.86 ± 0.46, p = 0.0002 in medium vibration amplitude, indicating decreased in alertness level. A comparison of the two results reveals that the mean difference in medium vibration amplitude (0.4 ms-2 r.m.s) is
greater than low vibration amplitude (0.2 ms-2 r.m.s).
Considerable changes demonstrate that the effect of vibration amplitude on the human lapse of attention is more pronounced in medium vibration amplitude (0.4 ms-2 r.m.s), and the result
is significant (p = 0.0024). A statistical significance increase in reaction time could also be seen in mean RT in both vibration conditions in all eighteen volunteers. Due to exposure to vibration, volunteers‘ mean RT was increased from (283.3 ± 6.24 to 320.2 ± 10.68, p < 0.0001 in low vibration amplitude and from 281.1 ± 6.56 to 360.6 ± 11.50, p < 0.0001 in medium
SeatBack Accelerometer Pad
139 vibration amplitude). Comparing the two results, it can be seen
that the mean difference of mean RT in medium vibration amplitude (0.4 ms-2) is greater than low vibration amplitude
(0.2 ms-2). This provides sufficient evidence that exposure to
medium vibration amplitude (0.4 ms-2) has a greater influence
on human drowsiness level specifically in volunteer mean RT and the result are statistically significant (p = 0.0027). As shown in Table 1, there was also an increase of PVT metrics – median RT following exposure to low vibration amplitude and medium vibration amplitude. Volunteer median RT was increased from 268.5 ± 7.21 to 301.3 ± 9.68, p = 0.0020 in low vibration amplitude and from 268.3 ± 7.89 to 329.1 ± 10.13, p < 0.0001 in medium vibration amplitude. The Larger mean difference in medium vibration amplitude (0.4 ms-2) indicates
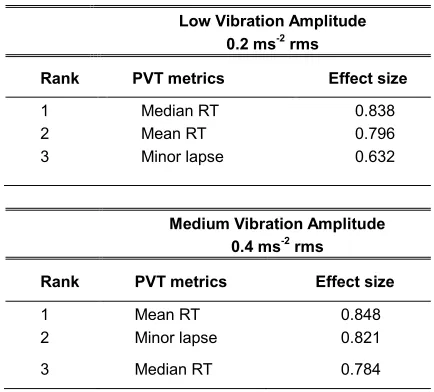
pronounced drowsiness effect on human due to higher vibration amplitude. In order to determine the magnitude of the reaction time changes between before and after vibration exposure in both conditions, effect sizes for all PVT metrics were calculated and were shown in Table 2. Effect sizes will increase with the magnitude of within–volunteers difference and decrease with increasing variability of the differences. Based on the above definitions, PVT metrics was arranged according to their effect sizes and sensitivity to vibration. As can be seen in low vibration amplitude condition, median RT showed high effect size (ES = 0.838) of the difference between before and after 20-minutes exposure to vibration that indicated stronger sensitivity to vibration followed by mean RT (ES = 0.796) and minor Lapse (ES = 0.632). Effect sizes more than 0.5 also indicates moderate statistical and the clinical difference between two variables. However, in medium vibration amplitude condition, a high magnitude of the differences before and after vibration exposure can be observed in mean RT (ES = 0.848), followed by minor lapse (ES = 0.821) and median RT (ES = 0.784). A comparison of the two results between low vibration amplitude and medium vibration amplitude reveals that there was a significant difference between the two conditions. However, the effect is more pronounced in medium vibration amplitude that has higher effect sizes. Further analysis showed that mean RT was a sensitive PVT metrics in both vibration amplitude conditions.
TABLE 1
COMPARISON OF PVT METRICS BETWEEN LOW VIBRATION AMPLITUDE AND MEDIUM VIBRATION AMPLITUDE ARE SHOWN. SIGNIFICANT INCREASE OF REACTION TIME AND MINOR LAPSE (RT
> 500 MS) CAN BE OBSERVED FOLLOWING EXPOSURE TO VIBRATION. HOWEVER, THE EFFECT IS MORE PRONOUNCED IN
MEDIUM AMPLITUDE VIBRATION.
TABLE 2
EFFECT SIZE OF PVT METRICS IN BOTH VIBRATION CONDITIONS ARE SHOWN. HIGHER EFFECT SIZE WILL INDICATE LARGER
STATISTICAL AND CLINICAL DIFFERENCE BETWEEN TWO VARIABLES.
Low Vibration Amplitude 0.2 ms-2 rms
Rank PVT metrics Effect size
1 Median RT 0.838
2 Mean RT 0.796
3 Minor lapse 0.632
Medium Vibration Amplitude 0.4 ms-2 rms
Rank PVT metrics Effect size
1 Mean RT 0.848
2 Minor lapse 0.821
3 Median RT 0.784
3.1 Subjective Measures–KSS
Subjective sleepiness score (KSS) for low vibration amplitude and medium vibration amplitude were plotted against time and were shown in Fig. 2. Significant increases in KSS score between before vibration exposure and every subsequent 5-minutes of exposure to vibration were detected using repeated measures-ANOVA test (p < 0.0001) for all eighteen volunteers in both conditions. Fig. 2 shows a definite decline in alertness level indicated by a progressive increase in subjective sleepiness score throughout the course of exposure to vibration in both vibration amplitude conditions (0.2 ms-2 r.m.s.
and 0.4 ms-2 r.m.s.). As can be seen from the figure, the
average KSS score (mean ± SEM) before vibration exposure for low vibration amplitude and medium vibration amplitude were 2.56 ± 0.16 and 2.72 ± 0.19 respectively. However, a comparison of two results showed that there was no statistical significance difference (p > 0.05) between both vibration amplitude conditions before vibration exposure. Following 10-minutes of vibration exposure, the average KSS score for all volunteers steadily increased to 5.56 ± 0.35 (mean ± SEM) in low vibration amplitude and 6.06 ± 0.15 (mean ± SEM) in medium vibration amplitude. A slight difference between the obtained values, however, was not significant (p > 0.05). As shown in the figure, drowsiness was pronounced after 20-minutes exposure to vibration with KSS values of 6.78 ± 0.33 (mean ± SEM) in low vibration amplitude and 7.61 ± 0.12 (mean ± SEM) in medium vibration amplitude. It clearly indicates decrement of alertness level in all volunteers following 20-minutes exposure to vibration. To investigate statistical significance, one-way repeated measures-ANOVA was carried out. It was found out that intra-individual and inter-individual differences of all seven volunteers were highly significant (p < 0.0001) in each vibration condition. However, no significant differences were found between low vibration amplitude and medium vibration amplitude.
Low Vibration Amplitude 0.2 ms-2 rms
Pre-exposure Post-exposure
Minor lapse (n) 1.67 ± 0.36 3.67 ± 0.58 Mean RT (ms) 283.1 ± 6.24 320.2 ± 10.68 Median RT (ms) 268.5 ± 7.21 301.3 ± 9.68
Medium Vibration Amplitude 0.4 ms-2 rms
Pre-exposure Post-exposure
1 2 3 4 5 6 7 8 9
S
u
b
je
c
ti
v
e
S
le
e
p
in
e
s
s
S
c
o
re
(
K
S
S
)
N o V i b r a t i o n
5 - m i n E x p o s u r e
1 0 - m i n E x p o s u r e
1 5 - m i n E x p o s u r e
A f t e r - 2 0 m i n E x p o s u r e
L o w a m p l i t u d e 0 . 2 m s- 2
M e d i u m a m p l i t u d e 0 . 4 m s- 2
FIG. 2. The mean of subjective sleepiness scores (KSS) for
all the volunteers in two vibration conditions (low amplitude vibration and medium vibration amplitude) are shown.
4
DISCUSSIONPrior studies have noted the effect of low vibration amplitude on seated human drowsiness [15]. A strong relationship between vibration and drowsiness level has been reported, and the obtained results showed a significant increase in reaction time following 20-minutes exposure to vibration [16], [17]. Findings from this study corroborate the ideas of Amzar et al, [15], who suggested that increasing the amount of vibration amplitude may impair the human alertness level more. In the current study, comparing low vibration amplitude (0.2 ms-2 r.m.s) with medium vibration amplitude (0.4 ms-2 r.m.s) showed that the degree of drowsiness measured by PVT indexes was more pronounced when the amplitude of vibration is doubled. By increasing the transmitted vibration to the human body, the drowsiness level becomes more apparent, and the result was very significant. These findings confirm the association between vibration exposure and drowsiness level. Another important finding was that the investigation did not show any significant difference in subjective measurement (KSS) in both conditions of vibration. It was hypothesized that participants could not a give good judgement of drowsiness level when they were drowsy. This finding was consistent with the current literature [18]. This finding has important implication for developing a drowsiness contour that provide a comprehensive guideline in whole-body vibration area. However, more research on this topic needs to be undertaken before the association between vibration exposure, and drowsiness level is more clearly understood.
5
CONCLUSIONSThe present study was designed to determine the effect of vibration on seated occupant. The results obtained support the hypothesis that low-frequency vibration between 1 -15 Hz has considerable influences on human drowsiness level. Comprehensive objective measurement (PVT) and subjective evaluation (KSS) have been carried out in order to assess the effects of vibration on the seated occupant drowsiness level. From this investigation, the obtained result shows that the medium vibration amplitude (0.4 ms-2 r.m.s) has a higher level of
drowsiness perceived by volunteers compared to low vibration amplitude (0.2 ms-2 r.m.s). However, no significant difference were found in subjective drowsiness level measured by KSS in both conditions of vibration. The substantial increase in reaction time and number of lapse measured by PVT test were observed in
both conditions with a higher degree of error in medium vibration amplitude. This study concludes that, with the increasing amount of vibration amplitude level, the slower reaction time made by volunteers that indicate the increased level of drowsiness.
R
EFERENCES[1] J. T. Arnedt, G. J. Wilde, P. W. Munt, and a W. MacLean, ―How do prolonged wakefulness and alcohol compare in the decrements they produce on a simulated driving task?,‖ Accident; Analysis and Prevention, vol. 33, no. 3, pp. 337–44, May 2001.
[2] P. Philip, P. Sagaspe, N. Moore, J. Taillard, A. Charles, C. Guilleminault, and B. Bioulac, ―Fatigue, sleep restriction and driving performance.,‖ Accident; Analysis and Prevention, vol. 37, no. 3, pp. 473–8, May 2005.
[3] M. F. M. Amzar, ―Effects of vehicle seat dynamics on ride comfort assessment,‖ in International Congress on Noise and Vibration, 2013.
[4] M. Fard, ―structural dynamics characterization of the vehicle seat for NVH performance analysis.,‖ SAE Technical Paper, pp. 1–12, Oct. 2011.
[5] M. Basner and D. F. Dinges, ―Maximizing sensitivity of the psychomotor vigilance test (PVT) to sleep loss.,‖ Sleep, vol. 34, no. 5, pp. 581–91, May 2011.
[6] C. Anderson, A. W. J. Wales, and J. A. Horne, ―PVT lapses and the eyes PVT lapses differ according to eyes open, closed, or looking away,‖ Sleep, 33 (2), pp. 197-204, 2010.
[7] M. L. Jackson, R. J. Croft, G. a Kennedy, K. Owens, and M. E. Howard, ―Cognitive components of simulated driving performance: Sleep loss effects and predictors.,‖ Accident; Analysis and Prevention, vol. 50, pp. 438–44, Jan. 2013.
[8] International Standard, ―ISO 2631-1 Mechanical vibration and shock - Evaluation of human exposure to whole-body vibration.‖ 1997.
[9] M. W. John, ―A new method for measure daytime sleepiness the Epworth Sleepiness Scale.‖ American Sleep Disorder Association and Sleep Research Society, p. 14(6): 540–545, 1991.
[10] N. L. Shattuck and P. Matsangas, ―Psychomotor vigilance performance predicted by Epworth Sleepiness Scale scores in an operational setting with the United States Navy.,‖ Journal of sleep research, Oct. 2014.
[11] M. Karimi, J. Hedner, C. Lombardi, W. T. Mcnicholas, T. Penzel, R. L. Riha, D. Rodenstein, and L. Grote, ―Driving habits and risk factors for traffic accidents among sleep apnea patients - a European multi-centre cohort study.,‖ Journal of sleep research, vol. 23, no. 6, pp. 689–99, Dec. 2014.
141 of Respiratory and Critical Care Medicine, vol. 170, no. 9, pp.
1014–21, Nov. 2004.
[13] M. Y. Khitrov, S. Laxminarayan, D. Thorsley, S. Ramakrishnan, S. Rajaraman, N. J. Wesensten, and J. Reifman, ―PC-PVT: a platform for psychomotor vigilance task testing, analysis, and prediction.,‖ Behavior Research Methods, vol. 46, no. 1, pp. 140–7, Mar. 2014.
[14] M. Gillberg, G. Kecklund, and T. Akerstedt, ―Relations between performance and subjective ratings of sleepiness during a night awake.,‖ Sleep, vol. 17, no. 3, pp. 236–41, Apr. 1994.
[15] A. M. F. Azizan, ―The influence of vibrations on vehicle occupant fatigue,‖ Internoise Conference, vol. 62, no. ISO 2631, pp. 1–15, 2014.
[16] Y. Satou, T. Ishitake, H. Ando, K. Nagatomi, M. Hoshiko, Y. Tsuji, H. Tamaki, A. Shigemoto, M. Kusano, M. Mori, and K. Hara, ―Effect of short-term exposure to whole body vibration in humans: relationship between wakefulness level and vibration frequencies.,‖ The Kurume Medical Journal, vol. 56, no. 1–2, pp. 17–23, Jan. 2009.
[17] Y. Satou, H. Ando, M. Nakiri, K. Nagatomi, Y. Yamaguchi, M. Hoshino, Y. Tsuji, J. Muramoto, M. Mori, K. Hara, and T. Ishitake, ―Effects of short-term exposure to whole-body vibration on wakefulness level.,‖ Industrial Health, vol. 45, pp. 217–223, 2007.