QUALITY EDUCATION: GETTING QUALITY RIGHT
Guleria Chandan
1, Ucharia Vikas
2, Tharega P
3 1.2School of Engineering, Bahra University, Wakhnaghat, H.P. (India)
3
Ex Head, Deptt. of MET. Engg. Punjab Engineering College, Chandigarh (India)
ABSTRACT
India is the youngest country of the world and is now facing a dire need to increase its technical force to accomplish as a developed country. The technical standards have been declining in India for the past 2 to 3 years despite of the competitive admission process. In India the number of the elite engineering colleges has seen a rise by 55 %( from 90153 to 140000) where as the number of the students are now growing smaller. The author has made a study regarding the major sets of the input based indicators i.e. the quantity and quality of new engineering students, the finance of undergraduate courses, availability of qualified factory and many more. This study may promote re-assessment of the current curriculum and accredited principles for Engineering Educational System. This study should foster an examination fit and stop the descent of the engineering students by not paring with quality. Author has applied Failure Mode Effect Analysis (FMEA), Cause and failure analysis and has used Pareto principle to contemplate and has recommended some suggestions by using the Six Sigma Methodology.
Keywords: Indicators, Engineering Educational System, Failure Mode Effect Analysis, Pareto
I. INTRODUCTION
Engineering education has turned earth into a paradise. Technical education has played a vital role in the social
and economic wellbeing of the nation [1]. Engineering colleges in India are performing without sustaining
quality technical education [2]. Managing quality in education is not same as that in case of the industries and
manufacturing units, whereas the principles that are used in the industries can be applied to the education sector.
Most of the performance measurement system in education system does not reflect the actual potential that lies
within the institution. Quality has now become a decisive factor in attracting the students and faculty to the
institution. Many engineering institutions have now opted for the ISO 9000 system in order to improve results
and wealth. In the last 5 years the number of institutions offering technical education has seen a large increase
whereas unfortunately the quality of education is not satisfactory. Now-a-days high student failure in
examination and fewer amounts of placement opportunities are creating havoc in institutions which in
manufacturing units are considered as defects. This is the right time to study the various types of the failures that
are accruing in the system and to study if they can or cannot be removed.
II. CONCEPT OF SIX SIGMA
Six sigma can be viewed as a metric, a mindset, a methodology [4]. It is a new approach to the quality assurance
and quality management. The main purpose of this to reach level of quality and reliability that will satisfy and
Motorola in 1980’s and its philosophy has been widespread in the field of the manufacturing
industry,Healthcare,Education and many more[6].
2.1 Six Sigma Methodology
Six sigma is a process improvement methodology which includes different phases logically linked with one
another. Six sigma methodologies are generally described by the acronym DMAIC (Define, Measure, Analyze,
Improve and Control) is used for continuous improvement of already existing products or processes [7]. One of
the important aspects of six sigma is the involvement, training and reward of employees at all levels of the
organization. Champions at the executive levels guide the selection of projects, securing of resources and goal
setting for improvement efforts. Employees are given martial arts titles such as Master black belt, Black belt ,
Green belt, etc., reflecting their training and status in project improvement efforts [8].
III. CASE STUDY
A case study has been under taken in reputed engineering educational institutes of Himachal Pradesh of India. In
these institutions, the aspect of quality is being overlooked, as profitability is emerging as the primary motto.
The measure of quality in the technical education is done with the parameters such as job placements, passing
rate of students, extra-curricular activities etc. Various industrial tools are used to study the various defects in
the institutes (defects here include less number of students, minimal placements, loss of students).An initiative
has been taken to contemplate the various causes and then give recommendations.
Voice of customer
Customer requirement
CTQ
Good education
Excellent faculty,good infrastructure, facilities,
placements
%SSCI
%SSHE
%SE
Method:
Parasuraman (1991) developed a SERVQUAL scale to measure service quality. SERVQUAL and itsadapted versions have been employed extensively in different services such as banking, retail, wholesale, health,
education in both developed and to some extent in developing nations (Babakus and Mangold, 1992; Dabholkar
1996; Chua, 2004; Tan and Kek, 2004; Mahapatra and Khan, 2007; Aghamolaei and Zare, 2008). [3] This tool
remains popular despite severe criticisms (Cronin and Taylor, 1992, 1994; Carman, 1990; Schneider and White,
2004). Initially, Parasuraman (1991) identified ten determinants that characterized customers’ perceptions of
service quality. These determinants were reduced to five factors in their subsequent studies and comprised
tangibles, reliability, responsiveness, assurance and empathy. The SERVQUAL instrument based on these five
determinants used 22 items and a seven-point Liker scale ranging from “strongly disagree” to “strongly agree”.
Several studies have been carried out successfully in other countries based on the adapted version of the
SERVQUAL instrument to assess student perceptions of service quality.
Based on the SERVQUAL, an instrument for measuring quality in technical education was developed and
validated. The new scale EduQUAL comprises of 28 items with five dimensions: Learning Outcomes,
3.1 Data Analysis
The data reduction and verification usually makes the data in a sorted manner that can be utilized in an
organized order.
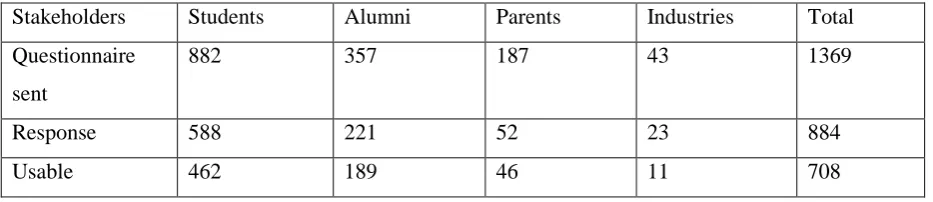
Table 4.1 Details of Questionnaire
3.2 Data Reduction
The useful responses that have tested after the validity and reliability are found to be 818.The test for quantitate
validity was concluded by the factor analysis test that has been for the proposed 96 variables that has been
proposed. Principal component [40] method has been used to find quantitative validity and followed by the
Chronback’s Alpha [42] to check the internal consistency between the values. This all testing is done on the
Statistical Package for Social Sciences (SPSS 14.0). The total items that have loaded more than 0.5 are kept
under five dimensions viz. Student Service, Personality Development, Academics, Management Facilities and
Alumni salutation. 42 items under five dimensions have been found relevant and,”EduQUAL” is being used in
technical education system. There are several items that does not makes to the list which includes course
explanation, record keeping, management helpful etc.
The internal consistency is being checked and tested by the Cronbach’s Alpha SPSS 14.0 software. The value for the five dimensions that has been mentioned above is found to be near 0.91.Since the combined value has
been found to be near numeric number 1 and well above the minimum requirement of 0.70. Therefore it
establishes the internal consistency of the data.
The instrument contains 42 items under consideration which has observed a mark of 0.50 in the factor analysis
and has been classified into the five categories:
1. Student Service: Student has been provided with the service dependability like availability of teachers and
course that has been important towards the course they have opted out.
2. Management facilities: physical facilities, machines and equipment, library and several other facilities.
3. Personality Development: overall development of a student in respect to the knowledge he/she has and
ability to present themselves effectively.
4. Academics: Result focused individual reports on the students and the performance as an individual.
5. Alumni Salutation: willing to comfort and help the customer i.e. actually student.
Stakeholders
Students
Alumni
Parents
Industries
Total
Questionnaire
sent
882
357
187
43
1369
Response
588
221
52
23
884
Table 4.2 Test for Reliability (Cronbach Alpha)
Dimensions of EduQUAL Alpha For Each Item Alpha for total
1. Student Service 0.82
0.91
2. Management Facilities 0.71
3. Personality Development 0.89
4. Academics 0.92
5. Alumni salutation 0.89
3.3 Fishbone Diagram
The Cause-and –Effect analysis [9] is a graphical approach to the major classifications of the problems and
potential causes. This also is referred to as fishbone analysis, a name derived from the fish shaped pattern used
to plot the relationship between the various factors that contribute to a specific event.
3.4 Fmea Analysis
Failure Mode and Effects Analysis [10] (FMEA) was one of the first systematic techniques for failure analysis.
It was developed by reliability engineers in the 1950s to study problems that might arise from malfunctions of
military systems. An FMEA is often the first step of a system reliability study. It involves reviewing as many
components, assemblies, and subsystems as possible to identify failure modes, and their causes and effects. For
each component, the failure modes and their resulting effects on the rest of the system are recorded in a specific
Process Potential Failure mode Potential effect
Of failure
mode Frequ ency (likeli ness scale
1 –
10) Potential causes of failure Current process Control (prevention) Current process control (detection) Sever ity
(1 –
10)
Detect
ability
(potent
ial for
discov
ery 1
-10) Risk priorit y numb er Good educatio n Teaching
Staff not
good
Lack of ideas
for students
6 Not
trained
teachers
Training
should be
provided
Students not
performing
8 8 384
7 Non
serious
attitude of
teachers
Should be
hardworking
and fair
Attendance
very low
6 8 336
7 Discrimin
ation by
teachers
7 6 252
Students
not serious
Reputation of
college
depreciate
7 Not strict
rules in
academics
All things
should be
transparent
Lack of
interest in
subjects
6 7 294
9 Not
discipline
d
Regulations
not followed
8 8 576
Books/Jour
nal not
available
Lack of new
technologies
8 Not
provided
by
managem
ent
Journals/onlin
e libraries
subscriptions
Half-yearly
check of
stocks
7 9 504
3.5 Relative importance of the ‘EduQUAL’ items and dimensions
After the data reduction and the tabulation of the data that have been collected it has been found that data has
been varied from the lowest response i.e. 1 to the highest response i.e. 7 in the questions that has been asked.
The dimensions are being considered five in the number first of which is student service which include the
Figure.4.1: Average Response Score of Students for all EduQUAL Items.
As per the above Pareto Analysis if we rely on the 80:20 principle, if we are able to resolve the 80 percent of the
problems then we are able to solve most of our problem we are facing in the above mentioned problems. The
problems that constitute the 80 percent mark are only considered in this.The FMEA chart we get after resolving
the problems :
Process Potential Failure mode Potential effect
Of failure
mode Frequ ency (likeli ness scale
1 –
10) Potential causes of failure Current process Control (prevention) Current process control (detection) Sever ity
(1 –
10)
Detect
ability
(potent
ial for
discov
ery 1
-10) Risk priorit y numb er Good educatio n Teaching
Staff not
good
Lack of ideas
for students
5 Not
trained
teachers
Training
should be
provided
Students not
performing
7 7 245
7 Non
serious
attitude of
teachers
Should be
hardworking
and fair
Attendance
very low
7 6 294
7 Discrimin
ation by
teachers
Students
not serious
Reputation of
college
depreciate
6 Not strict
rules in
academics
All things
should be
transparent
Lack of
interest in
subjects
8 5 240
6 Not
discipline
d
Regulations
not followed
7 7 294
Books/Jour
nal not
available
Lack of new
technologies
8 Not
provided
by
managem
ent
Journals/onlin
e libraries
subscriptions
Half-yearly
check of
stocks
6 7 336
IV. CONCLUSION
The conclusion from the above is that we need to focus on the quality which is mentioned by the students in the
education system. The students has perceived the management efforts as the major issue towards the lack of
quality education in the system and various CTQ factors being studies as the major criteria as students selected
as entrepreneurs, students selected from campus interview. The Six sigma and other industrial tools therefore
can be used for the improvement of the quality in education system and therefore they can be used to define,
measure and control the quality. Quality can be perceived and therefore controlled by also using various
industry tools and which is clear from the Failure Mode Effect Analysis. These tools have set a control over the
education quality and increased the performance of the institutions. Furthermoreapplications of the industrial
tools can be used like Taguchi method, Quality Function Deployment etc.
REFERENCES
[1]. Raj Kumar, R.V, “Engineering Education in India - Quality concerns and Remedial Measures”, The Indian
Journal of Technical Education 2007; 30(3):73-90.
[2]. Ramachandran, H and Anil Kumar, “Engineering education in India”, Productivity 2003; 44(2): 187-194.
[3]. Parasuraman, A., Zeithaml, V.A. and Berry, L.L. (1988), “SERVQUAL: a multiple-item scale for
measuring consumer perceptions”, Journal of Retailing, Vol. 64 No. 1, pp. 12-40.
[4]. Goffnett, S.P. (2004), “Understanding Six Sigma: Implications for Industry and Education”, Journal of
Industrial Technology 2004; 20(4):1-10
[5]. Sokovic. M, Pavletic. D and Krulcic.E (2006), “Six Sigma process improvements in automotive parts
production”, Journal of Achievements in Materials and Manufacturing Engineering 2006; 19(1): 96-102
[6]. Maha Mohammed Yusr, Abdul Rahim Othman, SanySanuri M. Mokhtar. (2011). "Six Sigma and
Innovation Performance: A Conceptual Framework Based on the Absorptive Capacity Theory Perspective",
[7]. YousefAmer, Lee Luong, Sang - Heon Lee and M.Azeem Ashraf , “Optimizing order fulfillment using
design for six sigma and fuzzy logic”, International Journal of Management Science and Engineering
Management 2008; 3(2): 83-99
[8]. Monica C. Holmes, Anil Kumar and Lawrence O. Jenicke , “Improving the Effectiveness of the Academic
Delivery Process Utilizing Six Sigma”, Issues in Information Systems 2005; 6(1):353-359