Recent Developments in the CONRAD Code regarding
Experimental Corrections
P. Archier1,a, C. De Saint Jean1, S. Kopecky2, O. Litaize1, G. Noguè re1, P. Schillebeeckx2, K. Volev2
1CEA, DEN, DER, SPRC, LEPh, Cadarache, F-13108 Saint-Paul-lez-Durance, France 2EC-JRC-IRMM, Retieseweg, 2440 Geel, Belgium
Abstract. The CONRAD code is an object-oriented software tool developed at CEA
Cadarache since 2005 to deal with problems arising during the evaluation process (data assimilation and analysis, physical modelling, propagation of uncertainties. . . ).
This paper will present recent developments concerning the experimental corrections, which are required when a neutron resonance shape analysis is performed. Several ex-perimental aspects are detailed in this work:
- the possibility to use spectra in energy as well as in time,
- the implementation of both analytical (Chi-Square) and Monte-Carlo resolution func-tions,
- the sample homogeneity corrections using log-normal distributions.
Each development aspect is illustrated with several examples and comparisons with other resonance analysis codes (SAMMY, REFIT).
1 Introduction
The CONRAD code [1] is an object-oriented software tool developed at CEA Cadarache since 2005 to deal with problems arising during the evaluation process (data assimilation and analysis, physical modelling, propagation of uncertainties. . . ).
This paper presents recent developments concerning the experimental corrections, which are re-quired for a neutron resonance shape analysis. First, we will explain in Section 2 how CONRAD deals with different types of measurement, which can be provided by users either in energy or in time-Of-flight (ToF). In Section 3, we will detail several resolution functions currently implemented and their validations with other resonance analysis codes such as SAMMY [2] and REFIT [3]. Section 4 presents the sample homogeneity corrections required when evaluators want to analyse experiments with thin powder samples, such as U/Pu oxydes.
2 Time-Of-Flight Experimental Parameters
We introduced in the code two parameters related to ToF experiments: the well-known flight pathFP and the initial delay/time offsett0. From now on, if the flight path is provided in the input, CONRAD
ae-mail: [email protected]
C
works in time instead of energy. For instance, if measurements in energy and the flight path are given, the code will first convert the energy grid back in ToF, with Eq. (1), and only then it will do the analysis.
tn[ns]'72298·
FP[m] √
En[eV]
−t0[ns] (1)
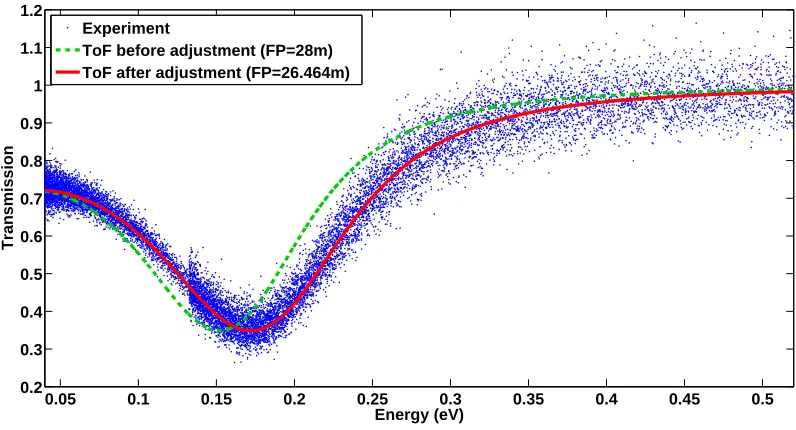
Since the flight path is a parameter that can be fitted, we prepared a dummy experiment (113Cd transmission) where the flight path has been changed to a wrong valueFP =28.m (instead of the original value: 26.464 m). Figure 1 shows the calculated transmissions before the adjustment of the FP, where the data are obviously shifted, and the calculated transmissions after the fit which are in excellent agreement with the data.
0.05 0.1 0.15 0.2 0.25 0.3 0.35 0.4 0.45 0.5
0.2 0.3 0.4 0.5 0.6 0.7 0.8 0.9 1 1.1 1.2
Energy (eV)
Transmission
Experiment
ToF before adjustment (FP=28m) ToF after adjustment (FP=26.464m)
Figure 1.113Cd transmissions before and after adjustement of the flight path parameter
3 Resolution Functions
Resolution function broadening is necessary for most of experimental data analysis [4]. Actually, the true observables can be written respectively for transmissions and capture yields:
Te f f(E)= Z
R E0,ET(E)dE0 (2)
Ye f f(E)= Z
R E0,EY(E)dE0 (3)
These deviations in the Time-Of-Flight measurements are mainly due to:
• the accelerator burst widthtb
• the time channel widthtc
• the target-moderator assemblyLmod
• the Lithium glass detectorLdet(for transmission only)
• etc. . .
Two kinds of resolution functions have been implemented in CONRAD. The first one is analyt-ical: aχ2 withndegrees of freedom (see Eq. (4)), which is commonly used to represent the time
distribution in the moderator assembly. This resolution function contains a parameterλ, depicting the mean free time (or mean free path ifRis expressed in distance) of the neutrons in the moderator. At the moment, theλparameter is constant with the incident neutron energy in CONRAD whereas it is energy-dependent in SAMMY and REFIT. The implementation in CONRAD allows the users to choose between aχ2distribution in time (in nanoseconds) or in distance (in meters).
R(t)∝ t
λ (n2−1)
·exp
−t λ
(4)
The second resolution function is a numerical one, also called in SAMMY as UDR or User-Defined Resolution. In this case, the users provide the different distributions (one distribution for a given incident neutron energy) which are calculated with Monte-Carlo simulations of the experimental facility. Those distributions can describe a part (moderator assembly, detector. . . ) or the whole exper-imental setup. In CONRAD, users can also provide their resolution functions in time or in distance. Furthermore, we choose a log-lin interpolation for neutron energies between two distributions.
11400 1145 1150 1155 1160 10
20 30 40 50 60
Energy (eV)
Capture cross−section (barns)
REFIT (ChiSquare RF) CONRAD (ChiSquare RF)
11400 1145 1150 1155 1160 10
20 30 40 50 60
Energy (eV)
Capture cross−section (barns)
REFIT (Numerical RF) CONRAD (Numerical RF)
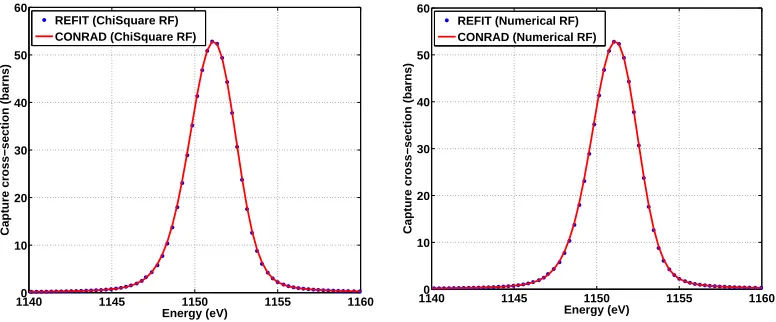
Figure 2.Comparisons of26Fe capture cross-sections (FGM atT
e f f =293.6 K) between CONRAD and REFIT
with the analytical (χ2withλ=5.83 mm) and numerical resolution functions
using theχ2 resolution function (withλ = 5.83 mm) and the numerical resolution function (with
distributions coming from theχ2 RF). The agreement with the reference code REFIT is excellent.
Other comparisons (not displayed for the sake of clarity) have been made versus the SAMMY code and the overall agreement is also very satisfactory.
11400 1142 1144 1146 1148 1150 1152 1154 1156 1158 1160
10 20 30 40 50 60 70
Energy (eV)
Capture cross−section (barns)
without RF ChiSquare RF
Num. RF (with dist. from ChiSquare)
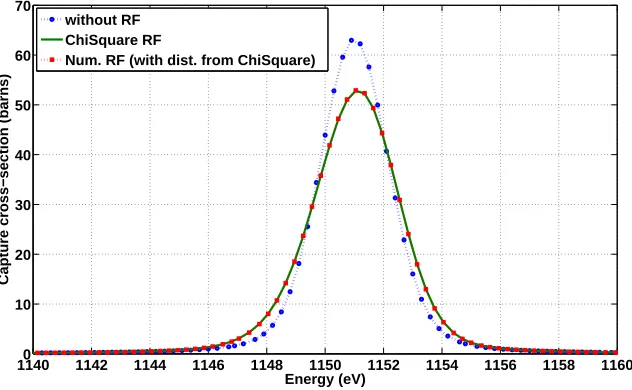
Figure 3. Capture cross-sections from CONRAD without resolution broadening, with theχ2and with the
nu-merical resolution functions
On Figure 3, we can observe the different capture cross sections calculated with CONRAD with-out resolution broadening, with theχ2 RF and with the numerical RF. The impact of the resolution
function on the56Fe resonance is quite large and highlights the importance of resolution-broadening
during the resonance shape analysis in this case.
4 Sample Homogeneities
Sample homogeneity corrections are required when evaluators want to analyse measurements through samples containing inhomogeneities, commonly found in thin powder samples such as U/Pu oxy-des. For instance, those samples can show large porosity (holes) or/and a non-constant thickness. In Ref. [5], S. Kopecky detailed a model to describe the thickness in the sample using a log-normal dis-tribution. This model is available in the REFIT code to account for powder sample inhomogeneities and it has been implemented in CONRAD as well for transmission experiments.
The experimental modeling of the transmission without sample inhomogeneities is given in Eq. (5), wherenstands for the thickness (areal density) of the sample (in at./barn).
T(E)=exp [−n·σtot(E)] (5)
Figure 4.Porositypin the real sample (left) and model used for transmission (right)
T(E)=(1−p)·exp "
− n
(1−p)·σtot(E) #
+p (6)
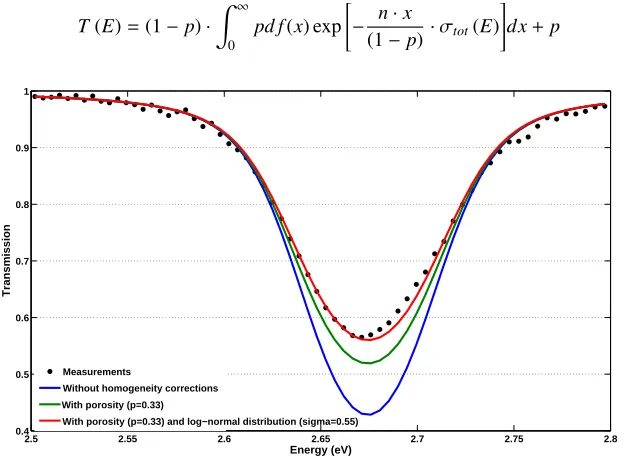
Eq. (7) presents the generalization of the transmission in presence of porosities and using a prob-ability density functionpd f (a log-Normal distribution) for the thickness.
T(E)=(1−p)·
Z ∞
0
pd f(x) exp "
− n·x
(1−p)·σtot(E) #
dx+p (7)
2.5 2.55 2.6 2.65 2.7 2.75 2.8
0.4 0.5 0.6 0.7 0.8 0.9 1
Energy (eV)
Transmission
Measurements
Without homogeneity corrections With porosity (p=0.33)
With porosity (p=0.33) and log−normal distribution (sigma=0.55)
Figure 5.Sample homogeneity corrections on242Pu transmission experiment
As a validation purpose, we used 242Pu transmission measurements, with a thickness n =
measurements improves significantly. At last, the calculated transmissions with the full sample cor-rections (porosity and log-Normal thickness distribution) are almost able to reproduce correctly the experimental data. Still, on the right wing of the resonance, the agreement is not perfect and should be improved using a Crystal Lattice Model instead of the Free Gas one.
5 Conclusion
Several developments in CONRAD focusing on experimental corrections have been carried out. Users can analyse both energy and Time-of-Flight measurements in the same way. Two kinds of resolution functions, analytical (χ2) and numerical, have been implemented and validated versus REFIT and
SAMMY. Also, sample inhomogeneities corrections for porosity and thickness distribution in the case of transmissions have been tested in CONRAD.
In the near future regarding the experimental corrections, the implementation of new analyti-cal resolution functions, such as gaussian distribution, will be considered. Also, we plan to add an energy-dependence for theλparameter used in theχ2resolution function. Finally, the current Crystal Lattice Model implemented in CONRAD needs to be validated and tested on the242Pu transmission experiments with inhomogeneities.
6 Acknowledgements
This work has been carried out in the framework of the ERINDA project and the CEA/IRMM collab-oration. One of the authors (P.A.) would like to thank the IRMM members for the fruitfull discussions and particulary to P. Schillebeeckx, S. Kopecky and K. Volev.
References
[1] C. De Saint Jean, B. Habert, O. Litaize, G. Noguère, C. Suteau,Status of CONRAD, a nuclear reaction analysis tool, inProceedings of the International Conference on Nuclear Data for Science and Technology - ND2007, edited by EDP Sciences (Nice, France, 2007).
[2] N.M. Larson,Updated Users: Guide for SAMMY: Multilevel R-Matrix Fits to Neutron Data Using Bayes Equations, Oak Ridge National Laboratory Tech. Report, ORNL/TM-9179/R8, (2008). [3] M.C. Moxon, T.C. Ware, C.J. Dean,REFIT-2009 A Least-Square Fitting Program for Resonance
Analysis of Neutron Transmission, Capture, Fission and Scattering Data, Users’ Guide for REFIT-2009-10, Tech. rep., UKNSF (2010).
[4] F.H. Fröhner,Evaluation and Analysis of Nuclear Resonance Data, OECD/NEA JEFF Report 18 (2000).
[5] S. Kopecky, P. Siegler, A. Moens,Low energy transmission measurements of240,242Pu at GELINA