Available online on 15.04.2019 at http://jddtonline.info
Journal of Drug Delivery and Therapeutics
Open Access to Pharmaceutical and Medical Research
© 2011-18, publisher and licensee JDDT, This is an Open Access article which permits unrestricted non-commercial use, provided the original work is properly cited
Open Access
Research Article
Process variable studies for preparation of optimized system for bupropion
hydrochloride using CCD
Gupta Aparna 1, Sharma Vijay 2, Singh Lalit 1*
1 Shri Ram Murti Smarak College of Engineering & Technology, (Pharmacy), Bareilly, Uttar Pradesh
2 Faculty of Pharmacy, IFTM University, Moradabad, Uttar Pradesh
ABSTRACT
Aim of present work is to develop optimized sustained release dosage form of Bupropion hydrochloride using Formulation by Design (FbD) approach. Development and optimization of formulation batches was done by design experiment using Central Composite Design (CCD). Tablets were formulated by direct compression technique and evaluated. The impact of independent variables like concentration of Hydroxypropyl Methyl Cellulose (HPMC K4M) and Carbopol (CP 934P) were observed on dependent variable like hardness of tablet, drug release in 12 h (Q12h) and the time for fifty percent release of drug (T50%). Polynomial equations were generated using multiple linear regression analysis (MLRA), response surface plots and contour plots were drawn, optimum formulations were selected by brute force method. The hardness and Q12h was found in the range of 4.4- 4.7 Kg/cm2 and 88.19- 96.7% respectively, while T50% was found in the range of 3.5- 5.5h. Validation of optimization study performed using four confirmatory experimental runs which indicated very high degree of prognostic ability of FbD methodology with percentage error varied between -0.024% and 0.024 %. The overlaying of all these plots provided an overlay plot, which signified the region of optimization. Thus, central composite design (CCD) is a useful tool in the development of optimized dosage form along with the significance of independent variable as well as least investment of money, manpower and time.
Keywords: Formulation by Design, Central Composite Design, Bupropion Hydrochloride.
Article Info:Received 23 Feb 2019; Review Completed 30 March 2019; Accepted 05 April 2019; Available online 15 April 2019
Cite this article as:
Gupta A, Sharma V, Singh L, Process variable studies for preparation of optimized system for bupropion hydrochloride using CCD, Journal of Drug Delivery and Therapeutics. 2019; 9(2-s):281-290 http://dx.doi.org/10.22270/jddt.v9i2-s.2513
*Address for Correspondence:
Lalit Singh, Shri Ram Murti Smarak College of Engineering & Technology, Ram Murti Puram, Bareilly-Nainital, Bhojipura, Bareilly, Uttar Pradesh, 243202.
Introduction
Bupropion Hydrochloride is an antidepressant of the amino-ketone class, which is chemically unrelated to tricyclic, tetracyclic, serotonin reuptake inhibitor, or other known
antidepressants. It is somewhat related to
phenylethylamines 1. Bupropion is an atypical
antidepressant, which is used for depression as well as for
smoking cessation. This is the first-line treatment for
tobacco cessation 2. As per state by Maurizio Fava et al.,
Bupropion is having a lower incidence of weight gain, sexual dysfunction and somnolence as compared to all the newly discovered antidepressants so far. It is proved to be an effective antidepressant, in terms of efficacy as compared to Selective Serrotonin Reuptake Inhibitor (SSRI) and other antidepressants. This drug can also be used as an adjunctive therapy, for the reversal of other antidepressant induced
sexual dysfunction and also to elevate their efficacy3. The
depression has out broken on today’s youth, and the reason might be their lifestyle. Several studies in elders revealed
that, especially death in the family and financial problems are the most drastic events for depression and the same
happens in the case of adolescents4.Since depression and
smoking are the two most major problems of our society. So, such reasons necessitate formulating a Sustained Drug Delivery System (SDDS) of Bupropion Hydrochloride, which would become a good solution for such problems. Thus a
floating-bioadhesive formulation of Bupropion
Hydrochloride could be a most suited form, as the bioavailability of the drug will be more predictable and there will be a better control in the fluctuations in plasma drug
concentration5.
Optimization is a smarter way for substituting the trial and error method for formulating any drug delivery system. Trial and error method was a traditional method for preparation of any formulation and was having certain limitations like; time consuming, uneconomical, energy utilising and
unpredictable6.Thus optimization is the process for finding
the existing sources while taking into account all the factors
that somehow influence decisions in any experiment 7. The
word optimize defines itself as perfect, effective and
functional as possible. “Variables” and “factors” plays vital
role in the process of optimization. There are two types of variables i.e. independent and dependent. Independent variables are those, which are not dependent on any other value, e.g. concentration of binder, drug to polymer ratio, etc, whereas dependent variables are those which depends on the concentration of independent variables used. Factors are basically assigned variables such as concentration,
drug-to-polymer ratio, temperature etc8.
Formulation by design (FbD), is one of the optimization technique, which specifically make use of design of experiment (DoE) in drug formulation development. It is a sort of statistical strategy which helps in organizing the experiments in such a manner, that the required information is obtained as efficiently and precisely as possible. FbD is useful in systematically optimizing almost all types of orally administered drug delivery systems. Besides screening, this method is also advantageous for systematically developing
products as well as processes9.It acts as a beneficial tool for
attaining scientific knowledge regarding establishment of multi- factorial relationship. Because of all above said
reasons, this method is gaining popularity for the production
process in industries9.
Materials & methodology
Materials:
Bupropion Hydrochloride was obtained as gift sample from Lara Labs, India; HPMC K4M purchased from Colorcon Asia Pvt. Ltd., India; CP934P from Zydus Cadila, India; magnesium stearate, talc and microcrystalline cellulose from SD Fine, India; were also used in the study. All other chemicals used were of analytical grade and used as received. Double distilled water was used in the study.
Pre-optimization studies:
Selection of polymers & their range
The task of designing the sustained release tablet of
Bupropion Hydrochloride with desired release
characteristics began with the selection of potential polymer that allows the matrices to sustain the release of drug. During preliminary studies, three polymers CP934P, HPMC K4M & HPMC K100M were investigated for formulating oral sustained tablet of Bupropion Hydrochloride. After intensive investigation of various literatures, polymers and excepients (Table 1) were selected for pre-optimization studies.
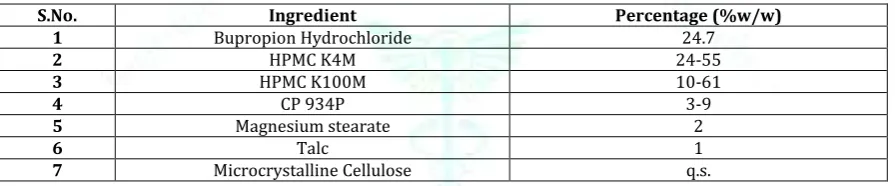
Table 1: List of ingredients and their selected range
S.No. Ingredient Percentage (%w/w)
1 Bupropion Hydrochloride 24.7
2 HPMC K4M 24-55
3 HPMC K100M 10-61
4 CP 934P 3-9
5 Magnesium stearate 2
6 Talc 1
7 Microcrystalline Cellulose q.s.
Preparation of sustained release tablets of Bupropion Hydrochloride
The pre-optimization batches (Batch A and B) were prepared, by using direct compression technique as per the formula stated in table 2.
Table 2: Selected Formula for tablet preparation for pre-optimization
S.No. Ingredient Batch A Batch B
1 Bupropion Hydrochloride 24.7 % 24.7%
2 HPMC K100M 35.5% -
3 HPMC K4M - 39.5%
4 CP 934P 6% 6%
5 Magnesium stearate 2% 2%
6 Talc 1% 1%
7 Microcrystalline Cellulose q.s. q.s.
Initially, the drug and the polymers (HPMC K4M and HPMC K100M) were passed through mesh # 60 sieve. After that, glidant, lubricant and diluents were passed through mesh # 120 sieve. Then for preparing an appropriate powder blend all the ingredients were taken in a V- cone blender and were allowed to mix properly for 10 minutes. Finally the tablets were prepared by compressing the powder blend in tablet
compression machine (Rimek Mini Press- I) having 12mm
flat faced punch10.
The prepared trial batches were subjected for two
evaluation parameters i.e. swelling index and in-vitro
Table 3: Formula for Experimental Design
Therefore various batches (F1- F13) were prepared using Central Comopsite Design (CCD), as shown in table 4. CCD with α = 1(face centred) was employed as per the standard protocol and thirteen batches were prepared by using HPMCK4M and CP934P where centre point was taken in
quintuplicate (all experimental runs, coded and actual levels
of independent variables were summarized in table 4)11. In
the study impact of varying concentration of HPMC K4M (A)
and CP934P (B) on dependent variables like hardness, Q12h
and T50.
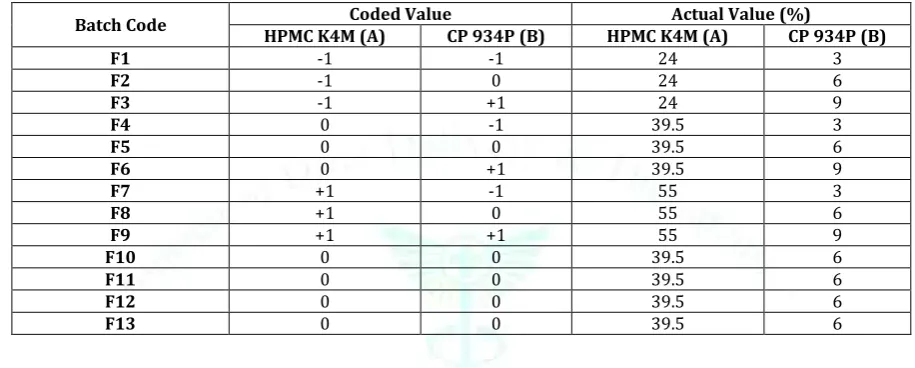
Table 4: Various batches, with their coded values and actual values
Batch Code HPMC K4M (A) Coded Value CP 934P (B) HPMC K4M (A) Actual Value (%) CP 934P (B)
F1 -1 -1 24 3
F2 -1 0 24 6
F3 -1 +1 24 9
F4 0 -1 39.5 3
F5 0 0 39.5 6
F6 0 +1 39.5 9
F7 +1 -1 55 3
F8 +1 0 55 6
F9 +1 +1 55 9
F10 0 0 39.5 6
F11 0 0 39.5 6
F12 0 0 39.5 6
F13 0 0 39.5 6
Precompression evaluation Drug-excipients compatibility
FT-IR Spectroscopy (Fourier Transform Infrared Spectroscopy)
The IR analysis of pure drug and physical mixture (drug- excepient) was conducted. Potassium Bromide disc method was utilised for IR analysis. The spectrum was taken by scanning the samples individually over a wave number
range of 4000- 400 cm–1 using Fourier transform infrared
spectrophotometer (FTIR)12. Evaluation of powder blend
The prepared powder blend was subjected to various evaluation parameters like angle of repose, bulk density
(BD), tapped density (TD), Carr’s index and Hausner’s ratio.
Preparation of sustained Bupropion Hydrochloride tablets
Different tablet batches were prepared by utilising same technique as stated in pre optimization. The range of polymers selected for preparation of sustained Bupropion Hydrochloride tablet shown in table 3 and 4.
Confirmation of crystalline structure of drug by X- Ray Diffractometery
To analyse the Crystallinity of drug in formulated tablets X ray diffraction study was done. A voltage of 40 kV and
current of 40 mA in the angular range of 10°<2θ<60°, was
used. After that, step scan mode (step width=0.02°, counting
time=1 s/step) was used13.
Physicochemical characterization of tablet General appearance and dimensions
Twenty tablets were randomly selected from the prepared batch, to check any discoloration or degradation of drug in
the tablets by visual method14.
Thickness of the tablets was measured using vernier caliper (Mitech Meterology Ltd., China). The values of thickness were used to adjust the initial stages of compression. The thickness of tablet was controlled within a limit of ±5%
variation of a standard value15.
Weight variation test and Hardness
The 20 tablets from the batch were selected randomly and were weighed individually. After that average weight was
calculated16.Not more than two of the individual weights
deviate from the average weight by more than the percentage given in the pharmacopoeia and none deviates
by more than twice that percentage17.
Mitutoyo digital hardness tester, Japan was utilised for
determination of hardness18.
In- vitro swelling study
Single tablet was weighed (W1) and placed in a glass beaker
containing 200 ml of 0.1N HCl, and maintained in a water
bath at 37.0 ± 0.5 0C. At regular time intervals, the tablet was
removed from beaker and the excess surface liquid was carefully removed with bloating paper. The swollen tablet
was weighed again (W2)19. The swelling index (SI) was
calculated using eq.1:
S.No. Ingredients Percentage (%w/w)
1 Bupropion Hydrochloride 24.7
2 HPMC K4M 24-55
3 CP 934P 3-9
4 Magnesium stearate 2
5 Talc 1
SI= [(W2-W1)/W1]*100 (eq. 1) In- vitro Drug Release study
In-vitro drug release study for the prepared sustained
release tablets was conducted in 0.1 N HCl for period of 12 hours using a six-station USP type II (paddle) apparatus
(Electrolab Pvt. Ltd.) at 37oC± 0.5 0C and 50 rpm speed.
Sampling was done after every one hour interval; samples of 10 ml were withdrawn from dissolution medium and replaced with fresh medium to maintain the volume
constant. Absorbance was measured in UV
spectrophotometer (Shimadzu, Japan) at λ max 298nm
(Pharmacopoeia).
Drug release statistics
Based on phenomenological analysis, the type of release was
predicted, i.e., whether Fickian, non Fickian or zero-order21.
Drug release data were subjected to various release models, including Higuchi model (eq. 2), which indicates whether the
drug release mechanism deviates from Fick’s laws and
shows anomalous behaviour.
Q=KH t1/2 (eq. 2)
where, Q is the amount of drug release at time t, and KH is the Higuchi rate constant.
The dissolution data was also fitted to Koresmeyer model which is used to describe drug release behaviour from
polymer systems (eqs. 3 and 4) 22.
Mt/Mα = k.tn (eq. 3)
Log (Mt/Mα) = log K+ n Log t (eq. 4) where ‘Mt’ isthe amount of the drug release at time ‘t’, ‘Mα’ is the amount of drug release after infinite time and ‘K’ is a release rate constant incorporating structural and geometric characteristic of the tablet and ‘n’ is the diffusion exponent
indications for release mechanism.
Optimisation Data Analysis
A statistical design was utilized in order to derive the relationship between the response variables and the independent variables. Design- Expert Version 10 (trial version) was utilised for unveiling the relationship between dependent and independent variable. In order to get the optimized formulation, concentration of both the polymers i.e. HPMC K4M (A) & CP 934P (B), were selected as
independent variables, while the dependent variables
hardness (Y1), Q12h (Y2) and T50 (Y3) were selected as
independent variables23.Each factor was set at low, medium
and high factor. The actual values and coded values are given
in table 4.24
Polynomial models including interaction and quadratic terms were generated for all the response variables using multiple linear regression analysis (MLRA) approach. The general form of the MLRA model is represented as the
following equation
y=β0+β1A+β2B+β3AB+β4B1+β5B2+β6AB2+β7B1B (eq. 5)
Where, β0 is the intercept representing the arithmetic average of all quantitative outcomes of 13 runs; β1 to β7 are the coefficients computed from the observed experimental response values of y; and A and B are the coded levels of the
independent variable(s). The terms AB and Bi (i=1 to 2)
represent the interaction and quadratic terms, respectively.
Validation of optimization analysis
Four formulations were selected as the confirmatory check-points to validate by response surface methodology (RSM). The observed and predicted responses were critically compared. Linear correlation plots were constructed for the chosen four optimized formulations, and the percent bias (prediction error) was calculated with respect to the
observed responses25.
Results & discussion
Precompression evaluation Drug-excepient compatibility FT-IR Spectroscopy
The FTIR spectrum of Bupropion Hydrochloride and its physical mixture is shown in Figure 1 and Figure 2. The characteristic peaks of Bupropion Hydrochloride are clearly shown in both the spectrums. The most prominent peaks are
obtained at 1690cm-1 & 1691cm-1 of Bupropion
Hydrochloride and its physical mixture respectively, representing aromatic C=C bending, whereas due to asymmetric C-H bending, the peak for Bupropion
Hydrochloride was observed at 1459 cm-1 while the peak for
Bupropion Hydrochloride in physical mixture was observed
at 1457 cm-1. The C-OH stretching in the spectrum was
observed at peaks 1240 cm- & 1239 cm-1 respectively.
Figure 2: FTIR Spectrum of physical mixture
Confirmation of crystalline structure of drug by X- Ray Diffractometery
The X-RD spectrum as shown in Figure. 3 for pure drug (Bupropion Hydrochloride), reveals its crystalline nature,
which is evident from its sharp peaks. On the other hand, the spectrum of X-RD (Figure. 4) for physical mixture also shows the sharp peaks, which confirms its crystalline nature as well as also signifies that there is no interaction between drug and the excepients.
Figure 3: X-RD spectrum of pure drug (Bupropion Hydrochloride)
Figure 4: X-RD spectrum of physical mixture of Bupropion Hydrochloride Evaluation of powder blend
The results of various evaluation parameters of powder blend is summarised in table 5. The results of powder blend
Table 5: Results for evaluation of powder blend
Batch no. repose (°) Angle of Bulk density Tapped density
(g/ml) Carr’s index
Hausner’s ratio
F1 24± 1.08 0.435±1.10 0.535±1.02 0.539±1.02 1.146±1.09
F2 23± 1.05 0.434±1.12 0.533±1.08 0.535±1.07 1.220±1.12
F3 24± 1.18 0.437±1.03 0.601±1.09 0.600±1.12 1.159±0.09
F4 26± 1.05 0.500±1.09 0.549±1.01 0.602±1.10 1.162±1.03
F5 27±1.08 0.439±1.18 0.537±0.09 0.533±1.05 1.219±1.05
F6 24± 1.11 0.501±1.12 0.602±1.12 0.534±0.06 1.166±1.01
F7 25± 1.12 0.505±1.11 0.545±1.06 0.536±1.18 1.189±1.13
F8 27± 1.07 0.438±1.05 0.567±1.09 0.544±1.12 1.765±1.10
F9 26± 1.02 0.502±1.12 0.602±1.14 0.549±1.10 1.231±1.05
F10 25± 1.06 0.505±1.04 0.600±1.13 0.555±1.05 1.229±1.01
F11 23± 1.01 0.434±1.02 0.545±1.10 0.551±1.12 1.230±1.13
F12 27± 1.21 0.438±1.06 0.534±1.05 0.546±1.08 1.149±0.09
F13 26± 1.10 0.503±1.14 0.539±1.08 0.601±1.09 1.156±1.10
Physicochemical characterization of tablet
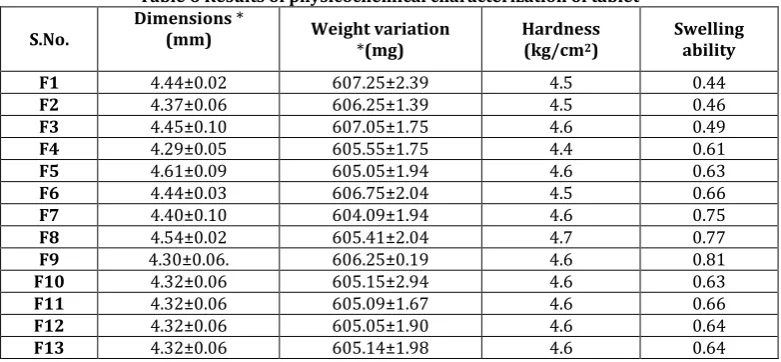
The prepared tablets were observed visually. Defects such as capping, chipping and lamination were absent. The thickness for the tablets of all the formulation (F1- F13) was found in the range of 4.29±0.05- 4.61±0.09.
Weight variation test and Hardness
The percentage deviation from average tablet weight for all the tablet was found to be within the specified limits, all
formulations complied with the test for weight variation (table 6) according to the pharmacopoeial specifications. The hardness was found in the range of 4.4 to 4.7 kg-cm (table 6).
In- vitro swelling ability
The in- vitro swelling ability of the tablet was found in the range of 0.44-0.81%. The result (Figure5) signified that, the increase in the concentration of HPMC K4M was more impactful for the swelling of tablet, since HPMC K4M exhibits the property of swelling.
Figure 5: Swelling index of formulated batches
Table 6 Results of physicochemical characterization of tablet
S.No. Dimensions (mm) * Weight variation *(mg) Hardness (kg/cm2) Swelling ability
F1 4.44±0.02 607.25±2.39 4.5 0.44
F2 4.37±0.06 606.25±1.39 4.5 0.46
F3 4.45±0.10 607.05±1.75 4.6 0.49
F4 4.29±0.05 605.55±1.75 4.4 0.61
F5 4.61±0.09 605.05±1.94 4.6 0.63
F6 4.44±0.03 606.75±2.04 4.5 0.66
F7 4.40±0.10 604.09±1.94 4.6 0.75
F8 4.54±0.02 605.41±2.04 4.7 0.77
F9 4.30±0.06. 606.25±0.19 4.6 0.81
F10 4.32±0.06 605.15±2.94 4.6 0.63
F11 4.32±0.06 605.09±1.67 4.6 0.66
F12 4.32±0.06 605.05±1.90 4.6 0.64
F13 4.32±0.06 605.14±1.98 4.6 0.64
*All the values are expressed as mean± SD, n=3
0 0.2 0.4 0.6 0.8 1
F1 F2 F3 F4 F5 F6 F7 F8 F9 F10 F11 F12 F13
Swe
lli
ng
inde
x
Batch no. Swelling index
In- vitro Drug Release
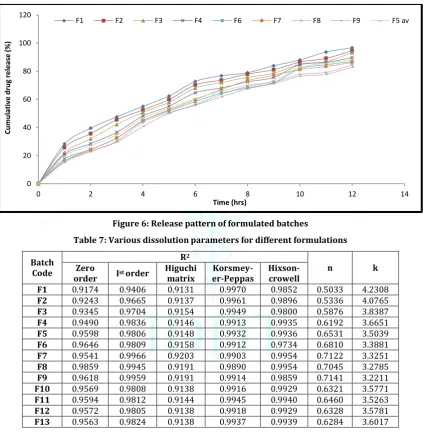
The drug release profile of all the batches was studied for 12 h. The drug release of all formulated batches lies between 88.2- 96.7%, within 12 h (Figure 6). Summary of the dissolution parameters, i.e. “n” and “k” is indicated in Table
7. The in- vitro release profile of all the formulations could
be best expressed by ‘Korsmeyer Peppas equation’.
As observed from the data of dissolution parameters so obtained, the correlation coefficient of all the formulations
were high (R2 value ranged from 0.9131- 0.9959), which was
enough to evaluate the drug dissolution behaviour. The release exponent (n) was found to be the function of polymer used. The n value (ranged from 0.5033- 0.7141) indicated non- fickian diffusion mechanism, which is also
called as anomalous transport. This indicated that
dissolution was the dominant mechanism of drug release. An increase in the amount of both polymers will decrease the drug release; hence lower value of drug release constant (k), at higher polymer content was obtained.
Figure 6: Release pattern of formulated batches
Table 7: Various dissolution parameters for different formulations
Batch Code
R2
n k
Zero
order Ist order Higuchi matrix er-Peppas Korsmey- Hixson-crowell
F1 0.9174 0.9406 0.9131 0.9970 0.9852 0.5033 4.2308
F2 0.9243 0.9665 0.9137 0.9961 0.9896 0.5336 4.0765
F3 0.9345 0.9704 0.9154 0.9949 0.9800 0.5876 3.8387
F4 0.9490 0.9836 0.9146 0.9913 0.9935 0.6192 3.6651
F5 0.9598 0.9806 0.9148 0.9932 0.9936 0.6531 3.5039
F6 0.9646 0.9809 0.9158 0.9912 0.9734 0.6810 3.3881
F7 0.9541 0.9966 0.9203 0.9903 0.9954 0.7122 3.3251
F8 0.9859 0.9945 0.9191 0.9890 0.9954 0.7045 3.2785
F9 0.9618 0.9959 0.9191 0.9914 0.9859 0.7141 3.2211
F10 0.9569 0.9808 0.9138 0.9916 0.9929 0.6321 3.5771
F11 0.9594 0.9812 0.9144 0.9945 0.9940 0.6460 3.5263
F12 0.9572 0.9805 0.9138 0.9918 0.9929 0.6328 3.5781
F13 0.9563 0.9824 0.9138 0.9937 0.9939 0.6284 3.6017
Data analysis
The ANOVA equations obtained from the software was helpful in estimating the relationship between independent variable and dependent variable. Following equations were obtained, for the following three dependent variables:
Hardness = 4.58 A+ 0.050 B+ 0.025 AB+ 0.084 A2- 0.066 B2+
0.025 A2B- 0.025 AB2 (eq.10)
Q12h = 88.06- 3.84 A- 1.40 B- 0.15AB+ 0.61 A2+ 0.61 B2- 0.62A2B-
1.55 AB2 (eq.11)
T5o= 4.14 +1.25 A+ 0.24 B+ 0.18 AB+ 0.67 A2+ 0.67 B2- 0.16 A2B-
0.16 AB2 (eq.12)
From the results of multiple regression analysis, it was
found that the dependent variables i.e. hardness, Q12h and
T50 are strongly dependent on independent variables.
Various response surfaces plotted for the studied response showed the effect of polymers in combination on the properties and they were known to facilitate an understanding of contribution of the variables and their interactions.
0 20 40 60 80 100 120
0 2 4 6 8 10 12 14
C
um
ul
at
iv
e
dr
ug
r
e
le
ase
(%
)
Time (hrs)
Design-Expert® Software Factor Coding: Actual Q12h (%)
Design points above predicted value
Design points below predicted value 96.7
81.91 X1 = A: HPMC K4M X2 = B: CP 934 P
-1 -0.5 0 0.5 1 -1 -0.5 0 0.5 1 80 85 90 95 100 Q 12 h (%)
A: HPMC K4M (mg) B: CP 934 P (mg)
Design-Expert® Software Factor Coding: Actual Q12h (%)
Design Points
96.7 81.91
X1 = A: HPMC K4M X2 = B: CP 934 P
-1 -0.5 0 0.5 1
-1 -0.5 0 0.5 1 Q12h (%)
A: HPMC K4M (mg)
B : C P 9 34 P ( m g) 85 90 95 5
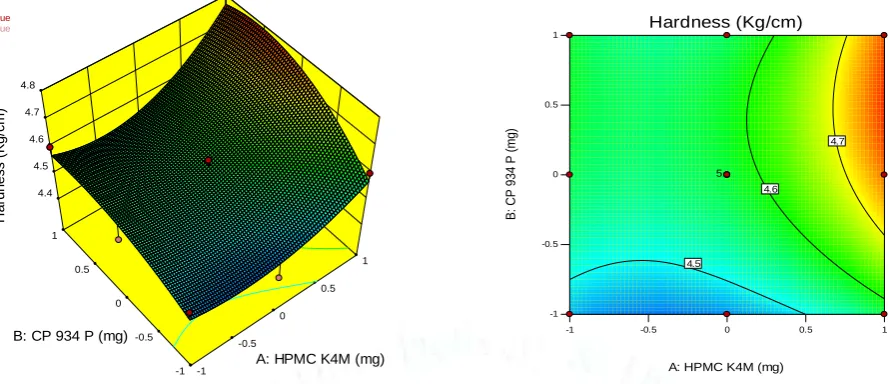
Figure 7 depicts hardness of tablets were increased as the concentration of HPMC K4M and CP 934P were increased. Figure 7 is showing the effect of CP 934P & HPMC K4M on hardness. As per the figure, with increase in both the polymers, the strength of the tablet increases.
At minimum concentration of CP 934P, when HPMC K4M increases from lower to higher concentration, the increase in
hardness is almost linear and the same is applicable for increase in the concentration of CP 934P from lower to higher concentration, at minimum concentration of HPMC K4M, while at higher concentration of HPMC K4M, when CP 934P increases from lower to higher concentration, the initial increase in the hardness is sudden, while it is almost static at the end. All these statements are much more, strength fully depicted in the contour plot of the same.
Figure.7. Response Surface plot & contour plot showing effect of HPMC K4M and CP 934P on Hardness
Figure 8 represented the response surface plot and the contour plot showing the effect of both the polymers on Q12h. Both the
plots are signifying that on increase in concentration of both the polymers, Q12h is decreasing. At minimum concentration of CP
934P, when HPMC K4M in increasing from lower to higher concentration, the decrement in Q12 is more prominent as compared
to CP 934P and the same can be observed through contour plot. This may be due to the fact; HPMC K4M forms a strong viscous gel on contact with aqueous media with the gel controlling delivery of the highly water- soluble drug.
Figure. 8: Response Surface plot & contour plot showing effect of HPMC K4M and CP 934P on Drug Release
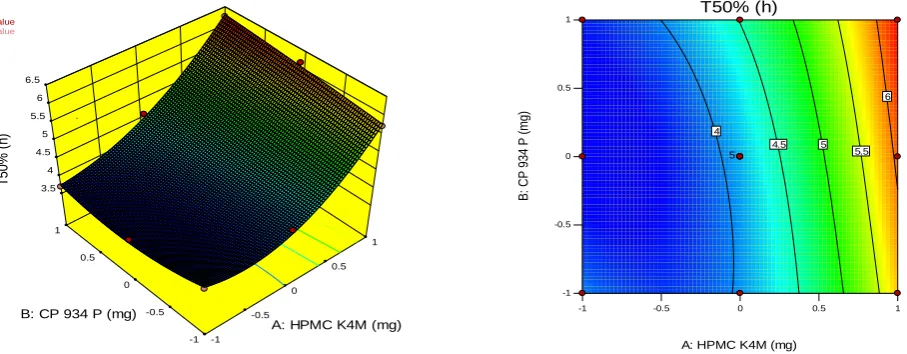
The response surface plot and contour plot as shown in Figure 9, signifies that on increasing the concentration of both the
polymers the T50 is also increasing. The value of T50 is increasing with the increment in concentration of HPMC K4M, while with
CP 934P the value of T50 tends to increase slowly but linearly. The same was observed through contour plot, which is showing
almost inclining linear contour lines. Design-Expert® Software
Factor Coding: Actual Hardness (Kg/cm)
Design points above predicted value
Design points below predicted value 4.8
4.4
X1 = A: HPMC K4M X2 = B: CP 934 P
-1 -0.5 0 0.5 1 -1 -0.5 0 0.5 1 4.4 4.5 4.6 4.7 4.8 H a rd n e s s ( K g /c m )
A: HPMC K4M (mg) B: CP 934 P (mg)
Design-Expert® Software Factor Coding: Actual Hardness (Kg/cm)
Design Points
4.8 4.4
X1 = A: HPMC K4M X2 = B: CP 934 P
-1 -0.5 0 0.5 1 -1
-0.5 0 0.5
1 Hardness (Kg/cm)
A: HPMC K4M (mg)
Design-Expert® Software Factor Coding: Actual T50% (h)
Design Points
6.25 3.66
X1 = A: HPMC K4M X2 = B: CP 934 P
-1 -0.5 0 0.5 1 -1 -0.5 0 0.5 1 T50% (h)
A: HPMC K4M (mg)
B : C P 9 3 4 P ( m g ) 4 4.5 5 5.5 6 5
Figure. 9: Response Surface plot & contour plot showing effect of HPMC K4M and CP 934P on time for 50% release
3.5 Overlay plot
The overlay plot obtained by the software shows the area of optimization, which is signified by yellow colour, as shown in Figure10. The overlay plot so obtained was useful for the purpose of validation.
Figure 10: Overlay plot showing optimized region Validation:
The validation checkpoints chosen from the overlay plot.. The checkpoints taken from the overlay plot showed the predicted values of both the independent and dependent variables. The percentage error was then calculated between the predicted values and observed values, to check the
accuracy of software. The various validation batches along with their predicted values, observed values and percentage error is summarised in table 8. The regression coefficient between the anticipated and experimental values for
hardness, Q12 & T50 is represented in Figure11A, Figure11B
& Figure11C, respectively.
Table 8: Checkpoint Composition, their results and percentage error
Validation
batch A HPMC K4M mg B CP 934P mg Response variables Predicted values Experimental values
Percentage error
(%)
VCT1 34.85 7.2
Hardness (kg/cm2) 4.55 4.8 -0.054
Q12 (%) 89.11 87.42 0.021
T50 (h.) 3.89 3.83 0.015
VCT2
(optimized) 31.75 8.7
Hardness (kg/cm2) 4.54 4.65 -0.024
Q12 (%) 90.32 89.99 0.003
T50 (h.) 3.91 3.87 0.010
VCT3 37.95 6.21
Hardness (kg/cm2) 4.56 5.00 -0.096
Q12 (%) 88.44 86.23 0.024
T50 (h.) 4.01 3.98 0.007
VCT4 36.4 31.75 Hardness (kg/cm
2) 4.51 4 0.11
Q12 (%) 90.22 89.55 0.007
T50 (h.) 3.81 3.75 0.015
Design-Expert® Software Factor Coding: Actual T50% (h)
Design points above predicted value
Design points below predicted value 6.25
3.66 X1 = A: HPMC K4M X2 = B: CP 934 P
-1 -0.5 0 0.5 1 -1 -0.5 0 0.5 1 3.5 4 4.5 5 5.5 6 6.5 T 5 0 % (h )
A: HPMC K4M (mg) B: CP 934 P (mg)
Design-Expert® Software Factor Coding: Actual Overlay Plot
Hardness Q12h T50%
Design Points
X1 = A: HPMC K4M X2 = B: CP 934 P
-1 -0.5 0 0.5 1
-1 -0.5 0 0.5
1 Overlay Plot
A: HPMC K4M (mg)
Conclusion
The relationship between various process variables chosen for the study was successfully determined with the help of response surface plots and overlay plot obtained by the software. The concentration of the polymers (HPMC K4M & CP 934P) were chosen as independent variables, while
hardness, Q12 & T50, were selected as dependent variables. It
was observed that on increasing the concentration of both
the polymers the hardness & T50 was increasing while Q12
was decreasing, this is because of specific drug release controlling power of HPMC K4M & CP 934P. Thus, the study was helpful in obtaining the optimized formulation of
Bupropion.
References
1. USFDA: https://www.accessdata.fda.gov/drugsatfda_docs/label/. Retrieved June 18, 2018.
2. Jiloha, R.C. Pharmacotherapy of smoking cessation. Indian J of Psychiatr. 2014; 56:87-95.
3. Fava, M., Rush, A.J., Thase, M.E., Clayton, A., Stahl, M.S., Pradko, J.F. and Johnston, J.A. 15 Years of clinical experience with bupropion Hydrochloride: From bupropion to bupropion SR to bupropion XL. Prim Care Companion J Clin Psychiatry. 2005; 7:106–113. 4. Grover, S., Dutt, A. and Avasthi A. An overview of Indian research
in depression. Indian J of Psychiatr. 2010; 5(Suppl 1):178-188. 5. Fouladi, F. and Mortazavi, S.A. Preparation and in-vitro evaluation
of gastroretentive bupropion hydrochloride tablets. TJPR. 2012; 11:351-359.
Garg, R.K. and Singhavi. I. 2015. Optimization techniques: an overview for formulation development. AJPR. 5, 217-221. 6. Chodankar, R.S. and Dev A. Optimisaton techniques: a futuristic
approach for formulating and processing of pharmaceuticals. IJPBR. 2016; 4:32-40.
7. Dalavi, V.V. and Patil, J.S. Optimization techniques: An introductory overview.JPR. 2009; 2:144-147.
8. Kumar, S. and Baldi, A. Formulation by Design Approach for Fizzy Granules Using Statistical Optimization Methodologies. AJP. 2015; 9:S59-S67.
9. Debnath, S., Aishwarya M.N.L. and Babu M.N. Formulation by Design: An approach to designing better Drug Delivery Systems. Pharma Times. 2018; 50:9-14.
10. Jadhav, B.K., Khandelwal, K.R., Ketkar, A.R., Pisal, S.S. Formulation and evaluation of mucoadhesive tablet containing eugenol for the treatment of periodontal diseases. Drug Developmental and Industrial Pharmacy. 2004; 30:195-203. 11. Singh, L., Nanda, A., Sharma, S. and Sharma V. Design
optimization and evaluation of gastric floating matrix tablet of glipizide. TJPR. 2013; 12:869-876.
12. Togaru, V., Venisetty R. K., Bakshi V. and Jadi, R. K. Formulation Development and In Vitro Evaluation of Propranolol Hydrochloride Extended Release Matrix Tablets. Emergent Life Sciences Research; 2017; 3:38-47.
13. Quinten, T., Andrews, G. P., Beer, T. De., Saerens, L., Bouquet, W., Jones, D.S., Hornsby P., Remon J.P. and Vervaet C.. Preparation and Evaluation of Sustained-Release Matrix Tablets Based on Metoprolol and an Acrylic Carrier Using Injection Moulding. AAPS. 2012; 13:1197-1211.
14. Rathore, B.H.S., Sharma, A., Garg, A. and Sisodiya, D.S..Formulation and evaluation of enteric coated tablet of Ilaprazole. International Current Pharmaceutical Journal. 2013; 2:126-130.
15. Al-Hashemi, H.M.B. and Al-Amoudi, O.S.B. A review on the angle of repose of granular materials. Powder Technology. 2018; 330:397-417.
16. Kumar, K.V. and Ajaykumar, B. Formulation and evaluation of rapid disintegration tablets of moxifloxacin HCl. Scholars Research Library. 2013; 5238-250.
17. Sharma, H.S.C., Kumar, Y.K. and Reddy, K.R. Effect of drug release on Albendazole chewable tablets by using different formulation techniques. IJPSR. 2014; 5:4543-4547.
18. Ganesh, G.N.K., Sureshkumar, R., Jawahar, N., Senthil, V., Nagasamy, V.D. and Shanmukha, S.M. Preparation and evaluation of sustained release matrix tablet of diclofenac sodium using natural polymer. JPSR. 2, 360-368.
19. Ige, P.P., Mahajan, D.R.and Sonawane, R.O. Development of muoadhesive sustained release matrix tablets of methimazole for oral delivery. IJPER. 2015; 49:259-267.
20. http://www.pharmacopeia.cn/v29240/usp29nf24s0_m10524.html. Retrieved on June 20, 2018.
21. Higuchi, T. Mechanism of sustained-action medication: theoretical analysis of rate of release of solid drugs dispersed in solid matrices. Journal of Pharmaceutical Sciences. 1963; 52:1145-1149.
22. Korsemeyer, R.W., Gurny, R., Doelker, E., Buri, P. and Peppas, N. Mechanism of solute release from porous hydrophillic polymers. IJP. 1983; 15:25-35
23. Stetsko, G. Statistical Experimental Design and its Application to Pharmaceutical Development Problems. Drug Development and Industrial Pharmacy. 1986; 12:1109-1123.
24. Madgulkar, A.R., Bhalekar, M.R., Kolhe, V.J. and Kenjale, Y.D. Formulation and optimization of sustained release tablets of venlafaxine resinates using response surface methodology. IJPS. 2009; 7:387-394. .