Volume 18 Number 1 pp. 86–91 C The Author(s) 2014 doi:10.1017/thg.2014.79
VEGAS2: Software for More Flexible
Gene-Based Testing
Aniket Mishra and Stuart Macgregor
Statistical Genetics Group, QIMR Berghofer Medical Research Institute, Brisbane, Queensland, Australia
Gene-based tests such asversatile gene-based association study (VEGAS) are commonly used following per-single nucleotide polymorphism (SNP) GWAS (genome-wide association studies) analysis. Two limita-tions of VEGAS were that the HapMap2 reference set was used to model the correlation between SNPs and only autosomal genes were considered. HapMap2 has now been superseded by the 1,000 Genomes reference set, and whereas early GWASs frequently ignored the X chromosome, it is now commonly in-cluded. Here we have developed VEGAS2, an extension that uses 1,000 Genomes data to model SNP correlations across the autosomes and chromosome X. VEGAS2 allows greater flexibility when defining gene boundaries. VEGAS2 offers both a user-friendly, web-based front end and a command line Linux ver-sion. The online version of VEGAS2 can be accessed through https://vegas2.qimrberghofer.edu.au/. The command line version can be downloaded from https://vegas2.qimrberghofer.edu.au/zVEGAS2offline.tgz. The command line version is developed in Perl, R and shell scripting languages; source code is available for further development.
Keywords:GWAS, 1, 000 genomes, X chromosome, VEGAS2, VEGAS
Gene-based tests are now well established as complemen-tary methods to traditional per-single nucleotide polymor-phism (SNP) GWAS. These methods test for enrichment of multiple SNPs associated with the disease/trait that individ-ually have too modest an effect on the phenotype to reach genome-wide significance using a per-SNP test. A key is-sue is accounting for linkage disequilibrium (LD) and gene size (number of SNPs). A permutation approach where phenotype labels are shuffled while keeping the markers fixed is considered the gold standard for correcting for LD and SNP number. However, this approach is compu-tationally intensive and can only be applied to GWASs on unrelated individuals. We have previously shown a simula-tion approach generates similar results to the permutasimula-tion
(Liu et al.,2010). The VEGAS approach is computationally
tractable and can be applied to any GWAS experimental design (unrelated individuals, family designs, DNA pooling designs). Novel loci not identified using per SNP tests have
been found using VEGAS (Cheng et al.,2013). Imputation
to the HapMap reference panel has been superseded by the availability of the 1,000 Genomes phase 1 data (around 38
million variants; Genomes Project et al.,2012). By updating
VEGAS to use 1,000 Genomes phase 1 data, we are able to improve our LD estimates given the increase in the size of
the reference panel (e.g.,Nfor European ancestry subset is
379 compared to 90 in HapMAP phase 2), as well as up-dating genome build from hg18 to hg19 (Genomes Project
et al.,2012; International HapMap et al.,2007).
We have enabled analysis of the X chromosome data, re-flecting the increased analysis of this region in GWAS (Chu
et al.,2013; Conde et al.,2013; Kou et al.,2013; Tukiainen
et al., 2014). Finally, we have made significant
improve-ments in the analysis and data handling routines, increasing program efficiency.
Here we describe the VEGAS2 package, which is an ex-tension of VEGAS with the ability to leverage the informa-tion provided by 1,000 Genomes phase 1 data, and allows gene-based analysis of the X chromosome.
Materials and Methods
Gene Data
We downloaded the hg19 annotated list of all RefSeq genes from UCSC table browser on May 22, 2014. After extracting
RECEIVED21 October 2014;ACCEPTED29 October 2014. First
pub-lished online 18 December 2014.
ADDRESS FOR CORRESPONDENCE: Stuart Macgregor, Statistical
Ge-netics Group, QIMR Berghofer Medical Research Institute, Her-ston 4006 QLD, Australia.
genes located on the 22 autosomes and on the X chro-mosome, there were total 25,196 unique gene symbols; 5,356 symbols have variable transcription start and end po-sitions. Symbols with overlapping transcription locations were merged to form a single full-length version of a gene. Cases where transcription sites were not contiguous with each other were given a new gene symbol with nomen-clature ‘Originalgenesymbol˙1/2/3’. In total, 26,056 unique VEGAS2 gene definitions (24,769 autosomal and 1,287 X-chromosomal genes) are used.
1,000 Genomes Data
VEGAS2 repository files were constructed using 1,000 Genomes phase 1 release version 3 was downloaded on May 22, 2014 from the NCBI website (ftp://ftp-trace.ncbi.nih.gov/1000genomes/ftp/release/20110521/).
Using the vcftools package (Danecek et al., 2011), 1,000
Genomes phase 1 data were divided into the following ancestry groups: European (379 individuals), Asian (286), African (246), and Latin American (181). These four geno-type datasets were filtered separately to extract SNPs with minor allele frequency above 1% and a Hardy–Weinberg
p-value above 1×10⁻⁶. We also filtered out X chromosome
SNPs that showed significant difference (p-value<1.8×
10−7) in allele frequency between males and females (there
were 146 such SNPs in the European reference set, with similar numbers in other sets).
Gene-Based Association Testing Approach
In VEGAS2, the user has five options regarding gene bound-aries for SNP selection:
1. SNPs within the gene, relative to the 5’ and 3’ UTR
(0kbloc).
2. SNPs within 10 kb of the 5’ and 3’ UTR (10kbloc).
3. SNPs within 20 kb of the 5’ and 3’ UTR (20kbloc).
4. SNPs within 50 kb of the 5’ and 3’ UTR (50kbloc).
5. SNPs within gene plus any SNPs outside of the gene
with r2>0.8 with SNPs within the gene (0kbldbin).
This allows the flexibility to include different sets of SNPs when testing for a gene-based association. Different gene boundary options have different advantages and lim-itations. For example, gene boundary option 1, ‘0kbloc’, focuses solely on intronic and exonic SNPs and ignores regulatory SNPs, reducing power if regulatory variation is important (and not tagged by SNPs residing in the gene). However, using a larger gene boundary may lessen the speci-ficity of the result for a given gene because SNPs associated with neighboring genes may influence test statistics of a gene under consideration. SNPs a long distance from the gene are typically ignored in gene-based tests (Christoforou
et al.,2012) and so we have implemented gene boundary
option 5, ‘0kbldbin’, to allow distant SNPs in high LD with genic SNPs to be included.
For each gene definition, thenSNPs’p-values are first
converted to upper tail2statistics with one degree of
free-dom (df) and then summed to calculate a gene-based test
statistic that would have a2distribution withn dfunder
the null hypothesis, if SNPs are in linkage equilibrium. Since
linkage equilibrium for thenSNPs rarely occurs, their
cor-relation is modeled using, an×nmatrix of LD (r) values
estimated from a 1,000 Genomes reference population. The user can choose a broad reference population group such as European (1000G EURO), Asian (1000G ASN), African (1000G AFR) and American (1000G AMR) using the option ‘-pop 1000GEURO/ASN/AFR/AMR’, or the user can choose a more specific population group with more similar LD to their population of interest. For example, the ‘-subpop GBR’ parameter can be used if the user wishes to calculate LD con-sidering only individuals from the 1,000 Genomes reference population ‘British in England and Scotland (GBR)’.
Signif-icance is computed by comparing the summed2statistics
for each gene to simulated replicates from a multivariate
normal distribution with mean=0 and variance=.
Em-piricalp-values are computed for each gene using formula,
p=r+1/m+1, where r is the number of instances where
the simulated statistics exceed the observed data and m is the number of simulations.
We implemented a flexible gene-based approach where the user can specify what percentage of top SNPs are in-cluded in the gene-based test (the default is to consider all SNPs). This allows the user to include SNPs with more significant association with phenotype and remove SNPs that may dilute the summarized test statistics. An option is also provided to specify that only the single best SNP be included, which would be more relevant in genetic architec-tures where only few SNPs regulate the gene of interest and the top SNP is in high LD with those SNPs. A range of op-tions is offered, since the best approach will vary depending on the true (unknown) genetic architectures.
We used the MD Anderson Cancer Centre melanoma cutaneous malignant melanoma case-control (MDACC-CMM-CC, 1,965 cases, 1,038 controls, typed on Illumina
Omni-1M arrays) data (Amos et al.,2011) to compare
VE-GAS2 gene-based results obtained using only genotyped SNPs with results using 1,000 Genomes phase 1 imputed SNPs. We imputed chromosome 21 of the
MDACC-CMM-CC data using IMPUTE2 software (Marchini et al.,2007)
and performed association testing using SNPTEST
(Well-come Trust Case Control,2007). VEGAS2 was applied to
the summary results with and without imputation, using the default settings.
X Chromosome Gene-Based Test Approach
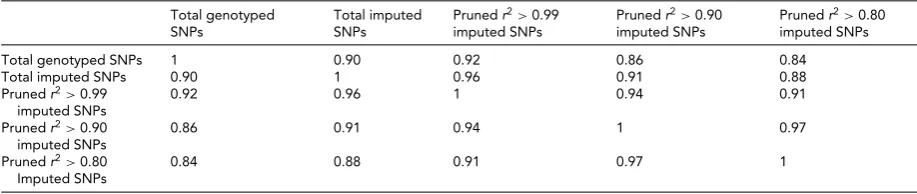
TABLE 1
Correlation Matrix of Different Sets of SNPs Genotyped, Imputed, Imputed SNPs Pruned at r2>0.99, Imputed SNPs Pruned atr2
>0.90 and Imputed SNPs Pruned atr2>0.80
Total genotyped SNPs
Total imputed SNPs
Prunedr2>0.99
imputed SNPs
Prunedr2>0.90
imputed SNPs
Prunedr2>0.80
imputed SNPs
Total genotyped SNPs 1 0.90 0.92 0.86 0.84
Total imputed SNPs 0.90 1 0.96 0.91 0.88
Prunedr2>0.99
imputed SNPs
0.92 0.96 1 0.94 0.91
Prunedr2>0.90
imputed SNPs
0.86 0.91 0.94 1 0.97
Prunedr2>0.80
Imputed SNPs
0.84 0.88 0.91 0.97 1
1. males have a single copy; females have two copies.
2. one copy in females is fully or partly inactivated.
These special characteristics of the X chromosome re-quire a separate statistical testing model for association analysis compared with autosomes. Different association
testing models have been proposed (Clayton,2008; Zheng
et al.,2007). Two popular models to analyze X
chromo-some GWAS data are: (1) sex-stratified (sexes analyzed
sep-arately) (Davidson et al.,2014; Zhang et al.,2014); and (2)
sex-combined, with X-inactivation modeled (males geno-types are coded as female homozygote, that is, males as 0,
2 and females as 0,1, 2) (Tukiainen et al.,2014). In a
sce-nario where the proportion of males within cases is very different to the proportion of males within controls, the sex-stratified approach will have reduced power (Clayton,
2008). Hence, we suggest that users use the X-inactivation
option as the default –– for example, inputp-values from
the default X-inactivation output from SNPTEST
(Well-come Trust Case Control,2007). In addition to making the
assumptions of X-inactivation and equal effect size in males and females (the per-SNP assumptions), VEGAS2 (by de-fault) assumes LD and allele frequencies are equal across sexes. To minimize sampling error in this situation, LD and frequencies are estimated from both sexes combined. Users who do not wish to make these assumptions are catered for through the VEGAS2 ‘-sex’ option that treats each sex
sepa-rately — in this case, the user should input separatep-values
for the sexes separately. The sex-specific VEGAS2 outputs can be meta-analyzed using Fisher’s method to combine the
p-values.
We used MDACC-CMM-CC data (Amos et al.,2011)
to test the X chromosome approaches in practice. First, per-SNP association was tested using SNPTEST (Marchini
et al.,2007) using the X-inactivation model, with thep
-values used as input to VEGAS2 (assuming similar LD and allele frequencies in males and females). Second, a logistic regression model in each sex separately was run, with the
resultantp-values input into VEGAS2 with the ‘-sex’ flag
specified, with the VEGAS2 output then meta-analyzed us-ing Fisher’s method.
Results and Discussion
Gene-Based Results on Different Sets of SNPs
We compared the gene-based results obtained using differ-ent sets of SNPs from MDACC-CMM-CC association data
in chromosome 21 (Table 1). While using imputation fills in
potentially informative untyped SNPs, on average the gene-based results do not differ dramatically when imputed and directly genotyped VEGAS results are compared (correla-tion 0.90 for total genotyped compared to total imputed). One advantage with imputation is that the number of genes
with a gene-based result increased by25% for this data
set (270 chromosome 21 genes covered with imputation compared with 215 genes with only genotyped SNPs).
Table 1also shows the results with different levels of LD pruning of the imputed SNPs. Here, pruning means a SNP
is removed if it hasr2above the specified threshold with
an-other SNP within a window of 50 SNPs as implemented in
plink (Purcell et al.,2007). A comparison between the
gene-based result withr2>0.99 and with no pruning is shown to
investigate the phenomenon described by Moskvina et al.
(2012). They showed that although the information
con-tent of the input data for ‘r2>0.99’ and for ‘no pruning’ is
similar (since the only difference is that one representative SNP is chosen each time two or more SNPs are in essentially complete linkage disequilibrium), the resultant correlation
can be less than one.Table 1shows that while we do see a
correlation less than one, the high correlation (0.96) means that in practice the results will not differ substantially be-fore and after pruning at this level. Examining pruning at
lowerr2thresholds, the unpruned and pruned results begin
to diverge, as would be expected because the information content in the pruned set begins to decrease.
Since the information content of the input data for ‘r2
> 0.99’ and for ‘no pruning’ is similar, there is unlikely
to be an inherent advantage in considering the full set of imputed SNPs in practical applications of VEGAS2. Hence,
in web-based version we implement ‘r2>0.99’ pruning as
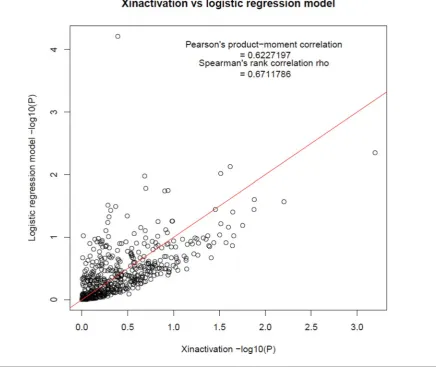
FIGURE 1
(Colour online) P-P plot of gene basedp-value using X-inactivation model versus sex-stratified model.
set to remove all uploaded SNPs inr2>0.99 with another
uploaded SNP. The software then computes the gene-based
p-values on the pruned set of SNPs. Similarly, in offline
version user can provide pruned summary file as input to implement this method.
X Chromosome Gene-Based Test Using Sex-Stratified Versus X Inactivation GWAS Model
To test how the sex-stratified and X-inactivation models for GWAS on X chromosome behave in gene-based association test setting, we performed separate GWAS on MDACC-CMM-CC data using X-inactivation model on X chromo-some using SNPTEST and run VEGAS2 using option ‘-sex BothMnF’ (default option). We performed association tests separately for each gender, and then ran VEGAS2 with op-tion ‘-sex Males’ and ‘-sex Females’ respectively. We
com-bined the gene-basedp-values obtained from single gender
analyses and compared it with the gene-basedp-values
ob-tained using X-inactivation analysis. As expected, the results from these two approaches are broadly similar, but given the
different assumptions, not identical (Figure 1).
The genePGRMC1was more significant using the
strati-fied sex model compared to the X-inactivation model
(gene-basedp-values, sex-stratified=6.2×10−05, X-inactivation
= 0.41). We further explored the results for the SNPs
within this gene. This gene contains two genotyped SNPs, rs2499043 and rs11546862. Both these SNPs are signifi-cantly associated in the feonly tests, but not in
males-only or X-inactivation tests (Table 1). Although the results
in Figure 1 show reasonable concordance, the result for PGRMC1illustrates that the assumptions made in the X chromosome analysis can in some cases greatly affect the
results obtained using VEGAS2 (Table 2). In general, we
recommend the sex-combined X-inactivation model, al-though users should be aware that in some cases the results may differ compared with the sex-specific model.
Web-Server Implementation
TABLE 2 Association Effect, S tandard E rror a nd p -value o f G enotyped S NPs in PGRMC1 Gene Obtained through X -Inactivation a nd Stratified Sex Models X-inactivation model M ales only Females only SNPs in PGRMC1 gene Effect allele MAF B eta SD p-value M AF Beta SD p-value M AF Beta SD p -value rs2499043 T 0 .46 0 .06 0 .04 0 .18 0 .47 − 0.04 0.05 0.4 0 .46 0 .37 0 .09 2 .98 × 10 − 05 rs11546862 T 0 .05 − 0.01 0.1 0 .94 0 .06 0 .16 0 .12 0 .15 0 .05 − 0.47 0.18 0.01
Offline Version for Linux System and Availability of Data Repository
VEGAS2 was developed in Perl programming language to work in Linux command line environment. The VEGAS2 data repository and scripts can be downloaded from https://vegas2.qimrberghofer.edu.au/zVEGAS2offline.tgz. The manual for installation and usage can be
down-loaded from https://vegas2.qimrberghofer.edu.au/
VEGAS2usermanual.pdf.
Conclusion
In conclusion, we report on the VEGAS2 approach that uses 1,000 Genomes data to perform gene-based tests on GWAS summary results. VEGAS2 also extends the original VEGAS approach to perform gene-based testing on the X chromosome. Its offline implementation can be used in a Linux environment. The online implementation is publi-cally accessible through the QIMR Berghofer webpage.
Acknowledgments
We thank Matthew Law for useful comments on the manuscript. We thank Xiaping Lin and Jonathan Davies from QIMR Berghofer IT for assistance with the VE-GAS2 web application. AM is supported by an ANZ Trustees PhD scholarship. SM is supported by tralian National Health and Research Council and Aus-tralian Research Council fellowships. MD Anderson Can-cer Centre (MDACC) melanoma case-control sample: The MDACC study is part of the Gene Environment Association
Studies initiative (GENEVA,http://www.genevastudy.org)
funded by the trans-NIH Genes, Environment, and Health Initiative (GEI). Genotyping of MD Anderson samples was performed through the University of Texas MD Anderson Cancer Center (UTMDACC) and the Cen-ter for Inherited Disease Research (CIDR), supported in part by NIH grants R01CA100264, P30CA016672, and R01CA133996, the UTMDACC NIH SPORE in Melanoma 2P50CA093459, as well as by the Marit Peterson Fund for Melanoma Research. CIDR is supported by contract HHSN268200782096C. The datasets used for the analy-ses described in this manuscript were obtained from
db-GaP at http://www.ncbi.nlm.nih.gov/gap through dbGaP
accession number phs000187.v1.p1. Principal investigators: Christopher Amos, PhD, University of Texas MD Anderson Cancer Center, Houston, TX, USA; Qingyi Wei, MD, Uni-versity of Texas MD Anderson Cancer Center, Houston, TX, USA; Jeffrey E. Lee, MD, University of Texas MD Anderson Cancer Center, Houston, TX, USA.
References
Cheng, C. Y., Schache, M., Ikram, M. K., Young, T. L., Guggenheim, J. A., Vitart, V., . . . Baird, P. N. (2013). Nine loci for ocular axial length identified through genome-wide association studies, including shared loci with refractive error.American Journal of Human Genetics,93, 264–277. Christoforou, A., Dondrup, M., Mattingsdal, M., Mattheisen,
M., Giddaluru, S., Nothen, M. M., . . . Le Hellard, S. (2012). Linkage-disequilibrium-based binning affects the interpre-tation of GWASs.American Journal of Human Genetics,90, 727–733.
Chu, X., Shen, M., Xie, F., Miao, X. J., Shou, W. H., Liu, L., . . . Huang, W. (2013). An X chromosome-wide association analysis identifies variants in GPR174 as a risk factor for Graves’ disease.Journal of Medical Genetics,50, 479–485. Clayton, D. (2008). Testing for association on the X
chromo-some.Biostatistics,9, 593–600.
Conde, L., Foo, J. N., Riby, J., Liu, J., Darabi, H., Hjalgrim, H., . . . Skibola, C. F. (2013). X chromosome-wide associa-tion study of follicular lymphoma.British Journal of Haema-tology,162, 858–862.
Danecek, P., Auton, A., Abecasis, G., Albers, C. A., Banks, E., DePristo, M. A., . . . Genomes Project Analysis, G. (2011). The variant call format and VCFtools.Bioinformatics,27, 2156–2158.
Davidson, A. E., Cheong, S. S., Hysi, P. G., Venturini, C., Plagnol, V., Ruddle, J. B., . . . Hardcastle, A. J. (2014). Asso-ciation of CHRDL1 mutations and variants with X-linked megalocornea, Neuhauser syndrome and central corneal thickness.PLoS One,9, e104,163.
Genomes Project, C., Abecasis, G. R., Auton, A., Brooks, L. D., DePristo, M. A., Durbin, R. M., . . . McVean, G. A. (2012). An integrated map of genetic variation from 1,092 human genomes.Nature,491, 56–65.
International HapMap, C., Frazer, K. A., Ballinger, D. G., Cox, D. R., Hinds, D. A., Stuve, L. L., . . . Stewart, J. (2007). A second generation human haplotype map of over 3.1 mil-lion SNPs.Nature,449(7,164), 851–861.
Kou, I., Takahashi, Y., Johnson, T. A., Takahashi, A., Guo, L., Dai, J., . . . Ikegawa, S. (2013). Genetic variants in GPR126
are associated with adolescent idiopathic scoliosis.Nature Genetics,45, 676–679.
Liu, J. Z., McRae, A. F., Nyholt, D. R., Medland, S. E., Wray, N. R., Brown, K. M., . . . Macgregor, S. (2010). A versa-tile gene-based test for genome-wide association studies.
American Journal of Human Genetics,87, 139–145. Marchini, J., Howie, B., Myers, S., McVean, G., & Donnelly, P.
(2007). A new multipoint method for genome-wide associ-ation studies by imputassoci-ation of genotypes.Nature Genetics,
39, 906–913.
Moskvina, V., Schmidt, K. M., Vedernikov, A., Owen, M. J., Craddock, N., Holmans, P., & O’Donovan, M. C. (2012). Permutation-based approaches do not adequately allow for linkage disequilibrium in gene-wide multi-locus associa-tion analysis.European Journal of Human Genetics,20, 890– 896.
Purcell, S., Neale, B., Todd-Brown, K., Thomas, L., Ferreira, M. A., Bender, D., . . . Sham, P. C. (2007). PLINK: A tool set for whole-genome association and population-based linkage analyses.American Journal of Human Genetics,81, 559–575.
Tukiainen, T., Pirinen, M., Sarin, A. P., Ladenvall, C., Kettunen, J., Lehtimaki, T., . . . Ripatti, S. (2014). Chromosome X-wide association study identifies loci for fasting insulin and height and evidence for incomplete dosage compensation.
PLoS Genetics,10, e1004127.
Wellcome Trust Case Control, C. (2007). Genome-wide asso-ciation study of 14,000 cases of seven common diseases and 3,000 shared controls.Nature,447, 661–678.
Zhang, Y., Zhang, J., Yang, J., Wang, Y., Zhang, L., Zuo, X., . . . Yang, W. (2014). Meta-analysis of GWAS on two Chi-nese populations followed by replication identifies novel genetic variants on the X chromosome associated with sys-temic lupus erythematosus.Human Molecular Genetics. Re-trieved from http://hmg.oxfordjournals.org/citmgr?gca= hmg%3Bddu429v3.