International Journal of Health Sciences and Research
www.ijhsr.org ISSN: 2249-9571
Original Research Article
A Study to Seek the Association Between Eating
Habits and BMI of Adolescents with A View to
Develop and Evaluate Structured Teaching
Programme in Terms of Knowledge on Prevention
and Control of Obesity in A Selected School of
Haryana
Suman Dhaniya
Nursing Officer, Kalawati Saran Children Hospital, New Delhi. India.
ABSTRACT
Introduction: Most children develop their eating habits and activity pattern during childhood. The transition in nutrition and lifestyle by the popularity of fast foods, soft drinks, sedentary life styles, lack of exercise, increased television watching and computer usage are the common trends which are the causes of overweight and Obesity.
Materials and Methods: The research approach adopted for the study was survey for Phase I and evaluative pre-experimental for Phase II. The research design used as descriptive survey for Phase I and pre- experimental one group pre test post test design for Phase II. The setting of the study was Shambhu Dayal Modern School, Sonepat, Haryana, India.
The data were collected with the help of 1). Background data consisted of 15 items seeking information on demographic characteristics of the adolescents. 2). Eating habits questionnaire to assess the eating habits. 3) Standardized weighing machine and height scale. 4). CDC- Body mass index - for - age growth charts (2-20 yrs. boys and girls) to determine body mass index of adolescents. 4) Structured knowledge questionnaire to assess adolescent's knowledge on obesity.
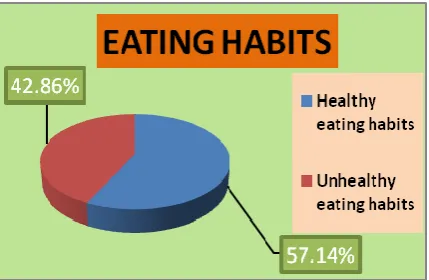
Results: The major findings of Phase I of the study revealed that majority i.e. 75.56% of the adolescents had normal weight, 12.38% of adolescents were overweight, 6.35% adolescents were obese whereas only 5.71% were underweight. 57. 14% of the adolescents had healthy eating habits whereas 42.86% of the adolescents had unhealthy eating habits. The computed Chi-Square value (84.1), to see the association between the body mass index and eating habits among adolescents is found to be statistically significant. The structured teaching programme was effective in enhancing the knowledge of the adolescents as evident from 't' value which was calculated from pre test and post test scores.
Keywords: Eating habits, Adolescent, Overweight, Obesity, Structured teaching programme
INTRODUCTION
Adolescence is one of the most challenging periods in human development. Physical and psychological changes are taking place and many important issues arise that influence the nutritional wellbeing of adolescents. Eating behaviour that is
learned early in life is maintained in adulthood. Nutritional inadequacies influence not only adolescent's health but also the risk for major chronic diseases in adulthood. [1]
Obesity in A Selected School of Haryana
is essential. During adolescence, the need for most nutrients including energy, protein, vitamins and minerals increases. As appetite is also likely to increase, it is important that food choices are made carefully. It can be tempting at this time to increase the intake of snack foods and fast foods that are high in fat, sugar and salt. [2]
World health organization has described obesity as one of the today’s most neglected public health problem.
Obesity Facts & Figures: World Health Organisation: Key facts
Worldwide obesity has nearly doubled since 1980.
In 2014, more than 1.9 billion adults, 18 and older, were overweight. Of these over 600 million were obese.
Most of the world's population lives in countries where overweight and obesity kills more people than underweight.
42 million children under the age of 5 were overweight or obese in 2013.
Overall, about 13% of the world’s adult populations (11% of men and 15% of women) were obese in 2014.
In 2014, 39% of adults aged 18 years and over (38% of men and 40% of women) were overweight.
The worldwide prevalence of obesity more than doubled between 1980 and 2014. Obesity is preventable.
As per WHO in 2013, 42 million children under the age of 5 were overweight or obese. Once considered a high-income country problem, overweight and obesity are now on the rise in low- and middle-income countries, particularly in urban settings. In developing countries with emerging economies (classified by the World Bank as lower- and middle-income countries) the rate of increase of childhood overweight and obesity has been more than 30% higher than that of developed countries. Children in low- and middle-income countries are more vulnerable to inadequate pre-natal, infant and young child nutrition. At the same time, they are exposed to high-fat, high-sugar, high-salt,
energy-dense, micronutrient-poor foods, which tend to be lower in cost but also lower in nutrient quality. These dietary patterns in conjunction with lower levels of physical activity, result in sharp increases in childhood obesity while under nutrition issues remain unsolved. [3]
Institute for Health Metrics and Evaluation published an article which states that nearly 30% of the world’s population – are either obese or overweight, according to a new, first-of-its kind analysis of trend data from 188 countries. The rise in global obesity rates over the last three decades has been substantial and widespread, presenting a major public health epidemic in both the developed and the developing world. Published in The Lancet on May 29, the study, “Global, regional, and national prevalence of overweight and obesity in children and adults during 1980–2013: a systematic analysis for the Global Burden of Disease Study 2013,” was conducted by an international consortium of researchers led by the Institute for Health Metrics and Evaluation (IHME) at the University of Washington. Over the course of the study, rates of overweight and obesity among adults have increased for both men (from 29% to 37%) and women (from 30% to 38%). In developed countries, men had higher rates of overweight and obesity, while women in developing countries exhibited higher rates. Also in developed countries, the peak of obesity rates is moving to younger ages.
Key findings:
More than 50% of the world’s 671 million obese live in 10 countries (ranked beginning with the countries with the most obese people): US, China, India, Russia, Brazil, Mexico, Egypt, Germany, Pakistan, and Indonesia.
The US, United Kingdom, and Australia are among the high-income countries with large gains in obesity among men and women.
Obesity in A Selected School of Haryana
countries with the largest increases in obesity globally.
In six countries, all in the Middle East and Oceania – Kuwait, Kiribati, the Federated States of Micronesia, Libya, Qatar, and Samoa – the prevalence of obesity for women exceeds 50%. In Tonga, both men and women have obesity prevalence over 50%.
In sub-Saharan Africa, the highest obesity rates (42%) are seen among South African women. [4]
The Ministry of Health and Family Welfare released the results from the first phase of the National Family Health Survey (NFHS-4), 2015-16. Even though India battles malnutrition, the country has developed another nutritional problem-obesity. In past 10 years, the number of obese people has doubled in the country. As per the survey conducted by Ministry of Health and Family Welfare (MOHFW), people having Body Mass Index (BMI) more than 25 kilogram per meter square have been considered as obese. Most of the states have experienced sharp rise in the number of obese people. Andhra Pradesh, Andaman and Nicobar, Puducherry and Sikkim have more than 30 per cent of their populations falling under the “obese” category. More than 10 per cent population in Bihar, Madhya Pradesh, Meghalaya, Tripura and West Bengal is obese; doubling since the last National Family Health Survey of 2005-06. [5]
The study was undertaken to meet the learning needs of the adolescents. Adolescents can take care of their health when they are provided with good knowledge and right direction. Now- a- days obesity has reached epidemic proportions in the 21st century, with rising rates in both the developed and developing world. So there is an urgent need to find effective prevention and treatment strategies that induce change in the individual, family and at community levels.
OBJECTIVES OF THE STUDY
1. To assess the eating habits of adolescents.
2. To assess the body mass index (BMI) of adolescents.
3. To seek the association between eating habits and BMI of adolescents.
4. To find the relationship between eating habits and selected demographic variables such as:
Age
Sex
Type of family
Educational status of father Educational status of mother Occupation of father
Occupation of mother Family income Dietary habits
Amount of pocket money Exercise
5. To develop and evaluate the effectiveness of structured teaching programme in terms of knowledge on prevention and control of obesity.
MEHODOLOGY
THE PRESENT STUDY WAS CONDUCTED IN TWO PHASES.
Phase-I: To assess the eating habits and to assess the Body mass index among the adolescents (12-17 years).
Phase-II: To determine the effectiveness of structured teaching programme in enhancing knowledge of adolescents on prevention and control of obesity.
RESEARCH APPROACH
To assess eating habits and BMI of the adolescents among adolescents, a survey approach was conducted in Phase I of the present study.
The experimental approach was considered to be appropriate in the phase - II of the study, to evaluate the effectiveness of structured teaching programme on prevention and control of obesity.
RESEARCH DESIGN
The research design for present study was: Phase 1- Descriptive survey.
Phase 2- One group pretest post test design (Pre-experimental)
Obesity in A Selected School of Haryana
"OK" as experimental variables and "X" as the structured teaching programme for
adolescents.
Figure 1: Symbolic representation of Phase II : Pre- experimental design Group Pre test (I day) Treatment(I day) Post test (VIII day) Experimental group OK1 X OK2
OK1 - Knowledge test to assess the knowledge of adolescents on prevention and control of obesity before the administration of structured teaching programme.
X - Administration of Structured teaching programme on prevention and control of obesity.
OK2 - Knowledge test to assess the knowledge of adolescents on prevention and control of obesity after the administration of structured teaching programme.
VARIABLES UNDER STUDY
In the present study, the independent variables were:
Phase 1- The background factors
Phase 2- Structured teaching programme The dependent variables of this study were : Phase 1 - Body mass index
Phase 2- Eating habits and knowledge regarding prevention and control of obesity. In present study extraneous variable were mass media, Peer group influence and sedentary life style.
SETTING OF THE STUDY
The present study was undertaken in:
Phase 1 - Shambhu Dayal Modern School, Sonepat, Haryana
Phase 1I - Shambhu Dayal Modern School, Sonepat, Haryana
POPULATION
In the present study, population comprises of adolescents (Boys and girls) of 12-17 years of age from selected school.
SAMPLE AND SAMPLING TECHNIQUE
SAMPLE
In the present study, sample comprises of adolescents (Boys and girls) of 12-17 years of age from selected school.
Phase1
Sample size- 315 adolescents Phase2
Sample size - 55 adolescents (Those who were overweight and obese. )
Criteria for selecting the sample:
Adolescents of 12-17 years of age. Adolescents who were willing to
participate.
Adolescents who were present during pretest and posttest
Sample mortality- 4 samples were not present during pretest and posttest. So there was a sample mortality of 4 samples.
SAMPLING TECHNIQUE
In the present study, selection of the sample was done by total enumeration sampling for phase I and purposive sampling for phase II.
DATA COLLECTION TOOLS AND TECHNIQUES
The following tools were used to collect the data:
A structured tool to collect background data.
A structured eating habits questionnaire to assess eating habits.
Standardized weighing machine and height scale.
Standardized growth charts to classify Body mass index (2-20 yrs. boys and girls)
Source- CDC- (Centre for disease control and prevention)
Structured knowledge questionnaire to assess the knowledge on prevention and control of obesity
DEVELOPMENT OF TOOLS
After extensive review of literature, structured questionnaire was prepared for the tool.
For the development of tool following steps were taken:
An extensive review of literature.
Consultation with experts in nursing, pediatrics, nutrition, community medicine.
Obesity in A Selected School of Haryana TRY OUT OF THE TOOL
Pre testing of the eating habits questionnaire was done to ensure the clarity of items, their feasibility and practicability.
For the phase I, after obtaining formal administrative permission, the tools were administered to 20 adolescents. The average time taken for completion of eating habits questionnaire by each individual was around 50-60 minutes.
STATISTICAL ANALYSIS RESULTS
PHASE-I
The data of phase-I of the study is organized under the following sections:-
SECTION-I:
FINDINGS RELATED TO FREQUENCY AND PERCENTAGE DISTRIBUTION OF SAMPLE CHARACTERISTICS OF THE SUBJECTS.
In the study 54.29% were females and 45.71% were males.
Majority of the adolescents (40%) were in the age group of 14-15 years.
Majority (64.13%) belonged to nuclear family and 35.87% stayed in joint families.
33.97% of fathers were graduates , 30.16% were having senior secondary education, 17.14% were having high school education , 11.43% were postgraduates and 0.63% were illiterate.
Maximum i.e. 34.29% of mothers had senior secondary education followed by 23.17% graduates and 3.49% illiterate.
30.48% of fathers were on government job followed by 29.21% and 25.21% were on private service and business man respectively. Most of the mothers (85.08%) were housewives. 2.22% of the fathers were not alive.
20.63% were having income more than Rs. 50001 and 21.59% had income range of Rs.10001-20000 and only 14.28% had income less than Rs.10000.
Most of the adolescents i.e. 80% were vegetarian and 6.67% were non vegetarian.
Most of the adolescents (62.54%) were not getting any pocket money. 14.92% were getting above Rs.300.
Majority of the adolescents (66.67%) got information on harmful effects of poor eating habits from all sources i.e. parents, teachers, peers and media.
28.89% of adolescents were not doing any exercise, 39.05% were doing up to 30 minutes and 8.89% were doing exercise more than 60 minutes.
Majority i.e. 50.48% were not taking weight and 37.14% were taking monthly weight, 2.54% were taking daily weight.
5.71% of the adolescents showed medical problems which includes thallassemia, backache, headache, stomachache, skin problems, dental problems, low calcium, kidney stone, typhoid.
Figure- 2 Pie diagram showing % distribution of adolescents in terms of sex
Obesity in A Selected School of Haryana
Figure-4 Doughnut diagram showing % distribution of adolescents in terms of type of family
Figure- 5 Bar diagram showing % distribution of adolescent's fathers education
Figure- 6 Conical diagram showing % distribution of adolescent's mother's education.
Figure- 7 Cylindrical diagram showing % distribution of adolescent's fathers occupation
Figure-8 Cylindrical diagram showing % distribution of adolescent's mothers occupation
Obesity in A Selected School of Haryana
Figure- 10 Pie diagram showing % distribution in terms of adolescent's dietary habits
Figure- 11 Conical diagram showing % distribution in terms of adolescent's monthly pocket money
Figure- 12 Bar diagram showing % distribution of adolescent's in terms of source of information on harmful effects of poor eating habits.
Figure- 13 Doughnut diagram showing % distribution of adolescents in terms of daily exercise
Figure- 14 Bar diagram showing % distribution of adolescents in terms of taking weight
Figure-15 Cylindrical diagram showing % distribution of adolescents in terms of medical problems
SECTION II:
FINDINGS RELATED TO FREQUENCY AND PERCENTAGE DISTRIBUTION OF PATTERN OF BODY MASS INDEX AMONG ADOLESCENTS
Obesity in A Selected School of Haryana
TABLE-1 FREQUENCY AND PERCENTAGE DISTRIBUTION IN TERMS OF PATTERN OF BODY MASS INDEX AMONG ADOLESCENTS N= 315
BODY MASS INDEX BODY MASS INDEX (Boys) BODY MASS INDEX (Girls) BODY MASS INDEX (Total) Frequency Percentage Frequency Percentage Frequency Percentage Under
weight
12 8.33% 6 3.51% 18 5.71%
Normal weight 109 75.69% 129 75.44% 238 75.56%
Overweight 13 9.03% 26 15.20% 39 12.38%
Obese 10 6.94% 10 5.85% 20 6.35%
The data represented in table-1 shows majority (75.56%) of the adolescents had normal weight, and only 5.71% were underweight, followed by 6.35% adolescents were obese whereas 12.38% of adolescents were overweight.
SECTION III:
This section describes the frequency and percentage of eating habits among adolescents. Frequency and percentage was computed to describe the pattern of eating habits. The pattern of eating habits was categorized into: Healthy eating habits and unhealthy eating habits.
Figure -16 Pie diagram showing % distribution of adolescents in terms of eating habits
SECTION-IV
FINDINGS RELATED TO ASSOCIATION BETWEEN EATING HABITS AND BODY MASS INDEX OF THE ADOLESCENTS
This section shows the association between the body mass index and eating habits. To find out the association between the body mass index and eating habits, the following research hypothesis was formulated:
H1- There is significant association between the body mass index and eating habits of the adolescents at 0.05 level of significance. The following null hypothesis was stated to test the research hypothesis
H01- There is no significant association between the body mass index and eating habits of the adolescents at 0.05 level of significance.
In order to find out the association between the body mass index and eating habits Chi-Square was computed. Findings presented in table-2.
TABLE-2CHI- SQUARE VALUE SHOWING THE ASSOCIATION BETWEEN BODY MASS INDEX AND EATING HABITS N=315
CATEGORIES UNDER WEIGHT
NORMAL WEIGHT OVER WEIGHT OBESE df Chi-Square Value
Healthy eating habits 5 170 5 0
3
84.1* Unhealthy eating habits 13 68 34 20
* Significant at 0.05 level, df=3, ᵪ2= 5.991
The data presented in table-2 depicts that, the computed Chi-Square value (84.1), to see the association between the body mass index and eating habits among adolescents is found to be statistically significant at 0.05 level of significance with degree of freedom 3. Hence the research hypothesis (H1) was accepted and null
Obesity in A Selected School of Haryana
SECTION V: FINDINGS RELATED TO ASSOCIATION BETWEEN EATING HABITS AND SELECTED VARIABLES.
This section deals with the association between eating habits and selected variables such as age, sex, education of parents, occupation of parents, type of family, family income, amount of pocket money, dietary habits, exercise .
To determine the significant association between eating habits and selected variables, Chi-Square was computed. Findings are presented in table-3
H2- There is significant association between eating habits and selected variables
(H2a) Age (H2b) sex
(H2c) Type of family (H2d) Education of father (H2e) Education of mother (H2f) Occupation of father
(H2g) Occupation of mother (H2h) Family income (H2i) Dietary habits
(H2j) Amount of pocket money (H2k) Exercise
at 0.05 level of significance.
The following null hypothesis was stated to test the research hypothesis H2
H02- There is no significant association between eating habits and selected variables (H02a) Age
(H02b) Sex
(H02c) Type of family (H02d) Education of father (H02e) Education of mother (H02f) Occupation of father (H02g) Occupation of mother (H02h) Family income (H02i) Dietary habits
(H02j) Amount of pocket money (H02k) Exercise
at 0.05 level of significance.
TABLE – 3 CHI- SQUARE VALUE SHOWING THE ASSOCIATION BETWEEN EATING HABITS AND SELECTED VARIABLES N=315
S. NO.
SELECTED VARABLES HEALTHY EATING HABITS
UNHEALTHY EATING HABITS
df TABLE VALUE
Calculated Chi-Square Value 1. AGE IN YEARS
4 9.488 3.59 NS
12-13 years 13 11
13-14 years 35 31
14-15 years 65 55
15-16 years 42 27
16-17 years 25 11
2. SEX
1 3.841 3.11 NS
Female 90 81
Male 90 54
3. TYPE OF FAMILY
1 3.841 0.184 NS
Joint 64 49
Nuclear 116 86
4. Educational Status of Father
6 12.592 9.41 NS
Illiterate 2 0
Primary 6 4
Middle 9 2
High School 37 17
Senior Secondary 51 44
Graduate 58 49
Post graduate 17 19
5. EDUCATIONAL STATUS OF MOTHER
6 12.592 4.44 NS
Illiterate 7 4
Primary 4 8
Middle 12 6
High School 43 27
Senior Secondary 61 47
Graduate 41 32
Post graduate 12 11
6. OCCUPATION OF FATHER
4 9.488 2.88 NS
Government service 54 42
Private service 51 41
Business man 42 39
Farmer 24 11
Obesity in A Selected School of Haryana
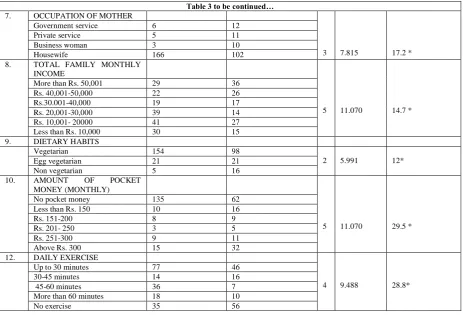
Table 3 to be continued… 7. OCCUPATION OF MOTHER
3 7.815 17.2 *
Government service 6 12
Private service 5 11
Business woman 3 10
Housewife 166 102
8. TOTAL FAMILY MONTHLY INCOME
5 11.070 14.7 *
More than Rs. 50,001 29 36
Rs. 40,001-50,000 22 26
Rs.30.001-40,000 19 17
Rs. 20,001-30,000 39 14
Rs. 10,001- 20000 41 27
Less than Rs. 10,000 30 15
9. DIETARY HABITS
Vegetarian 154 98
2 5.991 12*
Egg vegetarian 21 21
Non vegetarian 5 16
10. AMOUNT OF POCKET MONEY (MONTHLY)
5 11.070 29.5 *
No pocket money 135 62
Less than Rs. 150 10 16
Rs. 151-200 8 9
Rs. 201- 250 3 5
Rs. 251-300 9 11
Above Rs. 300 15 32
12. DAILY EXERCISE
4 9.488 28.8*
Up to 30 minutes 77 46
30-45 minutes 14 16
45-60 minutes 36 7
More than 60 minutes 18 10
No exercise 35 56
The data given in the table 3 shows that, the computed Chi-square value between eating habits and selected variables such as H2g (Chi-square value =17.2 ), H2h (Chi-square value =14.7 ), H2i (Chi-square value =12 ), H2j (Chi-square value =29.5 ), H2k (Chi-square value =28.8) among adolescents were found to be statistically significant at 0.05 level of significance.
The computed Chi-square value between eating habits and selected variables such as H2a (Chi-square value=3.59), H2b (Chi-square value=3.11), H2c (Chi-square value=0.184), H2d (Chi-square value=9.41), H2e square value=4.44), H2f (Chi-square value=2.88) were not found to be statistically significant at 0.05 level of significance.
Therefore the research hypothesis H2 was partially accepted and partially rejected.
PHASE-II OF THE STUDY
ASSESSMENT OF THE
EFFECTIVENESS OF STRUCTURED TEACHING PROGRAMME
SECTION - I
This section describes the description of sample characteristics in terms of in terms of age, sex, education of parents, occupation of parents, type of family, amount of pocket money, family income, dietary habits, Source of information on harmful effects of poor eating habits, exercise, weight taking, medical problem present of the sample subjects for Phase -II of the study. This sample comprised of the overweight and obese subjects from sample subjects of Phase- I of the study.
Data in table 4 (a) shows that in phase II of the study 63.64% were females and 36.36% were males.
Majority of the adolescents (52.73%) were in the age group of 14-15 years.
Majority (65.45%) belonged to nuclear family and 34.55% stayed in joint families. 41.82 % of fathers were having senior secondary education, 32.73% of fathers were graduates and 14.54% were postgraduates.
Obesity in A Selected School of Haryana
graduates and 20% had high school education.
32.73% of fathers were on government job followed by 30.91% and 30.91% were on private service and business man
respectively. Most of the mothers (78.18%) were housewives.
29.09 % were income more than Rs. 50001 and 20% had income range of Rs.10001-20000 and only 9.10% have income less than Rs.10000.
TABLE -4 (a) Frequency and percentage distribution of adolescents (12-17 years) by their demographic characteristics: (sex, age, education of parents, occupation of parents, type of family & family income). N=55
S. NO. SAMPLE CHARACTERISTICS FREQUENCY PERCENTAGE 1. SEX
1.1 1.2 Female Male 35 20 63.64% 36.36% 2 AGE IN YEARS
1.1 2.2 2.3 2.4 2.5 12-13 years 13-14 years 14-15 years 15-16 years 16-17 years 1 8 29 12 5 1.82% 14.54% 52.73% 21.82% 9.09% 3. TYPE OF FAMILY
3.1 3.2 Joint Nuclear 19 36 34.55% 65.45% 4. EDUCATIONAL STATUS OF FATHER
4.1 4.2 4.3 4.4 4.5 4.6 4.7 Illiterate Primary Middle High School Senior Secondary Graduate Post graduate 0 1 1 4 23 18 8 0 1.82% 1.82% 7.27% 41.82% 32.73% 14.54% 5. EDUCATIONAL STATUS OF MOTHER
5.1 5.2 5.3 5.4 5.5 5.6 5.7 Illiterate Primary Middle High School Senior Secondary Graduate Post graduate 0 3 2 11 22 13 4 0 5.45% 3.64% 20% 40% 23.64% 7.27% 6. OCCUPATION OF FATHER
6.1 6.2 6.3 6.4 6.5 6.6 Government service Private service Business man Farmer
Labourer/ Daily wages worker Unemployed 18 17 17 3 0 0 32.73% 30.91% 30.91% 5.45% 0 0 7. OCCUPATION OF MOTHER
7.1 7.2 7.3 7.4 7.5 Government service Private service Business woman
Labourer/ Daily wages worker Housewife 2 3 7 0 43 3.64% 5.45% 12.73% 0 78.18% 8. TOTAL FAMILY MONTHLY INCOME
8.1 8.2 8.3 8.4 8.5 8.6
More than Rs. 50,001 Rs. 40,001-50,000 Rs.30.001-40,000 Rs. 20,001-30,000 Rs. 10,001- 20000 Less than Rs. 10,000
16 10 4 9 11 5 29.09% 18.18% 7.27% 16.36% 20% 9.10%
Data in table 4(b) shows that most of the adolescents i.e. 81.82% were vegetarian. Most of the adolescents (61.82 %) did not receive any pocket money. 20% received above Rs.300.
Majority of the adolescents (76.36%) have received information on harmful effects of
poor eating habits from all sources i.e. parents, teachers, peers and media.
34.55% of adolescents were not doing any exercise, 43.64 % were doing up to 30 minutes.
Obesity in A Selected School of Haryana
5.5% of the adolescents showed medical problems which include headache, skin
problems and low calcium.
TABLE -4 (b) Frequency and percentage distribution of adolescents(12-17 years) by their demographic characteristics: (Dietary habits, amount of pocket money, Source of information on harmful effects of poor eating habits, exercise ,weight taking & medical problem present.) N=55
S. NO. SAMPLE CHARACTERISTICS FREQUENCY PERCENTAGE
9. DIETARY HABITS 9.1 9.2 9.3 Vegetarian Egg vegetarian Non vegetarian 45 7 3 81.82% 12.73% 5.45% 10. AMOUNT OF POCKET MONEY (MONTHLY)
10.1 10.2 10.3 10.4 10.5 10.6
No pocket money Less than Rs. 150 Rs. 151-200 Rs. 201- 250 Rs. 251-300 Above Rs. 300
34 6 0 1 3 11 61.82% 10.91% 0 1.82% 5.45% 20% 11. SOURCE OF INFORMATION ON HARMFUL EFFECTS OF POOR EATING HABITS.
11.1 11.2 11.3 11.4 11.5 11.6 Parents Teachers Parents+ Teachers Peers Media All of the above
8 3 2 0 0 42 14.55% 5.45% 3.64% 0 0 76.36% 12. DAILY EXERCISE
12.1 12.2 12.3 12.4 12.5
Up to 30 minutes 30-45 minutes 45-60 minutes More than 60 minutes No exercise 24 6 3 3 19 43.64% 10.91% 5.45% 5.45% 34.55% 13. WEIGHT TAKING
13.1 13.2 13.3 13.4 Daily Weekly Monthly Not taking weight
0 7 15 33 0 12.73% 27.27% 60% 14. MEDICAL ILLNESS OR HEALTH RELATED PROBLEM
Total participants with medical problems 3 5.5%
14.1 14.2 14.3 Headache Skin allergy Low Calcium 1 1 1 0.02% 0.02% 0.02% SECTION- II
This section presents the finding related to mean, median and standard deviation of pre test and post test knowledge score of adolescents about prevention and control of obesity. This was obtained from the structured knowledge questionnaire administered to the adolescents during the data collection period. Pre test and post test knowledge scores are tabulated in the master data sheet.
TABLE -5: MEAN, MEDIAN AND STANDARD DEVIATION OF PRE TEST AND POST TEST KNOWLEDGE SCORE OF ADOLESCENTS N=55
Knowledge Test Mean Median SD Pre test 21.40 22 1.84 Post test 26.64 27 1.24
Maximum Score = 30
The data in the table-5 indicates that the mean post test knowledge score (26.64)
was higher than the mean pre test knowledge score (21.40). The median of post test knowledge score (27) was higher than the median of pre test knowledge score (22) indicating an increase in knowledge. The standard deviation of post test knowledge score (1.24) was lower than the standard deviation of pre test knowledge score (1.84) indicating that the group became more homogeneous in terms of their knowledge in post -test.
SECTION - III
Obesity in A Selected School of Haryana
were described and analyzed using descriptive and inferential statistics.
To find out the significance of mean difference between pretest and post test knowledge scores, the following research hypotheses was formulated:
H3 - The mean post test knowledge scores of adolescents after administration of structured teaching programme on prevention and control of obesity is significantly higher than the mean pretest knowledge scores as measured by a structured knowledge questionnaire at 0.05 level of significance.
The following null hypotheses was stated to test the research hypotheses H3
H03 - The mean post test knowledge scores of adolescents after administration of structured teaching programme on prevention and control of obesity is not significantly higher than the mean pretest knowledge scores as measured by a structured knowledge questionnaire at 0.05 level of significance.
In order to determine the significance of difference between means of pre test and post test knowledge scores, "t" value was computed for correlated groups. Mean, median and standard deviation of difference, standard error of mean difference of pre-test and post- test knowledge scores were calculated. These are presented in table -6
TABLE NO- 6 MEAN, MEAN DIFFERENCE, STANDARD DEVIATION OF DIFFERENCE, STANDARD ERROR OF MEAN DIFFERENCE FROM PRE TEST TO POST TEST KNOWLEDGE SCORES AND "t" VALUE ON PREVENTION AND CONTROL OF OBESITY OF ADOLESCENTS. N= 55
Knowledge Test
Mean Mean Difference
SDD SEMD t value
Pre test 21.40 5.24 0.6 0.32 16.48* Post test 26.64
*Significant at 0.05 level of significance at df (54) = 2.0049.
The data presented in table 6 shows that the mean post test knowledge score (26.64) was higher than the mean pre test knowledge score (21.40) with a mean difference of (5.24). The obtained mean difference was found to be statically significant as evident from 't' value 16.48
for degree of freedom 54 at 0.05 level of significance.
Therefore the obtained mean difference was a true difference and not by chance so the research hypothesis H3 was accepted. This shows that the structured teaching programme was effective in enhancing the knowledge of the adolescents.
DISCUSSION
This section presents the major findings of the study discussed with reference and in relation to similar studies conducted by other researchers. The study intended to seek the association between eating habits and body mass index of adolescents with a view to develop and evaluate the effectiveness of structured teaching programme in terms of knowledge on prevention and control of obesity.
Findings related to the BMI of the adolescents:
The findings of the present study indicated that12.38% of adolescents were overweight followed by 6.35% adolescents were obese whereas only 5.71% were underweight. These findings were similar with the findings of Gupta Rajesh et.al.(2013) who conducted a community based study to assess the prevalence of overweight and obesity and its socio demographic correlates among adolescents of an urban area of Delhi. Prevalence of overweight and obesity was 15.1% and 7.2% respectively. [6]
These findings were also consistent with the findings of study conducted by Prasanna Kamath B.T. et. al.(2012) to assess the prevalence of overweight and obesity among school going children and the factors responsible for the same. The prevalence of overweight was 10% and obesity was 5% among 761 adolescents studied. [7]
Findings related to association of eating habits and BMI of adolescents:
Obesity in A Selected School of Haryana
84.1 at 0.05 level of significance with degree of freedom 3.
Similar results were found in the study conducted by Kuźbicka K, Rachoń D.(2013). The study revealed that bad eating habits as the main cause of obesity among children. Today's lifestyle promotes the development of obesity. The lack of physical activity, sedentary lifestyle and energy-rich diet are the main causes of an excess body fat accumulation. The examples of such bad eating habits are: snacking highly processed and calorie-rich foods between meals eating in front of the TV screen, skipping breakfasts, drinking sugar-sweetened beverages, "eating out" frequently and "emotional eating". Bad eating behaviours are crucial factors for the development of obesity. [8]
The findings of the study are also supported by a cross-sectional descriptive study conducted by Tarek Tawfik Amin et. al. (2008). The study revealed that missing and or infrequent intake of breakfast at home, frequent consumption of fast foods, low servings per day of fruits, vegetables, milk and dairy products, with frequent consumption of sweets/candy and carbonated drinks were all predictors of obesity and overweight among the schoolchildren studied. [9]
Findings related to the association between eating habits and selected variables:
The present study also showed that the significant association was found between eating habits and the variables such as occupation of mother, family income, dietary habits, pocket money and exercise.
The findings were consistent with study conducted by M Shashidhar Kotian et. al. (2010), prevalence and determinants of overweight and obesity among adolescent school children of South Karnataka, India. The analysis revealed that the risk of overweight was two times higher among the adolescents of high SES, 21 times higher among those participating < two hour/week in any type of physical activity, 7.3 times higher among those who reported watching
television and playing games on the computer for ≥ four hours/day, and 5.6 times higher among those who ate chocolates daily in addition to a normal diet. [10]
Similar findings were also shown in a study conducted by E A Spencer, P N Appleby, G K Davey and T J Key. (2003). They done a Cross-sectional analysis of self-reported dietary, anthropometric and lifestyle data. They found Fish-eaters, vegetarians and especially vegans had lower BMI than meat-eaters. [11]
Another study conducted by Taha and Marawan ( 2015) showed that the most important predictors to overweight and obesity in the students were eating restaurant food at least twice weekly, TV watching more than 2 hours per day, mother employment and pocket money. [12]
Findings related to the effectiveness of structured teaching programme:
The findings of the study also showed that the mean post test knowledge score was higher than the mean pre test knowledge score. This shows that the structured teaching programme was effective in enhancing the knowledge of the adolescents.
The findings were similar with the findings of Trupti Rekha Swain (2015) to assess the prevalence of obesity and its relationship with selected factors with a view to develop and evaluate the effectiveness of awareness programme on prevention and control of obesity among adolescent children in terms of knowledge and attitude. The findings revealed that the awareness programme was effective in enhancing the knowledge and changing the attitude of adolescents regarding prevention and control of obesity as evident from significant 't' value which was calculated from pre test and post test scores. [13]
CONCLUSION
Obesity in A Selected School of Haryana
12.38% of adolescents were overweight, followed by 6.35% adolescents were obese. 57. 14% of the adolescents had healthy eating habits whereas 42.86% of the adolescents had unhealthy eating habits. There was significant association between the body mass index and eating habits of the adolescents. There was significant association between eating habits and the variables such as (i.e. occupation of mother, family income, dietary habits, amount of pocket money and exercise) with eating habits among the adolescents. There was a deficit in knowledge regarding prevention and control of obesity among adolescent. There was a significant difference in level of knowledge of adolescents after administration of structured teaching programme.
REFERENCES
1. Gulani K.K. (2005). Community Health Nursing (1st ed.). Delhi: Kumar Publishing House, 452-465.
2. https://daa.asn.au/smart-eating-for-you/smart-eating-fast-facts/teens/
3. http://www.who.int/mediacentre/factsheets/f s311/en/
4. Global Burden of Disease Study 2013. Global Burden of Disease Study 2013 (GBD 2013) Obesity Prevalence 1990-2013. Seattle, United States: Institute for Health Metrics and Evaluation (IHME), 2014. 5. National family health survey (NFHS-4)
2015-2016 report.
6. Gupta, N. et. al. (2010) .Childhood Obesity in Developing Countries: Epidemiology, Determinants, and Prevention. Endocrine Reviews. 33(1), 48-70
7. Kamath, B.T. et.al.(2012). Prevalence of overweight and obesity among adolescent
school going children (12-15years) in urban area, south India. Indian journal of current research review. 04(20), 99-105
8. Kuźbicka ,K., Rachon, D. (2013). Bad eating habits as the main cause of obesity among children. Pediatric Endocrinology Diabetes and Metabolism.19(3), 106-10. 9. Amin ,T T., Ibrahim, A. A. , Ali, A. (2008).
Overweight and Obesity and their
Association with Dietary Habits, and Socio demographic Characteristics Among Male Primary School Children in Al-Hassa, Kingdom of Saudi Arabia. Indian Journal of Community Medicine. 33 (3), 172-181. 10. Kotian, S. M., Kumar, G. S., Kotian, S. S.
(2010). Prevalence and determinants of overweight and obesity among adolescent school children of South Karnataka. India. Indian Journal of Community Medicine. 35(1), 176-178.
11. Spencer, E. A., Appleby, P. N., Davey, G. K., Key, T. J . (2003) Diet and body mass index in 38 000 EPIC-Oxford meat-eaters, fish-eaters, vegetarians and vegans. International Journal of Obesity. 27, 728– 734
12. Taha, A.A., Marawan, H.M. (2015) Socio-behavioral Determinants of Overweight and Obesity in Egyptian Primary School Children. Journal of Child and adolescent behaviour. 3: 236. doi:10.4172/2375-4494.1000236.
13. Swain, R. T. (2015). A study to assess the prevalence of obesity and its relationship with selected factors, with a view to develop and evaluate the effectiveness of an awareness programme on "Prevention and control of obesity" among adolescents children in terms of knowledge and attitude in a selected school of Odisha. Unpublished Master of Thesis, University of Delhi, 2015.
******