Stone, Ian and Peck, Frank (1996) The foreignowned manufacturing sector in UK
peripheral regions, 1978–1993: restructuring and comparative performance.
Regional Studies, 30 (1). pp. 5568.
Downloaded from: http://insight.cumbria.ac.uk/id/eprint/4583/
Usage of any items from the University of Cumbria’s institutional repository ‘Insight’ must conform to the following fair usage guidelines.
Any item and its associated metadata held in the University of Cumbria’s institutional repository Insight (unless stated otherwise on the metadata record) may be copied, displayed or performed, and stored in line with the JISC fair dealing guidelines (available here) for educational and notforprofit activities
provided that
• the authors, title and full bibliographic details of the item are cited clearly when any part of the work is referred to verbally or in the written form
• a hyperlink/URL to the original Insight record of that item is included in any citations of the work
• the content is not changed in any way
• all files required for usage of the item are kept together with the main item file.
You may not
• sell any part of an item
• refer to any part of an item without citation
• amend any item or contextualise it in a way that will impugn the creator’s reputation
• remove or alter the copyright statement on an item.
The full policy can be found here.
Regional Studies, Vol. 30.1, pp. 55-68
The Foreign-owned Manufacturing Sector in
U K
Peripheral Regons,
1978-1993:
Restructuring and Comparative Performance
I A N S T O N E *
and
F R A N K
P E C K *
*Division o f Economics and *Division of Geography and Environmental Management, University o f Northumbria, Newcastle upon Tyne, N E 1 8ST, U K
(Received December 1992, in revised form March 1995)
STONE I. and P E C K F. (1996) The foreign-owned manufacturing sector in U K peripheral regions, 1978-1993: restructuring and comparative performance, Reg. Studies 30, 55-68. This paper presents an analysis of foreign direct investment (FD I) trends since the late 1970s in the four main peripheral regions of the UK. Using unpublished database sources, it analyses the changing significance of the foreign-owned manufacturing sector in Northern Ireland, Scotland, Wales and the North of England and the sector’s performance in terms of number of plants and associated employment alongside that of the indigenous sector in each of the regions. It reveals distinct differences in performance between the regions. Through identifying the main components contributing to overall change, the study provides insights into this aspect of regional restructuring, specifically the importance
to employment change of new plants relative to that of closures, acquisitions and in situ expansions and contractions. It also shows that the regional differences in overall FDI performance is not merely the outcome of relative success in terms of attracting new plants, but reflects also superior performances in relation to other key components of change. Finally, it is shown that regional foreign-owned manufacturing sector performance does seem to be linked to the patterns of F D I change associated with the main countries/regions of investment origin.
Foreign direct investment U K peripheral regions Industrial restructuring Establishment databases Components of manufacturing change Performance by ownership
STONE I. et P E C K F. (1996) L’industrie 1 capital ttranger situte aux regions ptriphtriques du Royaume-Uni de 1978 i
1993: restructuration et performance comparative, Reg. Studies 30, 55-68. Cet article prtsente une analyse des tendances relatives 1 l’investissement direct ttranger effectut depuis la fin des anntes 70 aux quatre rtgions ptriphtriques principales du Royaume-Uni. A partir des donntes officieuses, on analyse l’tvolution de l’importance de l’industrie 1 capital ttranger en Irlande du Nord, en Ecosse, au pays de Galles et dans le Nord d’tingleterre, ainsi que la performance du secteur en termes du nombre d’ttablissements et de l’emploi associt par rapport 1 la performance du secteur autochtone dans chacune des rtgions.
I1 laisse voir des diffirences trhs nettes dans la performance interrtgionale. En identifiant les variables clt qui contribuent au changement global, l’ttude permet une comprthension de cet aspect de la restructuration rteonale, particulitrement l’importance de la variation de l’emploi des nouveaux ttablissements par rapport celle qui s’explique par les fermetures, par les acquisitions, et par les extensions et les contractions sur place. I1 laisse voir aussi que les tcarts rtgionaux de la performance globale concernant l’investissement direct ttranger rtsultent non seulement du succks relatif en termes du nombre des nouveaux ttablisse- ments attires, mais refltte aussi de meilleures performances relatives aux autres variables clt qui contribuent au change- ment. Pour conclure, on dtmontre que sur le plan regional la performance de l’industrie i capital ttranger semble Ctre lite
S T O N E I. und P E C K F. (1996) Der in auslindischem Besitz befindliche herstellende Sektor in Randgebieten des Vereinigten Konigreichs im Zeitraum 1978-1 993: Umstruk- turierung und verhdtnismaflige Leistung, Reg. Studies 30, 55-68. Dieser Aufiatz stellt eine Analyse der Tendenzen auslandischer Direktinvestierungen (Foreign Direct Invest- ment: F D I) Ende der siebzigerJahre in den vier Hauptrandge- bieten des Vereinigten Konigreichs vor. Unter Benutzung unveroffentlichter Datenquellen analysiert er die sich wan- delnde Bedeutung des in auslandischem Besitz befindlichen Sektors der herstellenden Industrie in Nordirland, Schottland, Wales und dem Norden Englands, und unter dem Aspekt der Niederlassungen und damit verbunden Besch>enzahl die Leistung des Sektors gegenuber dem des einheimischen Sektors in jeder dieser Regionen. Es zeigen sich deutliche Leistungsunterschiede zwischen den Regionen. Indem die Studie die Hauptkomponenten identifiziert, die zum Gesamt- wandel beitragen, gewahrt sie Einblick in diesen Aspekt der regionalen Umstrukturierung, besonders die Bedeutung fur den Wandel irn Erwerbsleben, den neue Niederlassungen im Verhatnis zu SchlieBungen, Werksubemahmen sowie Er- weiterungen und Schrumpfungen am Standort mit sich bringen. Sie zeigt auch, daO die regionalen Unterschiede in der gesamten F D I Leistung nicht nur das Ergebnis verhdt- nismaRigen Erfolgs, vom Erwerb neuer Niederlassungen her gesehen, ist, sondem auch hohere Leistungen in Bezug auf andere Hauptkomponenten des Wandels widerspiegelt.
Ian Stone
and Frank Peck
i la redistribution de l’investissement direct ktranger associte
aux principaux paydrkgions d’ou vient l’investissement.
Investissement direct ttranger
Regions pkriphtriques du Royaume-Uni Restructuration industrielle
Banque de donnies sur les ttablissements
Variables qui contribuent au changement industriel Performance en fonction de la proprittt
I N T R O D U C T I O N
The second half of the 1980s saw a boom in foreign direct investment (FD I) into the U K with a third of all inward direct investment entering the E C coming to this country. Attractions such as relatively low labour costs, legislation curbing union power, an easily adopted business culture, language and the political welcome extended to overseas investors, led to pre-recession net inflows which peaked at around A17 billion in 1989 and 1990 (Business Monitor, 1991). The demise since the mid-1970s of large sections of British manufacturing capacity, combined with weak policy support for indigenous industry over the 1980s, made the attraction of new manufacturing capability from overseas central to re-industrialization efforts. Apart from the jobs it creates, F D I has traditionally been associated with h g h - technology products and processes ( D U N N I N G , 1979;
DAVIES and LUND, 1989) andlevels ofcapital spending per head and productivity which are well above the national average (FOLEY, 1990). Such investment is thus viewed as particularly important in the diverslfication and regeneration of regional economies, and promo- tional agencies at regional and sub-regional scales have over the last decade intensified their efforts to win a larger share of the projects.
Yet in spite of the importance of this sector, our knowledge of its development trends and characteristics is restricted. Published statistics relating to F D I arc in
a number of respects deficient, hampering efforts at analysing the performance of new and existing foreign manufacturing plants, particularly at a spatially disaggre- gated scale (BAILEY et al., 1994; for a briefreview ofthe type of data generally available and its problems, see
H I L L and M U N D A Y , 1992a; for an earlier attempt at
analysingregional F D I trends, see D I C K E N ~ ~ ~ L L o Y D , 1980). The fullest information relating to new invest-
ments (number, sector and location) and associated employment is that compiled &om regional agency returns by thc Invest in Britain Bureau of the D T I. This is limited, however, in that data on foreign investment are not systematically gathered (ix. they include only those projects notified to the IBB) and figures o n job creation refer to forecasts of employment over the long term (made by the companies themselves) rather than actual employment.
AbschlieBend wird gezeig, das regonale Leistung in auslan- dischem Besitz befindlicher herstellender Sektoren mit Mustem des Wandels in FD I verknupft zu sein scheint, die mit den Hauptregonen oder-landem verbunden sind, aus denen
die Investierungen stammen.
Auslandische Direktinvestierungen Randgebiete des Vereinigen Konigreichs Industrielle Umstmkturiemng
Datenbank von Industrieuntemehrnen Komponenten des Wandels in der Hentellung Leistung nach Besitzverhaltnissen
The problem with this approach to data gathering is illustrated by the findings of the National Audit Office investigation of Locate in Scotland, which measures inward investment employment on the same basis. O f
62 assisted projects set up during 1981-83, reviewed in October 1988, one-third had either failed or not started at all and a further two-fifths had yet to achievc their own projected job target (HM G O V E R N M E N T ,
1990). While I B B figures identift- separately jobs in new projects and those claimed to be ‘safeguarded’ by overseas investment projects, the definition of ‘new’ investments was widened in 1983 to include not only entirely new projects, but also expansions, joint ventures and acquisitions. Thus, Welsh Development Agency evidence to the Welsh Affairs Committee suggested that only 38 of the 151 projects in Wales during 1985-87 were actually entirely new, and that these provided only half the total number of jobs indicated by the I B B for the three years ( H M
G o
v
E R N M E N T, 1989).Even if the I B B figures were more reliable, they would still allow only a partial view ofwhat is happening overall in relation to F D I . Insight into the dynamics of change within the foreign-owned manufacturing sector (F 0 M S ) is denied to researchers because figures do not permit the separation of the components contributing to aggregate change. This applies not only to the individual sources of growth (new openings, expansions and takeovers of UK-owned plants) -for which a crude overall measure is at least attempted in official statistics
-
but in particular to the sources of contraction. Avail- ability of information on the number of closures (and related employment losses) has been curtailed by the withdrawal from publication of the Record of Openings and Closures in 1983, while in situ contraction and divestment of assets by foreign-owned companies are not identifiable from published statistics. The main source of information o n the overall impact of invest- ment and disinvestment decisions upon the stock of foreign plants and related employment is the Census of Production. Statistics published in the Business Monitor
The Foreign-owned Manufacturing Sector in U K Peripheral Regions, 1978-1 993
57
Table 1. Mangacturing employment pegormance: fore@ and UK-owned sectors compared, 1978-93 (000s)
1979 1989 1993
Region Foreign Indigenous Foreign Indigenous Foreign Indigenous
Northern Ireland 304’ 100.9 17.7 94.0 27.9 71.1
Scotland 108.1 468.3 81.1 290.9 86.1
‘
261.9North 49.2’ 362.1 53.7 220.8 55.7 188.3
Wales 59.0 245.0 60.6 170.5 68.0 135.0
Notes. 1. 1992 figure. 2. 1978 figure.
Sources: Business Monitor P A 1002. 1979, 1989; Employment G a z e f f e , 1993; foreign sector figures on employment in foreign-owned sector from
Regonal F 0 M S databases.
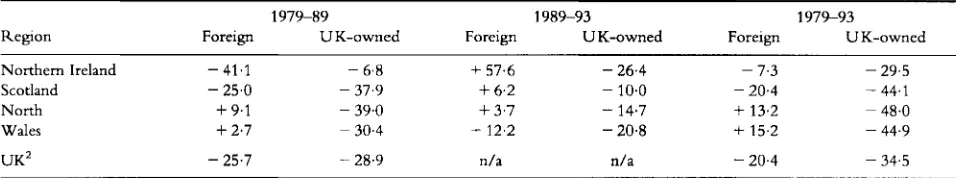
Table 2. Percentage changes in manufacturing employment: comparison ofregional F O M S and UK-owned sector, 1974L93’ and sub-periods
197S89 1989-93 1 9 7 S 9 3
Region Foreign UK-owned Foreign UK-owned Foreign UK-owned
Northern Ireland - 41.1 - 6.8
+
57.6 - 26.4 - 7.3 - 29.5Scotland - 25.0 - 37.9
+
6.2 - 10.0 - 20.4 - 44.1North
+
9.1 - 39.0+
3.7 - 14.7+
13.2 ~ 48.0Wales
+
2.7 - 30.4+
12.2 - 20.8+
15.2 - 44.9UK2 - 25.7 - 28.9 n/a n/a - 20.4 - 34.5
Notes: 1. Start date for Northern Ireland and the North is 1978; end date for Scotland is 1992.
Sources: As for Table 1.
2. U K figures relate to 1979-91 and are based entirely on P A 1002 statistics.
employment figure by a considerable margin (see below).
Given the scale of resources devoted to attracting foreign inward investment, and the importance of such investment in terms of regional development and employment, it is surprising that so little is known of the dynamics of F D I at regional and national levels. This
paper is an attempt at fding some of the gaps in our knowledge relating to changes in the foreign-owned manufacturing sector (F 0 M S ) a t the regional scale. The analysis is directed at the main peripheral regional economies (Scotland, Wales, the North of England and Northern Ireland), and is based largely upon comparable data drawn from independently-held establishment databases covering the period since the late 1970s (see Appendix). Each of the databases has been compiled, up-dated and cross-checked on a systematic and on- going basis throughout the period covered. Although the initial date for both Scotland and Wales is 1979 and that for the North and Northern Ireland is 1978, this difference has minimal impact in terms of comparabhty of trends, since the overall employment total for overseas plants in Scotland is virtually identical for the two years, and in the case of Wales differs by less than 1% of the total.
Th e paper contains comparisons of the overall performance of the respective regional F O M S which are more reliable than those available from published statistics, and begins with an analysis of regional F D I performance alongside those of indigenously-owned counterparts. It then proceeds to set the F O M S trends in the context of the spatial distribution of foreign plants
within the UK as a whole. This is followed by a section focusing upon the dynamics of F D I change within the regions covered via the application of components of change analysis (C CA). This section offers accurate comparisons of the number of new investments and related employment for each ofthe regions. It also shows the relative importance ofthis element - alongside those of closures, net acquisitions and expansion/contraction in situ
-
in aggregate change occumng within the FOMS. This section is very revealing in terms of the relative contributions to overall change of the different components, and of the patterns by region. O ne aspect which immediately becomes prominent is the role of net acquisitions within aggregate change. The next section examines the relationship between regional F 0 M S performance and changes in the structure of F D I by country/global region of origin in each of the four regions studied. The conclusion identifies a number of research and policy issues arising out of the findings.OVERALL F O M S PERFORMANCE
Analysis of the overall employment performance of the foreign sector in the four regions studied (derived from regional F O M S databases) shows a clear contrast between the gains (13% and 15% respectively) in the North and Wales, and contraction ( - 20% and - 7%) in Scotland and Northern Ireland for the period 1978-79
58
Ian Stone and Frank Peck
comparatively small rise in plant numbers (15 and 24 respectively), compared to the North (
+
102) and Wales(
+
135). The employment figures for Northern Ireland are distorted by the proportionately huge privatization acquisitions since the late 1980s ofshorts Aerospace and the Harland & Woolf shipyard, causing an overall 58% increase for the second sub-period, compared with a contraction ofover 40% during 1978-89. Without these exceptional transfers, the Northern Ireland total would be down by around 40% over the whole period- substantially greater than the fdl in Scotland of 20%, which is in line with the F O M S employment contrac- tion experienced nationally; Business Monitor figures for the U K suggest that, over 1979-91, employment in foreign-owned manufacturing enterprises fell by 20% (Table 2). Given that the North and Wales both performed substantially better than the national F 0 M Saverage, this suggests a clear redistribution in favour of these regions.
Three of the regions show an improvement between the periods, reflecting in particular the effects of a huge shake-out in manufacturing in the 1980s and a substantial F 0 M S growth momentum in the second half of the 1980s which carried through into the recession period. While the North and Wales both returned a net increase in F O M S employment in both sub-periods (the interval between pre-recessionary years 1978 and 1989, and that between 1989 and 1993), the relative performance of the regions reversed as bctween the periods, as the North’s F O M S grew by just under 4% for 1989-93 and Wales took over as the leading regional performer (12% growth in 1989-93). During this period, the North - the best overall performer in the 1980s with F O M S employ- ment growth of 9% - was, in relative terms, the poorest ofthe four regons. In fact, the North continued to gain F 0 M S jobs at roughly the same rate as before while the other regions improved their employment performance, suggesting regional volatility in the F 0 M S as a whole over time. It is worth noting, though, that the North, during 1989-93, still managed to achieve a net gain of foreign plants well in excess of those in either Scotland or Northern Ireland.
A crude perspective can be gained on the F O M S performance through comparison with that of the indigenously-owned sector. The F 0 M S performance was markedly superior in employment terms over the whole period, continuing a trend identified in these regions during the second half of the 1970s (HARRISON, 1982; I N D U S T R Y DEPARTMENT F O R SCOTLAND, 1983; Y O U N G et al., 1988). This pattern was found to be cvident for all regions and sub-periods, with the exception ofNorthern Ireland during 1978-89 (Table 2). While the Northern Ireland F 0 M S collapsed between these years (by 41%), employment in its indigenous counterpart held up well by comparison with the other regions studied, and that ofthe U K as a whole. However, the larger-than-average post-1989 contrac- tion in the province’s UK-owned sector meant that, for
the period as a whole, Northem Ireland conformed to
the broader pattern, although its indigenous sector shrank at a rate below that of the other three regions (which ranged from 44% to 48%).
Outwardly, the observed pattern tends to confirm the value of F D I within regional economies in terms of its contribution to employment stability. The extent of the difference between the regions is complicated, however, by the effect of net acquisition of UK-owned plants by foreign companies and this is considered in more detail below. What is clear is that the employment perform- ance of the respective regional foreign-owned sectors is by no means simply a reflection of the general performance of manufacturing employment at the regional level. For example, there is a substantial contrast between the F O M S change in Scotland and that in Wales and the North, and yet the percentage fall in the indigenous manufacturing sector is uniform across the three regions (see Tablc 2).
Variation in F O M S employment among the four regions has, in combination with trends in the indige- nous manufacturing sector, resulted in changes in the relative importance of the F 0 M S within the regional employment structure. In 1978, reflecting intensive regional policy efforts to attract F D I to the province, 23% of Northern Ireland’s manufacturing employment was in foreign-owned plants. Largely as a result of the acquisition of Shorts (and, to a lesser extent, Harland & Woolf) -and in spite of an indigenous performance which was still better than the other regions -by 1993 the share of F 0 M S employment had risen to 28% (Fig. 1). Indeed all four peripheral regions recorded pro- portional increases in F O M S employment share. In Wales this proportion increased to no less than one-third of the total manufacturing employment, while the greatest proportional rise has been in the North, which lagged substantially behind the other regions at the beginning of the period. k s e s in each case are sharply in excess of that for the U K (based on Business Monitor
T h e Foreign-owned Manufacturing Sector in U K Pevipheral Regions, 1978-1 993
59
35
30
25
20
15
10
5
0
‘ Tt t
199
Wales
North*
N/lreland*
Scotland
UK
Fig.
1. Foreign-owned sectors’ share o f regional manufacturing employment (99)Note:
*
Based on 1978 figure for foreign employment.investment was polarized between the core and periph-
ery, towards a situation where the ‘inner’ peripheral regions have improved their relative standing as the inflows both to the South East and outlying regions have fallen off (HILL and MUNDAY, 1992b). This is apparently also the case in the USA, where a ‘more general dispersal of foreign capital’ since the 1970s has replaced the previous spatially polarized pattern ( G L I C K M A N and W O O D W A K D , 1988).
Finally, it is worth noting the extent to which the figures for employment in foreign-owned enterprises derived from regional F 0 M S databases diverge from those published in the Business Monitor (PA 1002). The latter appear increasingly to underestimate the true size of the F D I sector. Published figures for the late 1970s are not far out of line with those of the databases. This is particularly the case in relation to Northern Ireland and the North, although there is a discrepancy ofaround 10% for Scotland and Wales. By 1989 the under-counting gap
Table 3. Location quotients: proportion of regional F O M S employment relative to share ofUKmanujacturing employment
Region 1979 1989 1993
Northern Ireland 1.60’ 1.10 1.56
North 0.85’ 1.34 1.26
Wales 1.38 1.78 1.87
Scotland 1.34 1.49 1.372
U K 1 .00 1
.oo
1.001Notes: 1. Based on 1978.
2. Based on 1992 figures for foreign employment. 3 . Relates to 1991.
Sources: As for Table 1.
had risen to 30% for Northern Ireland, 33% for Wales, 15% for the Northern Region and 7% for Scotland. Figures are not yet published relating to 1993 but, unless they are sharply increased fiom 1991 levels (the latest available), similar discrepancies will apply. The most likely explanations of this are: (1) definitional (the regional databases all use place of ultimate ownership, thus including as ‘foreign’ companies which are sepa- rately registered in the UK); (2) the failure of C S 0 data to fully represent acquisitions by the foreign sector (the number of which has increased significantly over the last decade); and (3) the fact that the date for employment totals given in PA1002 lags behind that for the number of plants. Whatever the relative importance of these sources of undercounting, the observed discrepancy raises questions about the true size ofthe F 0 M S in other
U K regons, and may indicate that nationally the size of the indigenous sector as a whole is being increasingly over-estimated.
C O M P O N E N T S O F F O M S C H A N G E B Y RE GI 0 N
Analysis of the various elements making up the overall change in F O M S reveals a dichotomous pattern consistent with that apparent in relation to performance overall. The contrast between Wales and the North on
60 Ian
Stone
and
Frank Peck
Table 4. Components of F O M S change by region 1978-93:' number ofplants (and associated employment)
New Stock at
Initial creations Closures Acquisitions Divestments In situ change Net end of
Region stock ( + I ( - ) ( + ) ( - ) ( + ) ( - ) change period
Northem Ireland 68 (30,100)
Scotland 352
(108,065)
North 154
(49,201)
Wales 217
(58,900)
27 28
(4,162) (14,653)
144 158
(19,219) (41,760)
89 50
(14,618) (10,366)
129 59
(17,000) (6,700)
24 (12,610)
84 (19,272)
79 (1 5,295)
118 (22,600)
13 (4,648)
79 (18,148)
53 (1 3,105)
64 (16,800)
+
15( - 2,197)
+
24 ( - 21,976)+
102(
+
6,455)+
135 (9,100)83 (27,903)
376 (86,089)
256 (55,656)
348 (68,000)
Notes: Scotland 1979-92; Wales 1979-93. Source: Regional F 0 M S databases.
The relatively superior overall performances of the F O M S in North and Wales is clearly underpinned by new investments. These regions exhibit significantly h g h e r gains in terms of number of plants (58% and 59% respectively, compared to 40% and 41% for Northern Ireland and Scotland) for the period 1978-93 (Fig. 2a). The disparity in terms of associated employment creations is even larger, with both Wales and the North showing a rise of nearly 30%, compared to 14% and 18% for Northern Ireland and Scotland (Fig. 2b). It
is clear from Table
4
that new plants play only a limitedpart in the overall change in F O M S employment. Turnover of plants is high, and employment in new creations
as a proportion of original stock is not infrequently exceeded by several of the other individual components of change.
This is particularly noticeable in the case of closures as
they have affected the F 0 M S in Scotland and Northern Ireland. The resulting respective loss in terms of original stock of employment in the two regions is 39% and 49% for the whole period. These figures represent the largest impact in terms of the individual components of changc, and indicate that for these regional economies it is the loss of plants through closure which has been a
prominent contributor to overall performance. Once again, Wales and the North experienced a markedly different trend, with proportionately fewer closures and comparatively small associated employment losses of 11% and 21% respectively-in both cases well below new creations (Figs. 2a and 2b).
Acquisitions have also played a major role in net F 0 M S change. Table 4 reveals that, in all four regions studied, at least as much gain in F 0 M S employment is derived from foreign acquisitions of U K-owned plants
as from new openings, in spite of the fact that the number ofunits is generally smaller in the case oftakeovers. Once more, if the wholly exceptional takeover of Shorts Aerospace in Belfast is left out of account, the dichotomy is in evidence, with 31% and 38% F O M S employment gains through acquisition activity in the North and Wales, and much lower proportions in Northern Ireland
(16%) and Scotland (18%) (Fig. 2b). Transfers from the F 0 M S to the indigenous sector through divestments (including management buy-outs), have generally oc-
curred o n a much smaller scale, involving employment totals varying from 6% to 9% of the original stock for Northern Ireland, Scotland and the North, and 21% for Wales. O n balance, therefore, ownership transfers have resulted in a considerable net gain to the F 0 M S in each region, both in terms of number of plants and associated employment (see Figs. 2a and 2b). Indeed, without this contribution, overall shrinkage of the F O M S in Northern Ireland and Scotland would have been more dramatic (i.e. 44% and 30% respectively), and in both the North and Wales the sector would have failed to achieve net growth over theperiod, contracting instead by 11% and 2%. Such plants and jobs are, of course, not new to the region, and while circumstances of takeover often involve plants in danger of closure, it is frequently profitable plants which are attractive acquisitions, and these would have long term prospects if they continued in domestic ownership. Such transfers have obvious implications for the performance of the indigenous sector.
T h e Foreign-owned Manufacturing Sector
in
U K
Peripheral Regions,1978-1 993
61
a) Openings Closures Acquisition Divestment In Situ + In Situ
-
Net Change60
50
40
30
20
10
0
,lo
20
30
40
1 0
I
Nnreland
(b) Openings Closures Acquisition Divestment In Situ + In Situ
-
Net Change50
1
40
30
20
10
0
-1 0
-20
3 0
-40
5 0
0 Wales D North 0 Nllrelan
7
ScotlandF&. 2. Components of F O M S change by region, 1978-93: (a) percentage change in number ofplants; (b) percentage change in employment
what outwardly might be expected given the wider pattern of performance.
T h e apparent anomaly may be explained by structural characteristics ofinherited plants in the different regions, one element in the framework developed by
STAFFORD and WATTS, 1991, €or analysing causes of closure. The main influx of post-war U S (and EC)
investment occurred earlier in the case of Northern Ireland and Scotland than in the North and Wales
62
Ian Stone and Frank Peck
Non EC (Europe)
E7 Japan
€Bl Other
100%
80%
60%
40%
20%
0% t
+
-1 -t+
+
-tI
Fig. 3. Stock offoreign-owned sector employment by areas Oforigin
(“A
total)Stafford and Watts’ analytical framework, namely the external (i.e. regional) factors (see also F O T H E R C I L L and GUY, 1990). Where it was perceived that a region’s operating environment (e.g. labour climate, market access) had improved relative to that of other regions, it may be anticipated that rationalization within multiplant organizations would be more likely to favour such a region. In such circumstances, higher in situ employment losses in the North and Wales might represent a positive choice of rationalization to improve the productivity of plants which in a less favourable regional environment might simply have been closed.
S H I F T I N G P A T T E R N S O F I N V E S T M E N T O R I G I N A N D
D E S T I N A T I O N
The pattern of investment associated with the various geographical areas of F D I origin has been an important element in the identified pattern of differential F 0 M S
growth. There has been a significant change over the period in the nationality structure of overseas ownership
at regional level, as is shown in Fig. 3. While it is possible to identify some general changes - common to all the regions - in terms of a shift in the pattern of dependence by country of origin, it is the relative scale ofthese changes as experienced in individual destination regions which has given rise to differences in overall performance.
The context of this scction is provided by the concept of globalization, whereby functional integration be- tween internationally dispersed economic activities is
intensified. Reduced communication costs, technologi- cal change and the facilitation (institutionally and politically) of inter-country flows has widened the range of countries, companies and industrial sectors affected by the process (see, for example, U N I T E D NATIONS, 1993). This underpins the observed growth in the size
of inward F D I flows, the increase in the number of foreign-owned plants operating in the UK and the tendency for such investment to become more pluralistic in origin, spatial dstribution and mode of operation.
U S plants dominated early post-war flows of F D I into the UK, with Scotland especially being a prime focus for the establishment of branch plants. The U S A was a powerful creditor nation and its companies were -market leaders in a large number of product sectors, due to technological and economic factors. Such investment was largely ‘market seeking’ in character: the U K was a large market, amenable to domination strategies and additionally provided access to the markets of E F T A
The Foreign-owned Manufacturing Sector in U K Peripheral Regions, 1978- 1993
63
less as self-contained units identified with the host countries and more as elements in a European or global network of activities ( D U N N I N G , 1993).
The creation of a Single European Market merely i n t e n d e d this process and has encouraged large compa- nies, in particular, increasingly to pursue ‘efficiency seeking’ investments along the lines of an E C wide regional division of labour (CAN TWEL L , 1989). Notwithstanding such developments involving E C firms, it has been suggested that reductions in tariff and non-tariff barriers within the E C will tend to result in lower intra-bloc F D I flows (due to the fall in market seeking investment), but that firms with domestic production bases outside the E C will tend to increase their investment flows to gain access to the integrated market (MOTTA and NORMAN, 1992). Japanese and Far Eastern F D I is the most obvious example of this response, but it has also been an important factor in both North America and non-EC European investment inflows which have contributed to the surge in F D I in the second-half of the 1980s.
There are a number of other important developments affecting the origin and character of F D I flows. These include a general weakening of the competitive position of U S companies, with implications for accumulated F D I and the flow of new investment. This process has been uneven across sectors and is particularly pro- nounced vis-a-vis Japanese companies, who have devel- oped a competitive advantage in terms of possession and organization of specific income-generating assets. The recent period has also seen the increased participation in international production of smaller M NEs, reflecting the technologcal and institutional changes which have facilitated cross-border flows together with the growth in specialized markets and flexible production (PIORE and SABEL, 1984). Other developments include a larger role for mergers and acquisitions in the process ofmarket entry by foreign investors, and a general increase in emphasis upon networks of externalized relationships through various forms of strategic alliances, including joint ventures. Within this fi-amework, E C and non-E C European companies have been especially active in cross-border ‘strategic asset acquiring’ investment ( D U N N I N G , 1993).
These general trends provide the backdrop to the following examination of the contribution to overall F O M S change in the four regions of company investment and divestment decisions by country or global region of origin. Figures are drawn fi-om Table 5, unless otherwise specified.
U S plants
Reflecting the accumulation of investment through to the 1970s, F D I from the United States dominated the overseas-owned sector in all four regions at the beginning of the study period (ranging from 63% to 75% of F 0 M S employment). Its initial dominance within
each region’s F 0 M S has meant that its contraction since the late 1970s has had a major impact on the sector’s employment overall. This particularly applies in the case of Northern Ireland, where US plants recorded the largest proportional fill (54%), followed by the North (43%) and Scotland (37%). Th e impact has been less marked in Wales, which experienced a sharply lower rate of contraction (23%). The contrast between Wales and the North indicates that the performance dichotomy identified in the previous sections is not simply a
reflection of the overall performance of the main initial source of overseas investment. In the context of limited employment gain fi-om new investments fi-om other areas of origin, however, the high employment loss through closure recorded among U S plants in both Northern Ireland (41% of original US stock) and Scotland (35%) has been ofparticular importance. While the North, like Wales, experienced a lower proportion- ate loss through U S plant closures, this was outweighed by a high net in situ contraction in jobs and the tendency for its new plants fiom the U S A to be small in employment terms relative to those attracted to other regions.
Both Scotland and Northern Ireland have relied significantly upon U S investment for their new plants; incoming units into these regions have been large relative to the overall average and account for around half of all employment gains from new set-ups. This share is mainly a reflection of the paucity of supply of new investments &om other areas of origin, however. Even Scotland, which was the most successful of the regions in attracting new U S plants (linked particularly to its integrated electronics complex), was not far ahead of the other regons in terms of new employment as a
proportion oforiginal stock o f U S employment. United States FD I through acquisition was ofsmall importance, apart fi-om in Wales, where it amounted to almost twice the employment figure for new openings; however, divestments to U K ownership of U S plants in each of the regions, including Wales, served to cancel out this source of employment gain.
European Community plants
Overall change affecting E C plants is a clear source of differential performance between the four regions, and the pattern of impact conforms to the broader di- chotomy identified. Dependence on E C plants at the outset of the period was most marked in Northern Ireland, where a small number ofvery large plants helped bring the E C share of F O M S employment to 33% in 1978. Other regions were substantially below this, at
64
Ian Stone and FrankPeck
Table 5. Regional components of F O M S change by main area ofinvestment origin 1978-93: employment and (number ofplants)
New Stock at
Initial creations Closures Acquisitions Divestments In situ change Net end of
Region stock ( + I (-1 ( + I ( - ) ( + ) ( - ) change period
Northern Ireland
U S A
E C
Nan-E C Europe
Far East
Other
Scotland North America
E C
Non-E C Europe
Japan
Other
North U S A
E C
Nan-E C Europe
Far East
Other
Wales USA
E C
Nan-EC Europe
Japan Other 18,864 9,938 432 (33) (30) (2)
(3
(3) - 866 82,098 (242) (57) (31) (3)(1 9) 19,059 5,468 259 1,181 36,465 7,309 3,008 (98) (28)
(1 6)
(1)
(1 1) 287
2,132
40,700 (1 10)
(41) (28) 2,700 (5) 6,200 (33) 5,600 3,600
- 10,208
( - 5)
( + 10)
+
2,235 ( + 4 )+
1,685( + 7)
+
7,734 ( - 1) - 3,643- 31,640
( - 50)
( + 27)
( + 21)
( + 20)
( + 6)
- 6,291
- 6,302
+
6,468+
3,181- 15,595 ( + 2 )
( + 39)
( + 26)
( + 32)
( + 3)
+
5,472+
6,711+
9,289+
578- 9,400
( + 15)
( + 69)
( + 11)
( + 28)
( + 12)
+
9,000+
1,500+
8,500- 400
8,656 6,295 2,667 1,685 8,600 (28) (40) (6) (7) (2) 50,458 12,768 11,774 6,727 (192) (84) (52) (23) (25) 4,362 20,870 12,781 9,719
(1 00)
(67) (42) 9,576 (33) 2,710 (1 4) 31,300 14,600 5,100 (125) (110) (39) 1 1,200
(33) 5,800
(45)
Notes: 1. Initial figures for Wales and Scotland are 1979; end figures for Scotland relate to 1992.
2. Canada included in ‘Other’ for all regions apart from Scotland, where it is included in ‘North America’ 3. Star (*) indicates data is not available at this level of disaggregation.
S o w e : Regional F O M S databases.
The Foreign-owned Manutcturing Sector
in
U K
Peripheral Regions,
1978- 1993
65
transfers account for over 90% of net E C employment gains in each. New E C plants in each ofthe regions have tended to be relatively small - little more than half the average size across the board - thus restricting their employment impact. E C companies also account for a large proportion (three-quarters) of acquisitions in Northern Ireland. Most of these, however, originate from the Irish Republic, whereas in other regions it is
Germany, France and Holland which dominate the inflow, with qualitative implications in terms of techno- logical level and market orientation.
The pattern of employment change arising out of net investment flows is consistent with the re-orientation of U K trade since the early 1970s towards the E C and the geographic origin of investment. Research shows that spatial and cultural distance are relevant factors in explaining investment origin (MOLL E and M O R S I N K , 1990; T H O M S E N and W O O L C O C K , 1993), and the investment preference of companies for the core E C countries for the North (where F D I is concentrated in the North East) and Wales might be regarded as consistent with this, as would the dominance of Irish Republic investment within E C investment into Northern Ireland.
Non-E C European plants
This group originates from small countries which have for some time relied upon developing or retaining their competitive position by producing a large part of their output outside the home country. Although their interest in undertaking investment in the U K was heightened in the 1980s by the prospect of the Single European Market (market-seelung F D I), they have also been engaged in ‘strategic asset acquiring’ to sustain or enhance their competitive position in product areas in which they specialize (e.g. Scandinavian companies in downstream areas of paper and packaging materials).
Th e spatial pattern ofinvestment by this group among the regions studied is consistent with the observed tendency for cross-border flows to be strongest between adjacent areas. The largest addition to F O M S employ- ment from this source was the North, which saw the share of non-E C European plants rise from 6% to 18%
over the period (Fig. 3). This was an important source of F 0 M S growth in the North, involving a net gain in jobs which was not far short of that from the Far Eastern F D I. The only other region to benefit substantially from non-E C European F D I was Scotland where, apart from Far Eastern investment, this source was the only one which recorded growth over the period (taking the employment share fkom 5% to 14%). Non-EC Euro- pean firms have shown little interest in Wales, where their share of F 0 M S employment increased hardly at
all. In Northern Ireland the share of employment accounted for by non-E C European plants would still be around 1% of the total but for a single acquisition (the privatization of the shipyard). Indeed, acquisition has
been the main mode of entry for non-E C companies in each of the regions.
Far Eastern plants
T h e differential impact of investment from the Far East (mainly Japan) has been a factor in the contrasting F 0 M S performances of Wales and the North on the one hand and Northern Ireland and Scotland on the other. (Note that for Scotland and Wales Table 5 distinguishes Japanese F D I separately; the comparatively small, non-Japanese, Far Eastern investment is contained within ‘other’). Although this source has contributed respectively 30% and 21% ofthe employment from new creations in Northern Ireland and Scotland - in both cases the second largest contribution by origin behind the U S A
-
in both the North and Wales this source is by some margins the largest contributor (52% and 40%) to employment in new plants. The current F O M S employment share of plants of this origin is 6% and 8%in Northern Ireland and Scotland, compared with around 17% for both the North and Wales (Fig. 3).
With only a limited number ofUK-based plants at the outset ofthe period, the Far Eastern sector’s performance is effectively determined by new plant investments. Japanese companies have generally restricted their acquisition activity to one or two product areas (e.g. tyres). The 26 new plants in each of the North (Far Eastern) and Wales (Japanese only) represent a smaller number ofnew projects compared with some other areas of origin, but they are distinguished by their relatively high average employment size (nearly 300 in the North and 265 in Wales). This reflects the fact that market leadership in certain product areas
-
especially vehicles and mass produced consumer items in the field of electronics (involving plants which are relatively large by today’s standards) -has shifted towards Far Eastern firms, and also the fact that these plants are oriented towards an E C rather than national or sub-regional market.The spatial concentration of Far Eastern investment is related to the build-up of linked production, mainly around key assembly plants, based on just-in-time delivery and synchronized production. The Japanese preference for building an industry fkom scratch
-
in all its aspects, including supplier network, skill formation, and labour institutions and practices - has frequently led Far Eastern companies to locate in areas without previous experience of their particular industry ( G A R R A H A N and S TE W ART, 1992; O L I V E R and W I L K I N S O N , 1990; and PECK and STONE, 1992). Acombination of E C ‘local content’ rules, the absence of
a pre-existing, local, specialized supplier base, and exacting quality requirements for components has encouraged the formation of integrated industrial clus- ters involving follow-on investments from the Far East, which have intensified as the core activity has grown.
66
Ian Stone and FrankPeck
projects influence (via promotion and demonstration effects) other mobile plants not specifically connected with the industrial complex. M C C O N N E L L , 1980, has argued that, given the high cost ofinformation gathering on location, satisficing rather than optimizing behaviour among potential investors is likely. This would apply particularly to smaller companies with limited experi- ence of operating in an unfamiliar cultural and geo- graphic setting. Analysis of new inward investment by year of entry carried out for the Northern Region suggests strongly that a cumulative process is present.
Other sources
This tends to be a relatively small category in employ- ment terms, and is mainly made up of Canadian F D I. It contains within it some features which particularly affect individual regions. The most obvious example relates to Northern Ireland, where the Canadian acquisition of Shorts Aerospace has had a proportionately large impact upon the size and ownership structure of the F O M S . Scotland has also been affected by changes in Canadian investment; accounting at the outset for 8% of the regon’s F 0 M S employment, F D I from this source has contracted to an even greater extent that that of US
origin (by 49%), cancelling-out growth &om other sources within this category.
C
0 NCLUS I 0 NS
This paper has offered an up-to-date analysis of F D I trends in the four main peripheral regions within the UK. Using data sources which are not in the public domain, it has drawn attention to the changing significance of the F 0 M S in each of the regions, and the performance of the sector in terms of number of plants and associated employment over the period since the late 1970s. It has identified a distinct gap in terms of performance between Northern Ireland and Scotland on the one hand, and the Northern Region and Wales on the other, and has identified the main components contributing to the overall change. The analysis thus provides an insight into the process by which change comes about, specifically the importance to employment change of new plants relative to that of closures, acquisitions and in situ expansions and contractions. In particular, it draws attention to the importance of acquisitions as a contributor to F 0 M S growth. It also shows that the identified difference in overall F D I performance between the two pairs of regions is not merely the outcome ofa relatively better performance in terms of attracting new plants, but reflects also superior performances in relation to other key components of change. Moreover, it has demonstrated that regional F O M S performance does seem to be linked with patterns of F D I change associated with the main countries/regions of investment origin.
This paper follows in the tradition of the empirically-
based approach associated with F OTHER CI LL and G U D G I N , 1982, who have argued that the most useful work on regional growth and decline has been largely non-theoretical, essentially, ‘detailed work on what actually happened’ (p. 5). Like shifi-share analysis, the technique extensively used by Fothergill and Gudgin, C C A cannot ‘explain’ performance differences. It can, however, throw light on the process through msaggre- gating contributing elements in overall change and draw attention to potentially useful lines of investigation.
Thus, whilst a differential impact upon regional F 0 M S performance of F D I by country/global region of origin is discernible, linking this to specific host region conditions is difficult, especially, as in this case, where all four regions have assisted status and relatively small differences exist between them in relation to variables (e.g. wage rates, financial incentives, availability of labour) which are normally found to be prominent in econometric studies incorporating a wider range of regional types (e.g. HILL and MUNDAY, 1992b; T A Y L O R , 1993; and, relating to the U S A , G L I C K M A N and W O O D W A R D , 1988). Some relevant influences have been suggested - general ones (e.g. spatial proxim- ity to source country and market access factors), and some which are more specific (e.g. inherited plant structure, clustering and cumulative dynamics) - but these remain somewhat speculative.
In terms ofthe research agenda on inward investment, the comparatively small part played by entirely new investment projects in overall change within the sector suggests that the focus of F D I research should be wider, particularly given the policy shifts in favour of ‘aftercare’ and strategies to build upon industrial ‘clusters’ (BRADLEY and T O M A N E Y , 1993; BR ADL E Y et al.,
1993), and the increasing competition for new mobile investment. Closures and contractions, and the possible link between them, is one area of interest; acquisitions is another. The process by which decisions are made in relation to such aspects of FDI, and in particular the extent to which regional factors (i.e. relating to compet- itiveness) influence the decision, is a potentially interest- ing area for research. The findings presented here suggest the presence of a ‘regional effect’ which extends across the whole range of investment and divestment decisions occurring within the F 0 M S. The extent to which this is related to perceived competitive advantages of regions such as the North and Wales as production locations (making foreign investors more inclined to acquire plants in these regions or rationalize plants which might otherwise be closed) as opposed to reflecting regional differences in inherited industrial structure (more favourable plant characteristics making it more likely that plants will be kept open or acquired) is an issue still to be explored.
Acknowledgements - The authors are grateful for the
assistance of the Welsh Office (Economics Division) and the
The Foreign-owned Manufacturing Sector in U K Peripheral Regions, 1978-1 993
67
relating to this research, and especially to those officers who assembled tables in customized form. Thanks are also due to R o n Keegan (N IE R C , Belfast) for his help in completing the statistical record relating to a group of 1978 Northern Ireland plants, Stephanie Snape and John Blyth for their help with the development of the N E R U databases, and Aidan Oswell for assisting with the graphs. Special thanks also go to Ian Smith (Teesside University) for access to his company data resources and for his helpful comments.
A P P E N D I X
Regional F O M S databases
This research is founded upon establishment databases independently compiled for each of the regons con- cerned. Those for the Northern Region and Northern Ireland have been assembled as a research resource within the Northern Economic Research Unit at the University of Northumbria and include all foreign manufacturingplants (defined in terms ofregistered head office of ultimate owners, or an overseas holding of at least 50% of share capital) operating (in the case of the Northern Region) since 1970 and (for Northern Ireland) in any of the years 1978, 1989 and 1993. An establish- ment is defined as a factory (unit) at a single site; no minimum size of employment has been adopted. Data include: location; date established; ownership/national- ity details including changes within the foreign sector and between foreign and indigenous sectors; product(s)
(4 digit SIC); closure date (if relevant); joint ventures (including ownership share); and employment (full and part-time combined) for key years. The Northern Region
F O M S Database has been drawn from a number of manufacturing establishment databases originally com- piled in the 1970s, updated with the aid of development agency lists of new and existing firms, local authorities (economic development offices, economic bulletins, etc), industrial surveys connected with other research projects, Who O w n s W o m , industrial directories such as
Dun & Bradstreet, local studies library archives and local press. For all surviving plants, details have been verified through telephone contact. T h e base year population for the Northern Ireland F O M S Database was identified with assistance from the Northern Ireland Economic Re- search Centre, Belfast. Updating in 1989 and 1993 has been camed out using Industrial Development Board lists of existing and new plants, combined with the samc range of sources used in relation to its Northern Region counterpart. Again, details have been obtained or
verified via telephone. These databases are both accurate and comprehensive in their coverage of the F 0 M S.
For Scotland, figures relating to the overseas- owned manufacturing sector are drawn from the Scottish Register
of
Employment (S R E ) (formerly known as the Regional Data System), which relates to all plants (defined as a factory at a single site) with 11 or more employees. Foreign ownership is defined as those plants with 50% or more of their share capital held by overseas-owned companies. T h e Industry Department (Statistical Services Unit) at the Scottish Office maintains and regularly up-dates this long-standing (i.e. since 1950) and reliable database, using returns made by the Employment Department, C S 0, Scottish Enterprise and direct contact with companies. The latest available up-date relates to 1992.Welsh F O M S data is based upon the Welsh Register
of Manufacturing Employment ( W R M E ) set up, like its Scottish counterpart, to monitor developments in manufacturing as a whole, and maintained by the Economics Division at the Welsh Office. The W R M E record includes the ultimate country of ownership of individual plants and, in the case of an acquisition by an overseas company, records the year in which transfer of ownership took place. The record is updated regularly using the same range of returns supplemented by direct contact with the companies themselves as in Scotland, and is regarded as the most comprehensive record available for Wales. There is n o minimum employment size applied to this database.
REFERENCES
B A I L E Y D., H A R T E G. and S U G D E N R . (1994) Transnationals and Governments: Recent Policies inlapan, France, Germany, the United
B R A D L E Y D. and T O M A N E Y J. (1993) Exploiting endogenous industrial potential, Bus. Rev. North 5(1), 23-26.
B R A D L E Y D., A M I N A . , H O W E L L S J . , G E N T L E C. andTOMANEYJ. (1993) Towards improving the cost effectiveness ofpublic C A N T W E L L J. (1 989) Technological Innovation and Multinational Corporations. Blackwell, Oxford.
D A V I E S S. and L U N D M. (1989) Multinational enterprises: some issues and facts, Econ. Rev., March, pp. 3-6.
D I C K E N P. and L L O Y D P. E. (1980) Patterns and processes of change in the spatial distribution of foreign-controlled manufac- D U N N I N G J. (1979) The UK’s international direct investment position in the mid-l970s, Lloyds Bank Rev. 1, 1-21.
D U N N I N G J. (1993) The Globalization of Business. Routledge, London. F O L E Y P. (1990) U K open for business, Lloyds Bank Econ. Bull. 38, June.
F O T H E R G I L L S. and G U D G I N C . (1982) Unequal Growth: Urban and RegionalEmployment Change in the U K . Heinemann, London. F O T H E K G I L L S. and G U Y N. (1990) Retreat from the Regions: Corporate Change and the Closure ofFactories. Jessica Kingsley, London. G A K K A H A N P. and S T E W A R T P. (1992) The Nissan Enigma: Flexibility at Work in the Local Economy. Mansell, London.
States and Britain. Routledge, London.
sector support for inward investment, Bus. Rev. North 5(1), 27-33.
Ian Stone and Frank Peck
G L I C K M A N N. J. and W O O D W A R D D. P. (1988) The location of foreign direct investment in the United States: patterns and H A R K I S O N R. T. (1982) Assisted industry, employment stability and industrial decline: some evidence from Northern Ireland, H I L L S. and M U N D A Y M. (1992a) The regional distribution offoreign dmect investment in the U K : a note, Area 24, 149-51.
H I L L S. and M U N D A Y M. (1992b) The U K regional distribution of foreign direct investment: analysis and determinants, Reg.
H M G O V E R N M E N T (1989) Inward investment in Wales, Report ofthe Welsh Affairs Committee, H P Papers, no. 86 (I and 11), H M G O V E R N M E N T (1990) Locate in Scotland, 4th Report of the Committee of Public Accounts, H C Papers, 1989-90, no. I N D U S T R Y D E P A R T M E N T F O R SCOTLAND (1983) Employment performance ofoverseas-owned manufacturing units opening M C C O N N E L L J. E. (1980) Foreign direct investment in the US, A n n . Inst. A m . Geogr. 70, 259-70.
M O L L E W . T. and M O K S I N K R. (1990) European direct investment in Europe: an explanatory model of intra-EC flows, M O T T A M. and N O R M A N G. (1992) Does economic integration cause foreign direct investment?, Department of Economics, OLIVER N. and W I L K I N S O N B. (1990) TheJapanisation ofBritish Industry. Blackwell, Oxford.
PECK F. and STONE I. (1992) Inward investment and the Northern Region labour market, Research Paper 6, Employment P I O R E M. and S A B E L C. (1984) The Second Industrial Divide. Basic Books, New York.
S T A F F O R D H. A. and W A T T S H. D. (1991) Local environments and plant closures by multi-locational firms: a cross-cultural
T A Y L O R J. (1993) An analysis of the factors determining the geographical distribution ofJapanese manufacturing investment in T H O M S E N S. and W O O L C O C K S. (1993) Direct Invertment and European Integration: Competition among Firms and Governments.
UNITED N A T I O N S (1993) Worldlnvestment Report: Transnational Corporations and Integrated InternationalProduction. U N , New York. W A T T S H . D. (1982) The inter-regional distribution ofWest German multinationals in thc UK, in TAYLOR M. and T H R I F T
Y O U N G S., H O O D N. and H A M I L L J. (1988) Foreign Multinationals and the British Economy. Croom Helm, London. determinants, Int. Reg. Sci. R e v . 11, 137-54.
Reg. Studies 16, 267-86.
Studies 26, 535-44. H M S 0, London. 127, H M S O , London.
in Scotland, 1954-77, Statist. Bull. no. A1.1.
in B U R G E R M E I E R B. and M U C H I E L L I J. (Eds) Multinationals in Europe. Routledge, London. University of Leicester (mimeo).
Department, Shefield.
analysis, Reg. Studies 25, 427-38.
the UK, 1984-91, CJrban Studies 30, 1,209-24. Frances Pinter, London.