Modeling Disease Spreading on Complex
Networks
Xiangjie Kong1, Yu Qi1, Xiumiao Song1, and Guojiang Shen2,3
1 School of Software, Dalian University of Technology, Dalian 116620, China
[email protected], [email protected], [email protected] 2 State Key Laboratory of Industrial Control Technology, Zhejiang University,
Hangzhou 310027, China [email protected]
3 Key Laboratory of System Control and Information Processing, Ministry of Education, Shanghai 200240, China
Abstract. Based on complex network approach, a contact network model with scale-free property is built. By analyzing the fact data of H1N1 influenza provided by Beijing Health Bureau, contact tracing mechanism is used to research H1N1 virus transmission dynamics with this model. Furthermore, the contact tracing coefficient and random checking coefficient are studied to analyze their impact on the peak value of new infections and cumulative number of infections. The simulation result fits well with the statistical data. It shows that the model built in this paper is valid and complex network model to simulate the epidemics of H1N1 influenza is feasible.
Keywords: complex network, disease spreading, scale-free, contact network, contact tracing.
1.
Introduction
Network widely exists in nature and human society. If a brain neuron is seen as a node in the network, the connections between neurons are the edges, which constitute a neural network. If a power station is seen as a node in the network, the power wires between power stations are edges, which constitute a power grid. If a person is seen as a node in the network, the interaction between people is an edge, which constitutes a human social network [1], [2]. There are many similar instances. With the development of research, we will find more networks in various fields.
influencing efficiency of power transmission, we can research the structure characteristics of the network to understand some characteristics of the complex system in the real world.
Based on the topology structure of complex network dynamics in the complex network approach, there are some quantitative and qualitative researches on the dynamic spread such as the spread of computer virus in the Internet, the spread of disease in the crowd, the diffusion of information in society. In traditional epidemiology, SI, SIS, SIR and other classic models have been established [3], [4], [5], [6]. S is the at-risk group, which doesn't carry virus, but is easily infected. I is the infected group with infectious feature. R is the cured individuals with immunity. These models based on differential dynamic system, have complex computations and the equation solution is very sensitive to initial conditions, which can’t be well simulated with the practical process for some unexpected and random events. However, the simulation contagion transmission based on the complex network can overcome the shortcomings.
In the past two years, the H1N1 virus has spread worldwide, influencing people's normal life. In the meantime, various strategies and effects dealing with virus spreading also cause for concern. In this paper, we establish contact network model based on the complex network theory, and adopt contact tracing mechanism to do the numerical study on the dynamic spread behaviors of H1N1 virus. We deeply analysis the effect of contact tracing coefficient, random testing coefficient in virus spreading, and reveal the importance of early detection, early isolation and early treatment in process of the disease spread.
The paper is organized as follows. In Section 2, we present the related work on complex networks. Section 3 proposes the related work on contact network model respectively. We present H1N1 propagation model in Section 4. Following that, we give and analyze the simulation result in Section 5 and Section 6 respectively. Finally, some conclusions are drawn in Section 7.
2.
Related Work
There are various research problems with the complicated real-world systems. Some complex systems can be described in the form of the networks. In 1960, Erdos and Renyi proposed ER stochastic network model [7], in which the network structure is described as a completely random graph. In stochastic network model, the connection between two nodes is determined in a certain probability. However, with further research, there are many complex networks appearing, which cannot be described by the random model.
Finally it can constitute a Small-World network. When P = 0, it is a regular network. When P = 1, it is a stochastic network. When 0 < P < 1, it is a new network with highly cluster character of the regular network and less average path length of the stochastic network. In the complex network theory, a network with the two properties is called Small-World characteristics.
In 1999, Barabasi and Albert found scale-free characteristic and put forward BA scale-free network model [9]. It has the following two characteristics: (1) growth characteristics: network scale is expanding; (2) priority connection characteristics: new nodes tend to connect the nodes with large connection degree, which is called “Matthew effect“. In scale-free networks, where node degree distribution obeys power-law [9], most of the nodes have only a few links and few nodes have a lot of links.
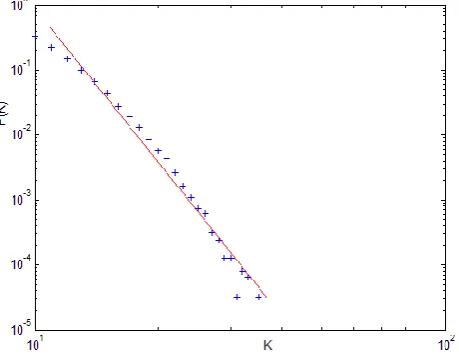
Node degree of stochastic network and Small-World network obeys Poisson distribution. The distribution is bell-shaped, and the peak value just corresponds with the average degree value of all the nodes. In both sides of peak value, distribution probability obeys exponential decline, which indicates mostly node degree distribution concentrates near average degree value. Therefore, this type of network called homogeneous network. Scale-free network’s node degree distribution has the characteristics of power-law, namelyP k( )ck. There is no peak value in the degree distribution graph. There is a descending line showing the scale-free characteristics in the bi-logarithm coordinates. Therefore, scale-free network is inhomogeneous network.
3.
Contact Network Model
Infectious diseases often transmit through interpersonal interaction. If people are seen as the nodes in the network and the interpersonal contact relation as the edges in the network, it constitutes a complex network called contact network [15], [16]. Because of the individual differences, the scope of individual communication is different. Therefore, the node degree in contact network distributes within the larger scope, rather than the uniform network having the same degree of network, whose node degree concentrates in peak value nearby. The contact network is more close to scale-free network.
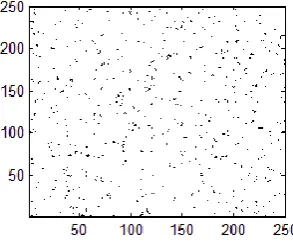
The contact network model in this paper evolves from the BA scale-free network model proposed by Barabasi and Albert. First, we construct a standard BA scale-free network based on growth mechanism and priority connection mechanism. Then, all nodes are put in the scale-free network into 2-d lattice bitmap N n n randomly, in which each node links with 8 adjacent nodes [17].
It can be proved that contact network is a scale-free network. When the number of nodes N>>8, the probability of existing edge among 8 neighboring nodes tends to zero, namelyp0. That is equivalent to in the original BA network, each node is added 8 edges. The degree of each node is changing, but it does not affect the degree distribution of the whole network. So the improved contact network degree distribution obeys power-law. As shown in Fig. 1, the degree distribution of contact network in bi-logarithm coordinates is basically a straight line with power-law features.
Fig. 1. Contact network node degree probability distribution (N 250 250 ).
individual to increase the speed of spread of the virus, more in line with the great personnel mobility features in the real social situation.
4.
H1N1 Virus Propagation Model
Influenza A H1N1 is an acute respiratory infection, whose pathogen is a new type of influenza A H1N1 influenza virus. The virus strains contain swine flu, avian flu and human influenza virus gene fragments, spreading through contacts in the crowd. Influenza A H1N1 flu was first discovered in March 2009. The "swine flu" epidemic outbreak in Mexico and quickly spread around the globe, bringing people all over the world huge economic loss.
To make the model not too complex, the following are some simplifying assumptions for the spread model of H1N1 virus:
(1).Assuming the transmission capacity of each patient is same, not considering super-spread events. This is because researches have shown that super-spread events (SSEs) which can’t be completely ignored will not change the overall trend of disease spreading.
(2).Assuming the activity of the virus is constant during the evolution, taking no account of the variability behavior of the virus, ignoring the ventilation, temperature and other factors impacting H1N1 virus activity.
(3).Assuming each individual's immunity is same, not affected by age structure, ignoring the different immune system of different individuals because the model are concerned with statistical properties of the overall performance rather than specific individuals.
(4).Assuming the incubation period for each patient obeys Poisson distribution, and the incubation period has a smaller infectious probability.
(5).Assuming the patient can’t infect other individuals with isolated protection measure.
(6).Assuming the transmission capacity of a patient is not changing during the time from infection to cure.
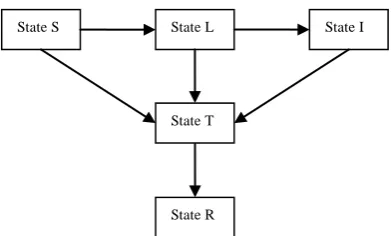
This paper adopts Contact Tracing strategy to restrain the transmission of H1N1 virus [6], [18]. Once detect an infected individual, track and isolate contacted individuals immediately. Isolated individuals no longer infect other individuals. In the H1N1 propagation model, the nodes have 5 states:
Susceptible: The individual is not infected, and has no immunity.
Latent: The individual carries virus, and shows a slight symptoms and small infectiousness.
Infected: There is an outbreak with clinical manifestation and strong infection.
Tracking: The individual is treated in isolation. Track and isolate other individuals contacted with the patient.
Removed: The individual obtains immunity or dies, and no longer affects the communication process.
infects the neighboring node S in probabilityI . The node in state of L infects the neighboring node S in probability L (I L). The nodes in the state of I and L are respectively randomly detected in probabilityI,L (I L) entering state T. Then contact and trace the adjacent nodes of the randomly detected node in probability . The node which has been traced enters the state of T. Nodes in state T will enter state R in probability .
Incubation period of H1N1 is generally 1 to 7 days [19], expectation
(
)
4
E Latent
. Poisson distribution is a commonly used discrete probability distribution, suitable for describing the number of random events in the unit time, and the expectation of Poisson distributionP( ) is. Therefore, in themodel make the latency of individual obeys Poisson distribution 4, that is
~ ( 4)
Latent P .
Fig. 2. H1N1 propagation model state transition graph.
5.
Simulation and Analysis
Table 1. Increasing H1N1 influenza confirmed cases per week in Beijing. Time
(week) Cases
Time
(week) Cases
Time
(week) Cases
Time
(week) Cases
1st 1 13th 80 25th 1063 37th 39
2nd 3 14th 82 26th 289 38th 37
3rd 4 15th 82 27th 587 39th 12
4th 11 16th 81 28th 551 40th 7
5th 28 17th 138 29th 521 41th 9
6th 34 18th 294 30th 501 42th 4
7th 44 19th 589 31th 419 43th 5
8th 84 20th 844 32th 306 44th 3
9th 56 21th 1124 33th 240 45th 4
10th 61 22th 418 34th 158 46th 0
11th 92 23th 659 35th 82 47th 1
12th 100 24th 1287 36th 53
State S State L State I
As Table.1 shows, this paper refers to H1N1 epidemic data released by Beijing Health Bureau from 2009.5.7 to 2010.4.4. We adopt the contact network model and the H1N1 virus transmission model to predict and analysis the number of new infections and the cumulative number of infections per week (Fig. 3, Fig.4).
We use optimized algorithm to simulate in the programming process based on Matlab. Optimized algorithm can greatly shorten the simulation time and improve simulation efficiency. During simulation process, the simulation algorithm was improved as follows:
Fig. 3. The number of new infections per week.
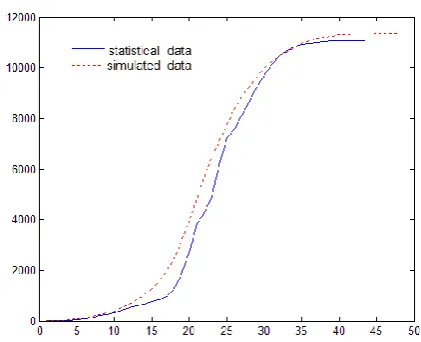
Fig. 4. The number of cumulative infections per week.
memory space and facilitate the establishment of large-scale networks. Using adjacent matrix directly will waste a lot of memory space. If adopting the sparse matrix A = sparse (N, N), when A is large, the assignment statement A(i,j)=... has slow speed of execution [20] and a large number of execution cause the entire simulation process consuming a large amount of time.
(2) When finding all the adjacent nodes of the nodeNi, we firstly sort I, and then exchange the order of J in the same order. Use binary search algorithm to find I, while the corresponding element in J is adjacent node ofNi. The find() function in Matlab uses the linear search algorithm. When the network size is large, searching efficiency is low.
(3) Store I, J in a Mat file, just loading them as being used. It doesn’t need
to re-generate network topology map in each simulation to save time.
In the simulation process, the number of established contact network nodes N=250
250, parameter values are:I 0.39, L0.15, I 0.63,0.42
L
, 0.9, 0.1. The simulation results are shown in Fig. 3 and Fig.4. During 20th to 25th week, the number of new infections per week reaches the peak value. The number of infections at both sides of the peak value obeys an exponential distribution, and the growth rate of the left side is slightly larger than the decay rate of the right side. In the early and late period, the spread rate of influenza A H1N1 flattens off (Fig. 3). During the peak-time of the spread of the disease (20th to 25th week), the simulation data and statistical data fit well. Overall, the simulation results agree well with the trend of the actual propagation of disease. The simulation data of cumulative infections number is slightly larger than statistical data, and both growth trends are almost the same (Fig. 4).
Accuracy of the simulation results can be calculated by curve’s goodness of fitting. And the squares sum of error can be used to measure the quality of the curve’s goodness of fitting. Assuming that the actual measured value is
Y, the average value is Y1, the calculated theoretical value according to the fitting curve is Y2, we can get the squares sum of error is
(YY2)2, meansquare variance is
(YY1)2, if the ratios of the squares sum of error andmean square variance are small, it means that the observed values and estimated values are close, also the curve fitting is well. According to this we can define the determination coefficientR2, which calculation formula is:
2 2 2 2 1 ( ) 1 ( ) Y Y R Y Y
per week isR20.9667. In Fig. 4, the actual statistical value is 11087, the simulation data is 11376, the number of cumulative infections’ error is
(11376 11087) /11087 0.0261 , and the simulation accuracy of the number of
cumulative infections per week isR20.9853. The high accuracy of the number of new infections and number of cumulative infections shows that the model can well describe the propagation of the virus H1N1.
6.
Parameters of Virus Propagation Model
There are many parameters impacting H1N1 virus spreading in the above H1N1 spreading model. We will analyze contact tracing coefficient and random detection coefficient L deeply to reveal their influence in speed and level of virus spreading.
6.1. Contact tracing coefficient
During simulation process, we remain the other parameters same, changing the contact tracing coefficientto get different values of the peak number of infections (showed in Fig. 5,Fig. 6,Fig. 7), from which to analyze the impact of on H1N1 virus spreading. Fig. 5 and Fig. 6 show that contact tracing coefficient has a significant impact on the peak number of infections. When is small, the peak density of infected people is large. Otherwise, peak density of infected population is small.
Fig. 6. Distribution the peak number of infected people when
=0.8.Fig. 7 further reveals the relationship between contact tracing coefficient and the peak number of infections: the peak number of infections has a logarithmic decreasing with increasing. Thus, contact tracing coefficient strongly impacts the processing of H1N1 virus spreading. When the value ofis large, most of the close contacts can be isolated in time to reduce the probability of individuals to be infected.
Fig. 7. Distribution the peak number of infected people according to different
.6.2. Random detection coefficient
high, most individuals in the incubation period can be promptly detected and isolated, which reduces the probability of people around to be infected. Therefore, it will slow the rate of virus spreading and reduce the scope of the virus spreading, thus the number of cumulative infections will be reduced.
It is obvious that random detection coefficient corresponds to testing strength of test stations, and contact tracing coefficient corresponds to tracing strength of closing contact individuals in the actual situation. Therefore, when facing the widespread of virus, we should strengthen the efforts of the detection of vulnerable populations, increase the strength of tracing close contacts, and reach the target of early discovery, early isolation and early treatment. This can effectively inhibit the spread of the virus, slow down the rate of virus spreading, and reduce the virus’ impacted area.
Fig. 8 The number of cumulative infections according to differentL.
7.
Conclusions
In this paper, we use the dynamics of complex networks approach to study virus spreading. We build scale-free network model (contact network) and H1N1 virus propagation model according to the actual situation of the virus propagation in order to simulate the spread of the H1N1 virus in Beijing. Then we deeply analyze how contact tracing coefficient and random detection coefficient impact virus spreading, revealing the importance of early discovery, early isolation and early treatment during treatment in the disease spreading process based on the virus spreading model. Simulation results are similar with the actual spread trend of the virus in Beijing, which verify the validity of the model, proving that complex networks as an important tool will play a major role on study of disease spreading.
Foundation of China under grant Y1090208 and the Foundation of Key Laboratory of System Control and Information Processing, Ministry of Education, P.R. China under grant SCIP2011007.
References
1. Albert, R., Barabási, A.: Statistical Mechanics of Complex Networks. Rev. Modern Phys. (S0034-6861), Vol. 74, No. 1, 47-97. (2002)
2. Newman, M. J.: The Structure and Function of Complex Network. SIAM Review (S0036-1445), Vol. 45, No. 2, 167-256. (2003)
3. Breban, R., Vardavas, R., Blower, S.: Linking population-level models with growing networks: A class of epidemic models. Phys. Rev. E, 72, 046110. (2005) 4. Trpevski, D., Tang, W. K. S., Kocarev, L.: Model for rumor spreading over
networks. Phys. Rev. E, 81, 056102. (2010)
5. Kenah, E., Robins, J. M.: Second look at the spread of epidemics on networks. Phys. Rev. E, 76, 036113. (2007)
6. Keeling, M. J., Eames, K. T. D.: Networks and epidemic models. J.R.Soc. Interface, 2:295-307. (2005)
7. Erdos, P., Renyi, A.: On the Evolution of Random Graphs. Publ. Math. Inst. Hung. Acad. Sci, 5:17-60. (1960)
8. Watts, D., Strogatz, S.: Collective Dynamics of “Small World” Networks. Nature (S0028-0836), 393(4): 440-442. (1998)
9. Barabási, A., Albert, R.: Emergence of Scaling in Random Networks. Science (S0036-8075), 286(5439): 509-512. (1999)
10. Newman, M. E. J., Watts, D. J.: Scaling and Percolation in the Small-World Network Model. Phys.Rev.E, Vol. 60, No. 6,7332-7342. (1999)
11. Pastor-Satorras, R., Vespignani, A.: Epidemic Spreading in Scale-Free Networks. Phys. Rev. Lett. (S0031-9007), Vol. 86, No. 14, 3200- 3203. (2001) 12. Moreno, Y., Pastor-Satorras, R., Vespignani, A.: Epidemic Outbreaks in
Complex Heterogeneous Networks. Eur. Phys. J. B. Vol. 26, No. 4, 52l-529. (2002)
13. Lin, G., Jia, X., Ou, Y.: Predict SARS infection with the small world network model. Journal of Peking University (Health Sciences), 35 Supplement:66-69. (2003)
14. Yang, H., Zhang, S.:Viruses Epidemics of Avian Influenza Based on Complex Networks. Journal of System Simulation, Vol. 20, No. 18, 5001 - 5005. (2008) 15. Yang, R., Zhou, T., Xie, Y., Lai, Y., Wang, B.: Optimal contact process on
complex networks. Phys. Rev. E, 78, 066109. (2008)
16. Yang, H., Zhao, F., Li, Z., Hu, B.: Modeling SARS Spreading on Complex Networks, Phys. B, Vol. 18, No. 6, 2734-2739. (2004)
17. Yu, L., Xue, H.: Epidemic Spread Model Based On Complex Networks. Journal of Shanxi University of Science & Technology, Vol. 25, No. 3,126-129. (2007) 18. Huerta, R., Tsimring, L. S.: Contact tracing and epidemics control in social
networks. Phys. Rev. E, Vol. 66, No. 4, 056115. (2002)
19. http://www.moh.gov.cn/publicfiles/business/htmlfiles/mohwsyjbgs/s9990/200910/ 43111.htm
Xiangjie Kong received his Ph.D. degree from Zhejiang University, Hangzhou, China in 2009. Currently, he is an assistant professor in Dalian University of technology, Dalian, China. His current research interests include urban road traffic modeling and control technology, cyber physical systems and complex networks.
Yu Qi received the B.Sc. degree in software engineering in 2010 from Dalian University of technology, Dalian, China, where she is currently working toward the M. Sc. degree in the School of Software. Her current research interests include urban road traffic modeling and control technology, artificial intelligence, and complex networks.
Xiumiao Song received the B.Sc. degree in software engineering in 2011 from Dalian University of technology, Dalian, China, where she is currently working toward the M. Sc. degree in the School of Software. Her current research interests include artificial intelligence and complex networks.
Guojiang Shen received his Ph.D. degree from Zhejiang University, Hangzhou, China in 2004. Currently, he is an associate professor in Zhejiang University, Hangzhou, China. His current research interests include intelligent control theory and application, advanced control technology and application, urban road traffic modeling and control technology.