International Journal of Health Sciences and Research
www.ijhsr.org ISSN: 2249-9571
Original Research Article
The Progressive Effect of Sport Drinks on the Color Change and the
Surface Properties of Different Types of Resin Composite
Dr. Ihab Moussa
Associate Professor, Biomaterials Division, Restorative Dental Sciences (RDS), Faculty of Dentistry, King Saud University, KSA
ABSTRACT
Objectives: The aim of this study is to evaluate the color changes and surface roughness (Ra) of different types of resin composite after their immersion in different sport drink types for 7days, 1 month, 3 months as well as 6 months.
Materials and methods: Sixty disk-shaped specimens (diameter: 10 mm, and thickness: 2 mm) were made from four different resin composites (Filtek Z250, Vertis Flow and Spectrum). Each specimen was cured under mylar strips for 20 sec for both top and bottom surfaces. All of the specimens were stored in distilled water for 24 h at 37˚C. Color measurements of each specimen were performed with Color Eye system. All the measurements were performed at baseline and at 7days, one month, 3 months and 6 months of immersion in the selected sport energy drinks (Code Red, Red Bull and Bison). Another Thirty six disc-shaped specimens with the same dimensions were prepared for surface roughness (Ra) determination using a noncontact 3D-optical-profilometer. Baseline and after immersion in the different sport energy drinks for 6 months were determined. Surface topography (Ra) and color changes (DE values) of the groups were recorded and statistically analyzed.
Results: Variations in the composition of different sport drinks media did not affect the color changes of resin composite groups tested. When comparing the effect of the immersion media on the different types of resin composite, E showed; from 1 to 7 days immersion Spectrum and Vertise Flow showed higher changes in color than Filtek Z250. From 7 days to 1 month Vertise Flow showed the highest changes in color followed by the Spectrum while Filtek Z250 showed the lowest color changes. From 1 to 3 months constant color were maintained for all the rein composite tested groups. From 3 to 6 months of immersion Filtek Z250 and Spectrum showed higher changes in color than Vertise Flow. The effect of time showed that the color changes of all resin composite groups tested are directly proportional to the increase in time. Surface roughness (Ra) showed insignificant difference between the groups except for the Spectrum when immersed in code red the Ra increased.
Conclusion: 1. All resin composite tested showed color changes when immersed in sport drinks solutions. 2. The color changes is directly proportional to the time of immersion of resin composite. 3.Vertise Flow showed the least color changes by time followed by the Filtek Z250 while the Spectrum showed the highest color changes. 4. The higher the amount of urethane dimethacrylate in the composition of resin composite the higher is the color changes and the surface roughness of the material.
Keywords:Color change, surface roughness, sport drinks, composite resins.
1. INTRODUCTION
For aesthetic demands composite materials have been used in dental practices to restore teeth since introduced a composite to the dental market in 1964. Resin
wear, color changes, and lack of bonding to tooth surfaces were some of the issues associated with these early materials specially with the fluctuation of pH and temperature inside the oral cavity. [2] Different modifications were done for the composition of resin composite materials in order to improve their properties, among these modifications the change in the polymerization strategies of these materials. The resin phase of composite materials presently represents the area through which the greatest changes in composite practice may be achieved. The low methacrylate conversion leads to significant amounts of unreacted monomer that may be leached from the restoration over time, resulting in
concerns regarding long-term
biocompatibility and color stability. High methacrylate conversion also limits the ability to incorporate high filler volumes into the resin. To achieve low volume shrinkage, high mechanical properties and color stability, filler contents of 60 to 87 weight% are necessary to decrease the amount of organic resin used. [3] Although modern resins have many advantages over other aesthetics materials used until now, they are still short from providing optimal color appearance due to intrinsic and extrinsic factors. [4] Impregnation from food and beverage pigments is considered the main extrinsic pigmentation factor. [5]
Discoloration of composite resins can be caused by internal or external factors. Internally induced discolorations are permanent and are related to polymer quality, filler type, and amount, as well as the synergist added to the photoinitiator system. In light-cured composite resins, if curing is inadequate, unconverted camphorquinone will cause a yellowish discoloration. Furthermore, other components of the photoinitiator system namely tertiary aromatic or aliphatic amines tend to cause yellow or brown discoloration under the influence of light or heat. The resin's affinity for extrinsic stains is modulated by its conversion rate and physicochemical characteristics, with the
water sorption rate being of particular importance. In the oral cavity, because of superficial degradation or a slight penetration and adsorption of staining agents at the superficial layer of the composite resins, discoloration of the surface or subsurface of the resin restorations can result. Moreover, externally induced discoloration can be related to surface roughness, surface integrity, and the polishing technique. [6]
During the last few years the consumption of sport drinks and diet beverage has increased among adolescents. [7]
Sports drinks were created in 1965 in the United States as dietary supplements for athletes in an effort to address certain sports-related physiological and nutritional issues. [8] These beverages were designed for individuals needing replenishment of water as well as carbohydrates and electrolytes lost or utilized during prolonged vigorous physical activity, including activities performed in high temperatures and humidity. Sports drinks typically contain water, electrolytes (primarily sodium and potassium), coloring agents and carbohydrates. [9] Carbohydrate options found in a number of popular sports drinks include high fructose corn syrup, fructose, sucrose, sucrose syrup, brown rice syrup, cane juice, and maltodextrin. [10] Sports drinks also are being consumed by non-athletes those who are looking for a different kind of beverage. [11] None identified the exercise related rehydrating properties as the reason for the consumption of these beverages. [12]
The aim of this study is to evaluate the color changes and surface roughness of different types of resin composite when immersed in some common sport drinks for 7days, 1 month, 3 months and 6 months.
2. MATERIALS AND METHODS Materials
Paul, MN, USA), Vertise Flow (Kerr, Scalfati (SA), Italy) and Spectrum (Dentsply DeTrey GmbH, Germany) in the A3 shade. Together with three immersion media which are; Bison (AbulJadyel Brugace Inc. Saudi Arabia), Red Bull (Red Bull GmbH, Am Brunnen, Austria), or Code Red (Alssayl Beverage Corporation. Saudi Arabia) that are the most sport drinks used nowadays.
Methods:
Twenty disc-shaped specimens, 10 mm in diameter and 2-mmthick, were prepared for each composite resin (a total of 60 specimens) using a customized cylindrical metal mold. No power analysis was used to determine the sample size. The author based the sample size on the investigation of Kakaboura A et al., in which five specimens were fabricated for each combination of composite resin and experimental condition. After pouring a composite material into the mold, a polyester strip (Mylar strip; SS White Co., Philadelphia, PA, USA) was pressed onto the mold surface with a glass plate to obtain a flat surface without bubble formation. The composite material was polymerized from both the top and bottom sides for 20 s, according to the manufacturer’s recommendations, using a LED light curing unit (Elipar S10, 3MESPE, Seefeld, Germany). operating in standard mode and emitting not less than 600 mW/cm2, as measured with a light-meter that was placed on the curing unit before beginning polymerization. The guide of the light curing unit was placed perpendicular to the specimen surface, and the distance between the light source and specimen was standardized using a 1-mm glass slide. Afterward, all the specimens were stored in distilled water for 24 h at 37 0C to ensure complete polymerization. The top surfaces of all the specimens were then sequentially polished with medium, fine, and super-fine aluminium oxide-impregnated disks (Sof-Lex; 3 M ESPE, St. Paul, MN, USA) using a slow-speed hand piece under dry conditions for 30 s. After each polishing
step, the specimens were thoroughly rinsed with water for 10 s to remove debris, air dried for 5 s, and then polished with another disc of lower grit for the same period of time as a final polishing.
2.2.1. Immersion of specimens in solutions
To evaluate the color stability in different solutions, 20 specimens from each group were subdivided into three subgroups of five specimens each, which were immersed in three different solutions (Bison, Red Bull, and Code Red). The specimens of each composite resin were individually immersed (n = 5) in vials containing 5 mL of Bison (AbulJadyel Brugace Inc. Saudi Arabia), Red Bull (Red Bull GmbH, Am Brunnen, Austria), or Code Red (Alssayl Beverage Corporation. Saudi Arabia) for 10 min a day at room temperature. After this daily 10-min immersion in the sports drink, the samples were washed with distilled water and then stored in distilled water at 37 0C. The vials were sealed to prevent the evaporation of the solutions. The solutions were renewed daily, and daily pH value measurements were taken using a pH metre (HI 221; Hanna Instruments Inc. Woonsocket, RI, USA) before immersing the specimens.
2.2.2. Assessment of color changes
supplied white calibration standard. The spectrophotometer was used to automatically calculate the mean color of the specimens of each material. The CIE L*a*b* color system is a three-dimensional color measurement system, where L* refers to the lightness coordinate, which has a value ranging from 0 for perfect black to 100 for perfect white, and a* and b* are the chromaticity coordinates on the green–red (_a* = green; +a* = red) and blue–yellow (_b* = blue; +b* = yellow) axes, respectively. All the color measurements were obtained by one operator. The color measurements were performed at the baseline and then after 1-week, 1 month, 3 months and 6-months periods. All the specimens were wiped dry using tissue paper and then placed in the viewing port of the spectrophotometer. The L*, a*, and b* values of each specimen after immersion for the specified time period (1week, 1 month, 3months and 6 months) were measured thrice by placing each specimen on the measuring head and covering it with the black cover. The mean values of ∆L*, ∆a*, and ∆b* after three measurements were automatically calculated by the spectrophotometer and recorded. The color difference, ∆E, was calculated from the mean ∆L*, ∆a*, and ∆b* values for each specimen using the following formula: ∆ E = [(∆L*)2
+ (∆a*)2 + (∆b*)2]1/2
where ∆L*, ∆a*, and ∆b* are the differences in the L*, a*, and b* values, respectively, before and after immersion for each time period.
2.2.3. Surface roughness measurement: Thirty six samples are made of the three composite resins used (Z250, Vertise Flow and Spectrum). Each group of samples (n=12) are marked to be placed in the three sport drinks (Code Red, Red Ball and Bison) 4 samples each. The specimens of each composite resin were individually immersed (n = 4) in vials containing 5 mL of Bison, Red Bull, or Code Red for 10 min a day at room temperature. After this daily 10-min immersion in the sports drink, the
samples were washed with distilled water and then stored in distilled water at 37 0C till the time of immersion like done with the color changes specimens till 6 months.
Surface roughness analysis of each composite was assessed quantitatively by a noncontact optical profilometry (Novacam Technologies Inc.277 Lakeshore Road, Suite #04 Pointe Claire, Quebec, H9S4L2 CANADA). Each surface was scanned by eleven parallel tracings (length = 1mm) per area of 1mm× 1mm. One area per specimen was analyzed for the samples without any polishing treatment, whereas two areas were analyzed for the polished surfaces. Measurement areas were chosen randomly, excluding a surface of 1mm from the edge, which was not representative of the polishing. The average surface roughness (Ra) of each specimen was calculated with a cut-off value of 0.08mm. One representative zone of 0.3mm× 0.3mm of each composite and of each surface treatment (matrix, Sof-Lex, CompoSystem) was scanned by 151 parallel tracings to give a 3D reconstructed image.
2.2.4. Statistical analysis
with IBM® SPSS® Statistics Version 20 for Windows.
3. RESULTS
3.1. Color changes (ΔE):
Descriptive statistics of ΔE are presented in Table (2).
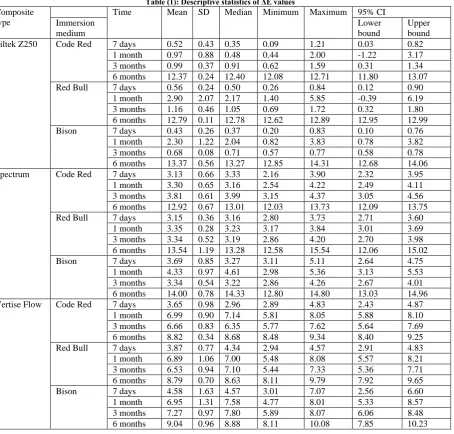
Table (1): Descriptive statistics of ΔE values Composite
type
Time Mean SD Median Minimum Maximum 95% CI
Immersion medium
Lower bound
Upper bound
Filtek Z250 Code Red 7 days 0.52 0.43 0.35 0.09 1.21 0.03 0.82
1 month 0.97 0.88 0.48 0.44 2.00 -1.22 3.17
3 months 0.99 0.37 0.91 0.62 1.59 0.31 1.34
6 months 12.37 0.24 12.40 12.08 12.71 11.80 13.07
Red Bull 7 days 0.56 0.24 0.50 0.26 0.84 0.12 0.90
1 month 2.90 2.07 2.17 1.40 5.85 -0.39 6.19
3 months 1.16 0.46 1.05 0.69 1.72 0.32 1.80
6 months 12.79 0.11 12.78 12.62 12.89 12.95 12.99
Bison 7 days 0.43 0.26 0.37 0.20 0.83 0.10 0.76
1 month 2.30 1.22 2.04 0.82 3.83 0.78 3.82
3 months 0.68 0.08 0.71 0.57 0.77 0.58 0.78
6 months 13.37 0.56 13.27 12.85 14.31 12.68 14.06
Spectrum Code Red 7 days 3.13 0.66 3.33 2.16 3.90 2.32 3.95
1 month 3.30 0.65 3.16 2.54 4.22 2.49 4.11
3 months 3.81 0.61 3.99 3.15 4.37 3.05 4.56
6 months 12.92 0.67 13.01 12.03 13.73 12.09 13.75
Red Bull 7 days 3.15 0.36 3.16 2.80 3.73 2.71 3.60
1 month 3.35 0.28 3.23 3.17 3.84 3.01 3.69
3 months 3.34 0.52 3.19 2.86 4.20 2.70 3.98
6 months 13.54 1.19 13.28 12.58 15.54 12.06 15.02
Bison 7 days 3.69 0.85 3.27 3.11 5.11 2.64 4.75
1 month 4.33 0.97 4.61 2.98 5.36 3.13 5.53
3 months 3.34 0.54 3.22 2.86 4.26 2.67 4.01
6 months 14.00 0.78 14.33 12.80 14.80 13.03 14.96
Vertise Flow Code Red 7 days 3.65 0.98 2.96 2.89 4.83 2.43 4.87
1 month 6.99 0.90 7.14 5.81 8.05 5.88 8.10
3 months 6.66 0.83 6.35 5.77 7.62 5.64 7.69
6 months 8.82 0.34 8.68 8.48 9.34 8.40 9.25
Red Bull 7 days 3.87 0.77 4.34 2.94 4.57 2.91 4.83
1 month 6.89 1.06 7.00 5.48 8.08 5.57 8.21
3 months 6.53 0.94 7.10 5.44 7.33 5.36 7.71
6 months 8.79 0.70 8.63 8.11 9.79 7.92 9.65
Bison 7 days 4.58 1.63 4.57 3.01 7.07 2.56 6.60
1 month 6.95 1.31 7.58 4.77 8.01 5.33 8.57
3 months 7.27 0.97 7.80 5.89 8.07 6.06 8.48
6 months 9.04 0.96 8.88 8.11 10.08 7.85 10.23
3.1.1. Comparison between immersion media (Table 2)
With Filtek Z250, there was no statistically significant difference between mean ΔE after immersion in different media for 7 days, 1, 3 as well as 6 months (P-value = 0.677, 0.214, 0.080 and 0.054, respectively). Also with Spectrum, there was no statistically significant difference
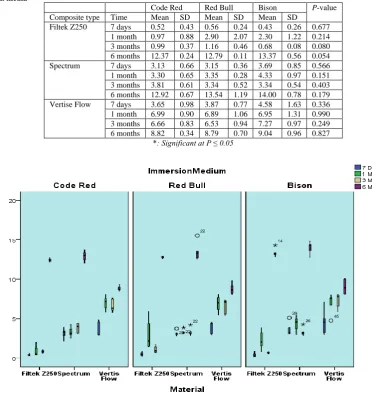
Table (2): The mean, standard deviation (SD) values and results of Kruskal-Wallis test for comparison between ΔE of the three immersion media
Code Red Red Bull Bison P-value Composite type Time Mean SD Mean SD Mean SD
Filtek Z250 7 days 0.52 0.43 0.56 0.24 0.43 0.26 0.677 1 month 0.97 0.88 2.90 2.07 2.30 1.22 0.214 3 months 0.99 0.37 1.16 0.46 0.68 0.08 0.080 6 months 12.37 0.24 12.79 0.11 13.37 0.56 0.054 Spectrum 7 days 3.13 0.66 3.15 0.36 3.69 0.85 0.566 1 month 3.30 0.65 3.35 0.28 4.33 0.97 0.151 3 months 3.81 0.61 3.34 0.52 3.34 0.54 0.403 6 months 12.92 0.67 13.54 1.19 14.00 0.78 0.179 Vertise Flow 7 days 3.65 0.98 3.87 0.77 4.58 1.63 0.336 1 month 6.99 0.90 6.89 1.06 6.95 1.31 0.990 3 months 6.66 0.83 6.53 0.94 7.27 0.97 0.249 6 months 8.82 0.34 8.79 0.70 9.04 0.96 0.827
*: Significant at P ≤ 0.05
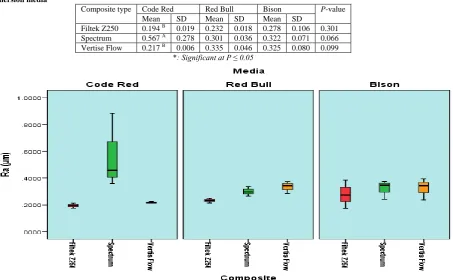
Figure (1). Box plot representing color change (ΔE) of different composite types with each immersion medium (Circles and stars indicates outliers)
3.1.2. Comparison between resins composite types (Table 3)
After immersion in Code Red for 7 days; there was a statistically significant difference between composite types (P -value <0.001). Pair-wise comparisons between composite types revealed that there was no statistically significant difference between Spectrum and Vertise Flow; both showed the statistically significantly highest mean ΔE values. Filtek Z250 showed statistically significantly lower mean ΔE. After immersion in Code Red for 1 month as well as 3 months; there was a statistically significant difference between composite types (P-value <0.001 and <0.001, respectively). Pair-wise comparisons between composite types revealed that
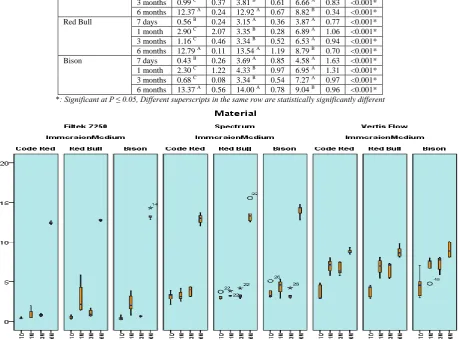
Table (3): The mean, standard deviation (SD) values and results of Kruskal-Wallis and Mann-Whitney U test for comparison between ΔE of the three composite types
Filtek Z250 Spectrum Vertise Flow P-value Immersion medium Time Mean SD Mean SD Mean SD
Code Red 7 days 0.52 B 0.43 3.13 A 0.66 3.65 A 0.98 <0.001* 1 month 0.97 C 0.88 3.30 B 0.65 6.99 A 0.90 <0.001* 3 months 0.99 C 0.37 3.81 B 0.61 6.66 A 0.83 <0.001* 6 months 12.37 A 0.24 12.92 A 0.67 8.82 B 0.34 <0.001* Red Bull 7 days 0.56 B 0.24 3.15 A 0.36 3.87 A 0.77 <0.001* 1 month 2.90 C 2.07 3.35 B 0.28 6.89 A 1.06 <0.001* 3 months 1.16 C 0.46 3.34 B 0.52 6.53 A 0.94 <0.001* 6 months 12.79 A 0.11 13.54 A 1.19 8.79 B 0.70 <0.001* Bison 7 days 0.43 B 0.26 3.69 A 0.85 4.58 A 1.63 <0.001* 1 month 2.30 C 1.22 4.33 B 0.97 6.95 A 1.31 <0.001* 3 months 0.68 C 0.08 3.34 B 0.54 7.27 A 0.97 <0.001* 6 months 13.37 A 0.56 14.00 A 0.78 9.04 B 0.96 <0.001* *: Significant at P ≤ 0.05, Different superscripts in the same row are statistically significantly different
Figure (2). Box plot representing color change (ΔE) at different time periods with each composite types and immersion medium (Circles and stars indicates outliers)
3.1.3. Comparison between immersion times (Table 4)
After immersion of Filtek Z250 in Code Red, there was a statistically significant change in mean ΔE by time (P -value = 0.007). Pair-wise comparisons between time periods revealed that there was no statistically significant change in mean ΔE from 7 days to 1 month as well as from 1 month to 3 months. From 3 months to 6 months, there was a statistically significant increase in mean ΔE. After immersion of Filtek Z250 in Red Bull as well as Bison, there was a statistically significant change in mean ΔE by time (P -value = 0.007 and 0.007, respectively). Pair-wise comparisons between time periods revealed that there was a statistically significant increase in mean ΔE from 7 days
respectively). Pair-wise comparisons between time periods revealed that there was a statistically significant increase in mean ΔE from 7 days to 1 month. From 1
month to 3 months, there was no statistically significant change in mean ΔE. From 3 months to 6 months, there was a statistically significant increase in mean ΔE.
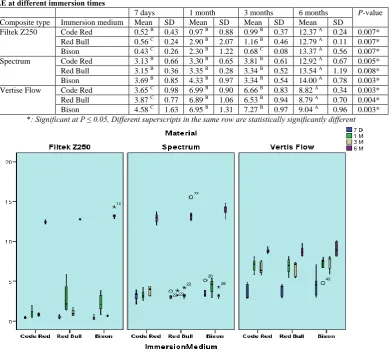
Table (4): The mean, standard deviation (SD) values and results of Friedman's test and Wilcoxon signed-rank test for comparison between ΔE at different immersion times
7 days 1 month 3 months 6 months P-value Composite type Immersion medium Mean SD Mean SD Mean SD Mean SD
Filtek Z250 Code Red 0.52 B 0.43 0.97 B 0.88 0.99 B 0.37 12.37 A 0.24 0.007* Red Bull 0.56 C 0.24 2.90 B 2.07 1.16 B 0.46 12.79 A 0.11 0.007* Bison 0.43 C 0.26 2.30 B 1.22 0.68 C 0.08 13.37 A 0.56 0.007* Spectrum Code Red 3.13 B 0.66 3.30 B 0.65 3.81 B 0.61 12.92 A 0.67 0.005* Red Bull 3.15 B 0.36 3.35 B 0.28 3.34 B 0.52 13.54 A 1.19 0.008* Bison 3.69 B 0.85 4.33 B 0.97 3.34 B 0.54 14.00 A 0.78 0.003* Vertise Flow Code Red 3.65 C 0.98 6.99 B 0.90 6.66 B 0.83 8.82 A 0.34 0.003* Red Bull 3.87 C 0.77 6.89 B 1.06 6.53 B 0.94 8.79 A 0.70 0.004* Bison 4.58 C 1.63 6.95 B 1.31 7.27 B 0.97 9.04 A 0.96 0.003* *: Significant at P ≤ 0.05, Different superscripts in the same row are statistically significantly different
Figure (3). Box plot representing color change (ΔE) of different immersion media with each composite type (Circles and stars indicates outliers)
3.2. Surface roughness (Ra) Table (5): Descriptive statistics of Ra values (µm)
Composite type Immersion medium Mean SD Median Minimum Maximum 95% CI
Lower bound Upper bound Filtek Z250 Code Red 0.194 0.019 0.195 0.175 0.213 0.147 0.242
Red Bull 0.232 0.018 0.234 0.214 0.249 0.189 0.276 Bison 0.278 0.106 0.274 0.174 0.385 0.015 0.540 Spectrum Code Red 0.567 0.278 0.458 0.359 0.883 -0.125 1.258 Red Bull 0.301 0.036 0.297 0.267 0.338 0.212 0.389 Bison 0.322 0.071 0.347 0.242 0.376 0.147 0.497 Vertise Flow Code Red 0.217 0.006 0.215 0.212 0.224 0.201 0.233 Red Bull 0.335 0.046 0.344 0.285 0.375 0.221 0.448 Bison 0.325 0.080 0.344 0.238 0.394 0.127 0.523
3.2.1. Comparison between composite types (Table 6)
After immersion in Code Red, there was a statistically significant difference between composite types (P-value = 0.039). Pair-wise comparisons revealed that Spectrum
was no statistically significant difference between composite types (P-value = 0.051
and 0.875, respectively).
Table (6): The mean, standard deviation (SD) values and results of Kruskal-Wallis and Mann-Whitney U tests for comparison between Ra (µm) of the three composite types
Immersion medium Filtek Z250 Spectrum Vertise Flow P-value Mean SD Mean SD Mean SD
Code Red 0.194 B 0.019 0.567 A 0.278 0.217 B 0.006 0.039* Red Bull 0.232 0.018 0.301 0.036 0.335 0.046 0.051 Bison 0.278 0.106 0.322 0.071 0.325 0.080 0.875 *: Significant at P ≤ 0.05, Different superscripts in the same row are statistically significantly different
Figure (4). Box plot representing surface roughness of different immersion media with each composite type
3.2.2. Comparison between immersion media (Table 7)
Either with Filtek Z250, Spectrum or Vertise Flow, there was no statistically significant difference between mean Ra values after immersion in different solutions (P-value = 0.301, 0.066 and 0.099, respectively).
Table (7): The mean, standard deviation (SD) values and results of Kruskal-Wallis test for comparison between Ra (µm) of the three immersion media
Composite type Code Red Red Bull Bison P-value Mean SD Mean SD Mean SD
Filtek Z250 0.194 B 0.019 0.232 0.018 0.278 0.106 0.301 Spectrum 0.567 A 0.278 0.301 0.036 0.322 0.071 0.066 Vertise Flow 0.217 B 0.006 0.335 0.046 0.325 0.080 0.099
*: Significant at P ≤ 0.05
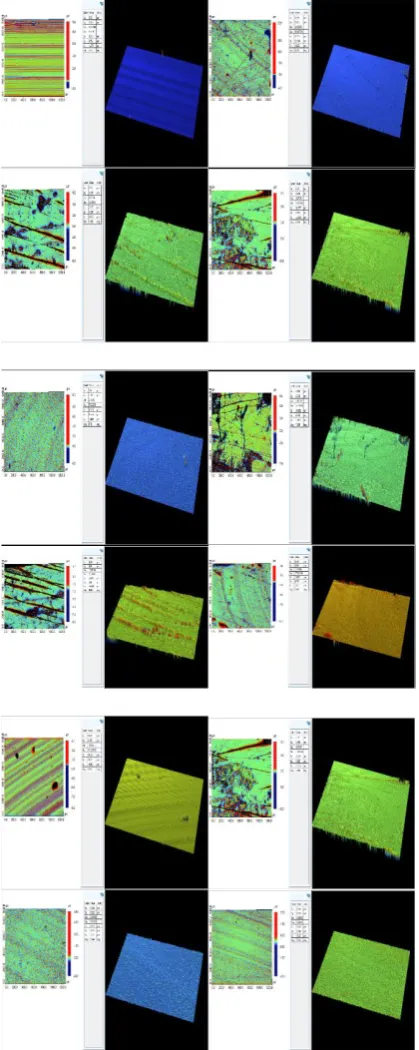
Figure (6): Surface roughness of different composites a) Filtek Z250, b) Spectrum and c) Vertis Flow stored at the different storage media (Code Red, Red Bull and Bison)
4. DISCUSSION
Color perception is a psychological issue and is affected by the observer's skill and may be reported differently on different occasions. To overcome such errors, color evaluating devices were employed and the data were recorded in the CIE L*a*b* system, this system records small color changes and has advantages as repeatability,
sensitivity and objectivity. [4] The CIE system uses three-dimensional colorimetric measurements: L* values correspond to the brightness of the color, a* values to the red– green content, and b* values to the yellow– blue content. The color changes (ΔE) are calculated from the L*, a*, and b* values for each specimen, according to the following formula, which determines the three-dimensional color space: ΔElab* = [(ΔL*)2 + (Δa*)2 + (Δb*)2]1/2
, while luminosity values (L*) were reached using ΔL* = L* (tx)–L*(t0), where (tx) represents immersion time and (t0) the baseline. [13] A perceptible color changes that is ΔE* > 1.0 will be referred to as acceptable up to the value ΔE* = 3.7, in subjective visual determinations made in vitro under optimal lighting conditions. [14]
It has been revealed that water sorption of different beverages as well as the strength of filler resin interface are the contributing factors to composite color stability. Also, the soaking time is of great importance, as it affects the composite color stability as well. [15] These factors hydrolyze the silane coupling agent at the interface between the organic matrix and the inorganic fillers creating progressive microcracks by time. As a result, the microcracks allow stain penetration and discoloration. [16]
these components and higher amount of TEGDMA.
The DC or degree of polymerization of the aliphatic C=C is an important factor because it affects the physical and mechanical properties of resin materials such as hardness, tensile strength, compressive strength, dissolution (solubility), degradation and biocompatibility. [18] The conversion of monomers is determined by the percentage of the remaining methacrylate groups after curing, when compared to the quantity present in the uncured material. [19] Studies show that monomer leaching from resins can occur at two time points: during the resin setting period and when the resin is degraded. Monomer leaching at the first time point is related to the degree of conversion. [20]
Correlating the DC % values and the viscosity of the materials investigated by De Araujo LOF et al 2015, [21] the highest DC mean values were found in the low viscosity samples, suggesting a relationship between the DC and viscosity of materials. The filler content and the viscosity of resins may interfere in the monomer conversion, because they can limit the mobility of monomers and propagation of the polymerization reaction. The lower viscosity of resins allows better monomeric mobility and distribution of free radicals inside the material, which can enhance the polymerization process leading to a greater monomer conversion. Because of this principle, low viscosity composites may allow enhanced diffusion of reactive groups and promote the curing reaction, resulting in a higher DC. This explains the changes in color when the time of immersion is increasing for the three types of resin composite tested specially for the Vertise Flow which showed higher color changes more than the other two resin composite tested for the first two periods (from 1 to 7 days and from 7 days to 1 months), while the least color changes after 6 months of immersion.
The three types of resin composite while immersed in the sport drinks showed a constant changes in color during the stage from 1 to 3 months this may be related to lack of acidic carbonate present in the beverages, as acidic carbonate is the main reason for the progressive dental erosion. [22]
Surface roughness results for Filtek Z250 and Vertise Flow showed insignificant differences before and after immersion of the specimens in different sport beverage drinks, this may be due to the finishing of the specimens using the Soft-Lex system, which has a high filler surface and is less susceptible to chemical degradation. [23] Spectrum after the immersion in code red showed surface roughness as it possesses the largest fillers size. This result is in accordance with other studies, they suggested that the filler particle size affects the surface roughness. The larger the filler particle size, the rougher would be the resin composite surface. Also this may be due to the excessive presence of urethane dimethacrylate in its organic matrix. [24]
5. CONCLUSION
All resin composite tested showed color changes when immersed in sport drinks solutions.
The color changes is directly proportional to the time of immersion of resin composite. Vertise Flow showed the least color changes by time followed by the Filtek Z250 while the Spectrum showed the highest color changes.
The higher the amount of urethane dimethacrylate in the composition of resin composite the higher is the color changes and the surface roughness of the material.
ACKNOWLEDGMENTS
Conflict of interest
The authors have no conflict of interest to declare.
6. REFERENCES
1. Craig R.G. & Powers J.M.: Restorative dental materials. 11th Ed Mosby, Inc St Louis USA. p 233, 2002.
2. Filtek Z250 Technical product profile. 3M ESPE.
3. Cramer NB, Stansbury JW, Bowman CN. Recent advances and developments in composite dental restorative materials. J Dent Res. 2011; 90:402-16.
4. Gupta, R.; Parkash, H.; Shah, N.; Jain, V.. A spectrophotometric evaluation of color changes of various tooth colored veneering materials after exposure to commonly consumed beverages. J Indian Prosthodont Soc, 2005; 5: 72-8.
5. Asmussen, E.. Factors a ecting the color stability of restorative resins. Acta Odontol Scand, 1983;41: 8-11. 6. Gaintantzopoulou M, Kakaboura A,
Vougiouklakis G. Colour stability of tooth-coloured restorative materials. Eur J Prosthodont Restor Dent. 2005;13:51–6.
7. Putnam JJ, Allshouse JE. Food consump- tion, prices, and
expenditures: 1970-1995.
Washington, DC: Food and Consumer Economics Division, Economic Research Service, U.S. Department of Agriculture; August 1997:Statistical Bull. No. 939. 8. Burke LM, Read RS. Dietary
supplements in sport. Sports Med. 1993;15:43–65.
9. Snell PG, Ward R, Kandaswami C, Stohs SJ. Comparative effects of selected non-caffeinated rehydration sports drinks on short-term performance following moderate dehydration. J Int Soc Sports Nutr. 2010;7:28.
10.Manore MM, Meyer NL, Thompson J. Sport Nutrition for Health and Performance. 2nd ed. Champaign, IL: Human Kinetics; 2009.
11.O’Dea JA. Consumption of nutritional supplements among adolescents: Usage and perceived bene ts. Health Educ Res. 2003;18:98.
12.Rouan R. Working out a new strategy–Sports drinks target serious athletes to rehydrate sales. Beverage Industry. 2010;101:18–21.
13.Wyszecki G, Stiles WS, Wyszecki GN. Color science: concepts and methods, quantitative data and formulae. 2nd ed. New York: John Wiley; p. 166-9, 1982.
14.Domingos PA, Garcia PP, Oliveira AL, Palma-Dibb RG. Composite resin color stability: Influence of light sources and immersion media. J Appl Oral Sci. 2011;19:204–11. 15.Yannikakis SA, Zissis AJ, Polyzois
GL, Caroni C. Color stability of provisional resin restorative materials. J Prosthet Dent. 1998;80:533–9.
16.Ertaş E, Güler AU, Yücel AC, Köprülü H, Güler E. Color stability of resin composites after immersion in different drinks. Dent Mater J. 2006 Jun; 25:371-6.
17.Campos, E. A.; Pizzocolo, L. N.; Lutti, R. N.; Porto-Neto, S. T.; Andrade, M.F. 1999. Influência de corantes sobre a translucidez de resinas compostas. Revista Ciências Odontológicas, 2: 12-18.
18.Sangwoo K and Jyongsik J. The measurement of degree of conversion for BIS-GMA/silica composites by FT-IR spec- troscopy. Polym Test. 1996;9418:559–71. 19.Moraes LGP, Rocha RSF,
conversion in dental composites. J Appl Oral Sci. 2008;16:145–9. 20.Sunitha C, Kailasam V,
Padmanabhan S, Chitharanjan AB. Bisphenol A release from an orthodontic adhesive and its correlation with the degree of conversion on varying light-curing tip distances. Am J Orthod Dentofac Orthop. 2011;140:239–44.
21.de Araujo LOF , Baretto O , de Mendonça AAM and França R . Assessment of the degree of conversion in light‐curing orthodontic resins with various viscosities Appl Adhes Sci 2015; 3:26
22.Tahmassebi JF, Duggal MS, Malik-Kotru G, Curzon MEJ. Soft drinks and dental health: a review of the current literature. J Dent 2006;34:2-11.
23.Malekipour MR, Sharafi A, Kazemi S, Khazaei S, and Shirani F. Comparison of color stability of a composite resin in different color media. Dent Res J 2012;9:441–446. 24.Bagheri, R, Burrow, M.F, Tyas. M.
Influence of food-simulating solutions and surface finish on susceptibility to staining of esthetic restorative materials. J Dent. 2005; 33:389-398.
***********