www.scienceworldjournal.org ISSN 1597-6343
An Intense Nigerian Stock Exchange Market Prediction Using Logistic With Back-Propagation Ann Model
AN INTENSE NIGERIAN STOCK EXCHANGE MARKET PREDICTION
USING LOGISTIC WITH BACK-PROPAGATION ANN MODEL
*Abubakar S. Magaji,
Department of Mathematical Sciences, Faculty of Science, Kaduna State University, Kaduna-Nigeria;
Adeboye K.R.
Department of Mathematics & Statistics, School of Natural & Applied Sciences, Federal University of Technology Minna-Nigeria.
*E-mail: abu_magaji@kasu.edu.ng
ABSTRACT
This paper is a continuation of our research work on the Nigerian Stock Exchange Market (NSEM) uncertainties, In our previous work (Magaji et al, 2013) we presented the Naive Bayes and SVM-SMO algorithms as a tools for predicting the Nigerian Stock Exchange Market; subsequently we used the same transformed data of the NSEM and explored the implementation of the Logistic function on Back-propagation algorithm on the WEKA platform, and results obtained, made us to also conclude that the Back-propagation model of Artificial Neural Network (ANN) performed very well and thus it is another algorithm that can effectively and efficiently be used for predicting the Nigerian Stock Exchange Market.
Keywords: Nigerian Stock Market, Prediction, Data Mining, Machine Learning, Artificial Neural Network, Back-propagation
INTRODUCTION
The Nigerian Stock Exchange was established in 1960 as the Lagos Stock Exchange. In December 1977 it became The Nigerian Stock Exchange, with branches established in some of the major commercial cities of the country [1]. There is no doubt that the majority of the people related to stock markets is trying to achieve profit. Profit comes by investing in stocks that have a good future (short or long term future). Thus what they are trying to accomplish one way or the other is to predict the future of the market for a profit making venture into the stock market [2]. But what determines this desirable future prediction? Predictions based on different models include some of the following Autoregressive Moving Average (ARMA), Random Walk (RW), Neural Network (NN), Naive Bayes (NB), and Support Vector Machines (SVM); all in an effort to improve the predictions, and thus, make reasonable indicial pronouncements that can guide the economic growth of a country [3].
The predictability of the market is an issue that has been much discussed by researchers and academics. In finance a hypothesis has been formulated, known as the Efficient Market Hypothesis (EMH), which implies that there is no way to make profit by predicting the market, but so far there has been no consensus on the validity of EMH (Krose .et al., 1996).
In this paper we intend to carry out prediction of the Nigerian Stock Exchange Market (NSEM) using ANN-Back-propagation algorithm with logistic activation function on a time series data. Our study of the Stock Exchange Market is limited to Nigerian reference frame of Nigerian Stock Exchange Market. In view of this all our training data set shall be acquired within the Nigerian Stock Exchange reference context.
Related Works
In the literature the data that are related to the stock markets are divided in three major categories [2]:
(1) Technical data: are all the data that are referred to stocks only.
Technical data include:
• The price at the end of the day.
• The highest and the lowest price of a trading day. • The volume of shares traded per day.
(2) Fundamental data: are data related to the intrinsic value of a
company or category of companies as well as data related to the general economy. Fundamental data include: Inflation, Interest Rates, Trade Balance, Indexes of industries (e.g. heavy industry), Prices of related commodities (e.g. oil, metals, and currencies), Net profit margin of a firm, and Prognoses of future profits of a firm.
(3) Derived data: this type of data can be produced by transforming
and combining technical and/or fundamental data.
Many experts in the stock markets have employed the technical analysis for better prediction for a long time. Generally speaking, the technical analysis derives the stock movement from the stock’s own historical value. The historical data can be used directly to form the support level and the resistance or they can be plugged into many technical indicators for further investigation. Conventional research addressing this research problem have generally employed the time series analysis techniques (i.e. mixed Auto Regression Moving Average (ARMA)) [3] as well as multiple regression models. Considerable evidence exists and shows that stock market price is to some extent predictable [4].
Within the context of Machine Learning, researchers have dwelt into a number of areas for prediction purposes; these includes Applied Mathematics (Yue et al.,2008, Berwald et al., 2011, Khudabukhsh et al.,2012), Business and Finance (Pompe et al., 1997, Holmes et al., 1998, Huang et al., 2005, Shah,2007, Kinlay et al.,2008, Fletcher et al,2008) , Computer Science (Boetticher,1994, Murray et al.,2005, Singh et al., 2006, Gammerman et al.,2007, Andrzejak et al., 2008, Alonso et al., 2010, Kumar et al., 2012, Haffey, 2012, Malhotra et al., 2012), Life Science (Muggleton et al., 1992, Calder et al., 1996, Demser et al., 2005, Cruz et al., 2006, Garzon et al., 2006, Cheng et al., 2008, Nugent, 2010, Kruppa et al., 2012, Qatawneh et al., 2012, Miller,2012), Energy (Gross et al., 2005, Arnold et al., 2006, Sharma et al., 2011), Sports (Lyle,2005, Joseph et al.,2006, Warner, 2010, Davis et al,2012), etc.
A closer look at the previous works done in predicting stock markets reveals Shah,2007 [5] whose paper discusses the application of Support Vector Machines, Linear Regression, Prediction using Decision Stumps, Expert Weighting and Online Learning in detail along with the benefits and pitfalls of each method. The main goal of the project was to study and apply as many Machine Learning Algorithms as possible on a dataset involving a particular domain, namely the Stock Market, as opposed to coming up with a newer (and/or better) algorithm that is more efficient in predicting the price of a stock.
Kinlay et al., 2008 [6] they applied SVM techniques to forecast market direction in the S&P 500 index, and also used a competitive model framework provided by the 11Ants modeling system to select the best performing combinations of linear models employing a variety of non-linear classification techniques. Fletcher et al,2008 [7] used the following
An Intense Nigerian Stock Exchange Market Prediction Using Logistic With Back-Propagation Ann Model
algorithms, Artificial Neural Networks (ANN), Support Vector Machines (SVM) and Relevance Vector Machines (RVM) to predict daily returns for an FX carry basket.
As for the most recent works that featured to predict Nigerian Stock Markets, three out of five conducted researches (2009 -2011) used the ANN models. Akinnwale et al (2009) [8] used regression analysis to analyze and predict untraslated and translated Nigerian Stock Market Price (NSMP). Based on the findings of the study, translated NSMP prediction approach was more accurate than untranslated NSMP using regression analysis algorithm.
Olabode et al [9] presented the use of a neural network simulation tool for stock market price, where various neural models like Multi-Layered Perceptron (MLP), Radial Basis Function (RBF), Generalized Regression Neural Networks (GRNN), Generalized Feed Forward Neural Networks (GFFNN) and Time Lagged Recurrent Networks (TLRN) were tested. The TLRN network architecture with one hidden layer and five processing elements was able to model the problem, as it came out to be the best model with good generalization capability.
Bello et al (2011) utilized ANNs model to predict closing price of AshakaCem Security in Nigerian Stock Market price index. They employed Feed Forward Artificial Neural Network (FFANN) Architecture and obtained results, which were evaluated on four performance indicators [Mean Square Error (MSE), Correlation Coefficient (r), Normalize Mean Square Error (NMSE) and Mean Absolute Error (MAE)] [10].
Whereas Agwuegbo et al (2010) urged that “The daily behaviour of the market prices revealed that the future stock prices cannot be predicted based on past movements” [11]. Though the result from the study provided evidence that the Nigerian stock exchange is not efficient even in weak form and that NSE follow the random walk model; thus concluded that Martingale defines the fairness or unfairness of the investment and no investor can alter the stock price as defined by expectation. The other work found in the literature, that did not make use of the ANN is the one presented by Emenike K.O (2010) [12], the Autoregressive Integrated Moving Average (p,d,q) model [ARIMA] was used to models and forecasts stock prices of the Nigerian Stock Exchange. The predictions failed to match market performance between certain periods of time, thus the adequacy of ARIMA (1.1.1) model to forecast the NSE index was questioned. The researcher concluded that the deviations found between forecast and actual values indicate that the global economies crisis destroyed the correlation relationship existing between the NSE index and its past.
The Logistic Back-propagation Model
The back-propagation algorithm (McClelland, 1989) is used in layered feed-forward ANNs. This means that the artificial neurons are organized in layers, and send their signals “forward”, and then the errors are propagated backwards[3]. The network receives inputs by neurons in the input layer, and the output of the network is given by the neurons on an output layer. There may be one or more intermediate hidden layers. The back-propagation algorithm uses supervised learning, which means that we provide the algorithm with examples of the inputs and outputs we want the network to compute, and then the error (difference between actual and expected results) is calculated. The idea of the back-propagation algorithm is to reduce this error, until the ANN learns the training data. The training begins with random weights, and the goal is to adjust them so that the error will be minimal.
Training Algorithm – Back-propagation
The Multi-Layer Perceptron (MLP) and many other neural networks learn using an algorithm called back-propagation. With back-propagation, the input data is repeatedly presented to the neural network. With each
presentation the output of the neural network is compared to the desired output and an error is computed. This error is then fed back (back-propagated) to the neural network and used to adjust the weights such that the error decreases with each iteration and the neural model gets closer and closer to producing the desired output[5].
During forward propagation through a network, the output (activation) of a given node is a function of its inputs. The inputs to a node, which are simply the products of the output of preceding nodes with their associated weights, are summed and then passed through an activation function before being sent out from the node. Thus, we have the following:
=∑ (1)
where is the total input at Layer i, is the weight of the input from node j in Layer i, and is a logistic activation function defined as in (2) below
= ( ), where ( ) =
( ) (2)
The backward pass is the error back-propagation and adjustment of weights. Gradient descent approach with a constant step length, also referred to as learning rate, is used to train the network.
The Delta rule (Lugar and Stubblefield, 1993) uses gradient descent learning, as defined in (4) below, to iteratively change network weights to minimize error (i.e. to locate the global minimum in the error surface).This method minimizes the sum of squared errors, as defined in (5), of the system until a given minimum or stop at a given number of epochs (cycles), where epoch is the term specifying the number of iterations to be done over the training set. The error is multi-dimensional and may contain many local minima. A momentum term may be added to avoid getting stuck in local minima or slow convergence. The output of each processing unit for the backward pass is defined as:
′ = ∗(1− ) (3)
Weights are then updated by the gradient descent method:
=−( ) (4)
∗ = + (5)
where ε is the Mean Squared Error (MSE) and α is the step size (learning rate).
After the training process is completed, the network with specified weights can be used for testing (validation) a set of data different from those used for training. The results achieved can then be used for generalization of the approximation of the network.
METHODOLOGY
The objectives of this work is to illustrate that ANN with logistic activation function run on back-propagation algorithm can effectively be used to predict the Nigerian Stock Exchange Market (NSEM) index values using previous day’s index values, and previous day’s NGN/USD exchange rate. In this study the following input variables would be considered to ultimately affect the stock exchange market index value.
NSE All Share index (according to closing price) (NSE_ASI)
An Intense Nigerian Stock Exchange Market Prediction Using Logistic With Back-Propagation Ann Model
NSE Market Capitalization (according to closing price) (NSE_MCAP)
Volume (VOL_CLOSING) Value (VAL_CLOSING)
The closing value ( = ) is taken as a function of the following variables: NSE_ASI=X1, NGN_USD=X2, NSE_MCAP=X3, and =X4 and so for a typical logistic activation function, we can express it as in equation (6).
= ∑ (6)
where Wi’s are the corresponding input weights.
Our model in equation (6) is explicitly expressed in 3.2.1 using MLP with a logistic activation function on back-propagation algorithm and pre-determined topology from Easy NN software.
Experimental data were downloaded from the websites of three prominent/registered Nigerian stock brokers these are Cowry, CashCraft and BGL. The data collected is for a period of 570 days starting from January 4, 2010 to April 30, 2012 excluding weekends and public holidays.
While pre-processing our data the mean of each the five attributes (NSEASI, NGN$, NSEMcap, VOLcls and VALcls) were used to further transformed data into nominal values of “small” and “large” for the first four attributes, while nominal values of “low” and “high” were used for the fifth attribute. We implemented the Logistic back-propagation algorithm using the WEKA software and results were obtained as presented below.
Figure 1: A MLP of 4-2-1 Topology
X2
X3
X4
X1
Y
11
2
2
3
3
4
4
1
2
3
4
A
B
P
Inputs
Hidden
Output
Layer
An Intense Nigerian Stock Exchange Market Prediction Using Logistic With Back-Propagation Ann Model
Part A: The calculations for the feed forward (i.e. forward pass), from equations (1) and (2), we proceed as follows:
Neuron A. Input to neuron A is given by:
= ( 1∗ 1 ) + ( 2∗ 2 ) + ( 3∗ 3 ) + ( 4∗ 4 )
(7) Output of neuron A is given by:
= (8)
Neuron B
Input to neuron B is given by:
= ( 1∗ 1 ) + ( 2∗ 2 ) + ( 3∗ 3 ) + ( 4∗ 4 ) (9)
Output of neuron A is given by:
= (10)
Neuron P. Input to neuron P is given by:
= ( ∗ ) + ( ∗ ) (11)
Output of neuron P is given by:
= (12)
Part B: The calculations for a reverse pass of Back Propagation, from equations (3), (4) and (5), proceed as follows:-
Calculate errors of output neurons:
= (1− )( − ) (13)
Change output layer weights:
= + (14)
= + (15)
Calculate (back propagation) hidden layer errors:
= (1− ) ) (16)
= (1− ) ) (17)
Change hidden layer weights:
= + (18)
= + (19)
= + (20)
= + (21)
= + (22)
= + (23)
= + (24)
= + (25)
RESULTS
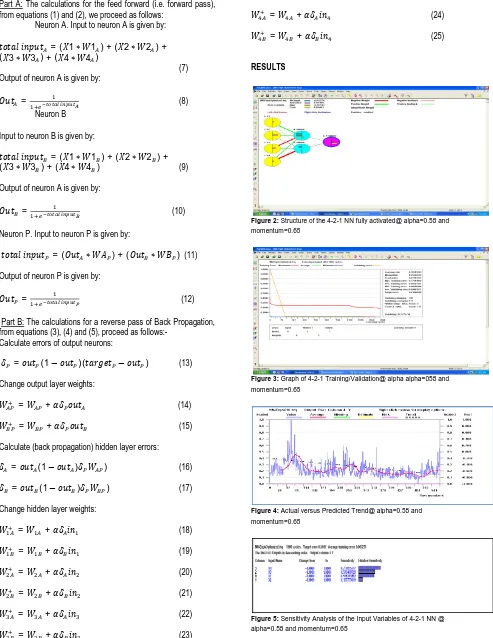
Figure 2: Structure of the 4-2-1 NN fully activated@ alpha=0.58 and
momentum=0.65
Figure 3: Graph of 4-2-1 Training/Validation@ alpha alpha=058 and
momentum=0.65
Figure 4: Actual versus Predicted Trend@ alpha=0.58 and
momentum=0.65
Figure 5: Sensitivity Analysis of the Input Variables of 4-2-1 NN @
alpha=0.58 and momentum=0.65
An Intense Nigerian Stock Exchange Market Prediction Using Logistic With Back-Propagation Ann Model
Figure 6: Relative Importance of the Input Variables of 4-2-1 NN @
alpha=0.58 and momentum=0.65
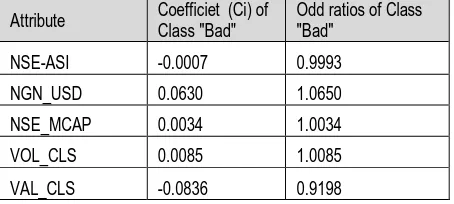
Table 1:Analysis of the Coefficient and Odd ratios for Class "Bad" for the
Logistic/Back-propagation Algorithm
Attribute Coefficiet (Ci) of Class "Bad"
Odd ratios of Class "Bad"
NSE-ASI -0.0007 0.9993
NGN_USD 0.0630 1.0650
NSE_MCAP 0.0034 1.0034
VOL_CLS 0.0085 1.0085
VAL_CLS -0.0836 0.9198
Table 2:Results of Stratified Cross validation for the 570 instances for the
Logistic Algorithm
Correctly Classified Instances 566 (99.2982%)
Incorrectly Classified Instances 4 (0.7018%)
Kappa statistic 0.9852
Mean absolute error (MAE) 0.0081
Root mean square error (RMSE) 0.0612
Relative absolute error (RAE) 1.7108%
Root relative square error (RRSE) 12.5425%
Table 3: Detailed Accuracy by Class for the Logistic/BP Algorithm
Class TP Rate
FP Rate
Precision Recall F-Measure
ROC
Bad 0.997 0.014 0.991 0.997 0.994 1
Good 0.986 0.003 0.995 0.986 0.991 1
=== Confusion Matrix for the Logistic Algorithm === a b <-- classified as
347 1 3 219
|
⌊ (26)
DISCUSSION
Analysis of the Results from Simulations on Easy-NN Software
The results obtained from simulation of our NSE data on the platform of Easy-NN software indicated that:
(i)The best fitted topology is the 4-2-1 NN (i.e. 4 input, 2 hidden and 1 output layers) [see Fig 2].
(ii)From the 399 instances that were used for training the network we recorded an average training error of
0.005276; simultaneously for the 171 instances used for validation, 80.12% were validated correctly [see Fig
3 & 4].
(iii) The sensitivity and relative importance analysis had shown that X1(VAL_CLS) has the highest relative sensitivity/importance, X3(NSE_MCAP) took a second position, X1(NSE_ASI) came third, while X2(NGN_USD) is the least in the hierarchy [see Fig 5
& 6].
Analysis of the Results from Implementation of Logistic/BP algorithms on WEKA Software.
From table (1) we see that the odd ratios of class “Bad” for all the five attributes have an approximate 50-50 percent chances, thus the odds of classification for “Bad” is 1 to 1 and so also for the odds of classification for “Good” is 1 to 1. Tables (2) and (3) give us a stratified cross validation for the 570 instances implemented with the Logistic algorithm; we see that the correctly classified instances (99.3%) indicates a very high learning capabilities, this is also attested by the confusion matrix in equation (26).
CONCLUSION
Based on our findings, it is clear that through the processes of data mining (semi-transformation of the data before analyzing it) the Logistic/Back-propagation algorithm had effectively predicted the NSE.
Further works will involve research work on possibilities of using other Machines Learning algorithms to predict the NSE.
REFERENCES
[1] Marwala L.R., ‘Forecasting the Stock Market Index Using Artificial Intelligence Techniques’2007
[2] Hellstrom T. And Holmstrom K., Predicting the Stock Market, Technical Report Series, Malardalen Univeristy Sweden, 1998.
[3] S.M. Kendall and K.ord, Time Series, 3rd ed. (Oxford University Press, New York, 1990)
[4] A.W. Lo and A.C. Mackinlay, Stock market prices do not follow random walks: Evidence from a simple specification test, Review of Financial Studies 1 (1988)
41-66
[5] Shah H.V., 2007, Machine Learning Techniques for Stock Prediction, Foundations of Machine Learning |
Spring 2007
[6] Kinlay J andRico D., Can Machine Learning Techniques be used to predict Market Directions?, Journal of Finance, 2008
[7] Fletcher T., Redpath F., and D’Alessadro J., Machine Learning in FX Carry Basket, 2007.
[8] Akinwale A.T, Arongundade O.T and Adekoya A.F. (2009), Translated Nigeria Stock Market Prices using
Artificial Neural Network for Effective Prediction,
Journal of Theoretical and Applied Information Technology, 36-43.
[9] Olabode O., Adeyemo A.B, and Coker C.O., Artificial
Neural Network for Stock Market Forecasting,
www.sciencenigeria.org/index2.php?option=com_doc man...doc.
An Intense Nigerian Stock Exchange Market Prediction Using Logistic With Back-Propagation Ann Model
[10] Bello M.Y. and Chiroma H. (2011), Utilizing Artificial
Neural Network for Prediction in the Nigerian Stock Market Price Index, Computer Science and
Telecommunications 2011/No.1(30)
[11] Agwuegbo S.O.N., Adewole A.P., and Maduegbuna A.N. (2010), A Random Walk Model for Stock Market
Prices, Journal of Mathematics and Statistics 6(3):
342-346
[12] Emenike K. O. (2010), Forecasting Nigerian Stock
Exchange Returns: Evidence from Autoregressive Integrated Moving Average (ARIMA) Model, Social
Science Research Network.
[13] Boser B.E.,Guyon I.M, and Vapnik V.N. (1992), A Training algorithm for optimal margin classifiers. 5th Annual ACM Workshop on COLT, pages 144-152, Pittsburg, PA, ACM Press.