Available online on 15.03.2019 at http://jddtonline.info
Journal of Drug Delivery and Therapeutics
Open Access to Pharmaceutical and Medical Research© 2011-18, publisher and licensee JDDT, This is an Open Access article which permits unrestricted non-commercial use, provided the original work is properly cited
Open Access
Research Article
Development and Validation of RP-HPLC-PDA Method for the Analysis of
Diclofenac Sodium in the
In Vitro
Transdermal Permeation Samples
Sai Sri Anusha V1,2, Buchi N. Nalluri1,3*
1 Department of Pharmaceutics and Biotechnology, KVSR Siddhartha College of Pharmaceutical Sciences, Vijayawada-520010, AP, INDIA
2 Research Scholar, Department of pharmacy, Krishna University, Machilipatnam, 521001, AP, INDIA
3 Siddhartha Pharma Innovation and Incubation Center at KVSR Siddhartha college of Pharmaceutical Sciences, Vijayawada-520010, AP, INDIA.
ABSTRACT
A new analytical method using high-performance liquid chromatography coupled with photo diode array detection was developed and validated for the quantification of Diclofenac (DIC) from in vitro skin permeation samples. Analysis was performed using a Phenomenex C18 column (150 x 4.6mm, 5µm) with 10mM ammonium acetate: Acetonitrile (62:38% v/v) as the mobile phase in isocratic mode and eluents were monitored at 276nm. DIC was eluted at 3.1min and showed a good linearity in the concentration range of 0.2-3µg/mL with a correlation coefficient >0.999. The validation parameters, such as specificity, linearity, accuracy and limit of detection, limit of quantification, precision, robustness fulfilled the regulatory requirements. The developed HPLC method was successfully used for the analysis of DIC in samples obtained from transdermal diffusate samples.
Keywords: Diclofenac, PDA detection, Method validation, In vitro transdermal diffusion.
Article Info:Received 06 Feb 2019; Review Completed 08 March 2019; Accepted 09 March 2019; Available online 15 March 2019
Cite this article as:
Anusha SSV, Nalluri BN, Development and Validation of RP-HPLC-PDA Method for the Analysis of Diclofenac Sodium in the
In Vitro Transdermal Permeation Samples, Journal of Drug Delivery and Therapeutics. 2019; 9(2):212-216
http://dx.doi.org/10.22270/jddt.v9i2.2559
*Address for Correspondence:
Buchi N Nalluri, Department of Pharmaceutics and Biotechnology, KVSR Siddhartha College of Pharmaceutical Sciences, Vijayawada-520010, AP, INDIA
INTRODUCTION
Diclofenac sodium (DIC) is a non- steroidal anti-inflammatory analgesic drug with the potent cyclooxygenase inhibition activity 1-5. It is commonly used for pain control
and treatment of rheumatic diseases. Various analytical procedures have been reported for the determination of DIC in pharmaceutical preparations including UV-Visible spectrophotometry 6-7, chemometry 8, spectrofluorimetry 9,
high performance liquid chromatography 10-12 etc. Some of
the methods used UV spectrometry for the estimation of DIC in transdermal studies 13-15. Only one method was reported
for HPLC evaluation of a transdermal patch 16. Literature
study revealed that there were no validated RP-HPLC-PDA methods reported for the estimation of DIC in in vitro skin diffusion studies. Hence, the present investigation was aimed to develop and validate a rapid and economic RP-HPLC-PDA method for the analysis of DIC in transdermal Diffusate samples.
EXPERIMENTAL
Chemicals
DIC was obtained as a gift sample from Lifeline Formulations, Vijayawada. Ammonium acetate, water, acetonitrile (ACN) and methanol were purchased from E. Merck, Mumbai, India. Sodium chloride was purchased from SDFCL, Mumbai, India. All the solvents and reagents used were of HPLC grade.
Equipment
In Vitro Transdermal Diffusion Studies
For in vitro drug diffusion studies, a vertical type
transdermal diffusion cell apparatus (Orchid Scientifics, Nashik, India) with Franz diffusion cells (having a diffusional surface area of 1.77 cm2 and an acceptor volume of ~14 mL)
were used and normal saline was used as the acceptor fluid after sonication. Porcine ear skin was chosen as the specific skin model prior to the mounting, skin sample was thawed and soaked in saline solution for half an hour for equilibration. Skin was mounted in between donor and acceptor chambers with the stratum corneum surface facing towards donor side and clamped. Magnetic stirring bead was placed in the acceptor compartment for uniform stirring of the contents. By maintaining the instrument at 37 ± 2 ºC, the skin surface is maintained at 32 ºC. 500µL of saturated solution of DIC in propylene glycol: saline (70:30 v/v) was added to donor chamber. Periodical samples of 500 µL were collected through the sampling port and stored at 4C until analysis. An equal volume of fresh saline was replenished at each sampling point. Sink condition is kept through the entire duration of the study was carried out over a 48 hr period and the samples were analyzed for DIC content by developed HPLC method.
Chromatographic Conditions
Isocratic elution with the mobile phase consisting of 10mM ammonium acetate: ACN (62:38% v/v) was used. Mobile phase was filtered through nylon disc filter of 0.45µm (Millipore) and sonicated for 3 min before use. C18
Phenomenex column (150 × 4.6mm, 5µ) was used as stationary phase and maintained at ambient temperature. The flow rate was 1.0 mL/min and the injection volume were 20µL. PDA detection was performed at 276nm and the separation was achieved at ambient temperature.
Preparation of stock and standard solutions
The stock solution of DIC (1mg/mL) was prepared by dissolving 10 mg of DIC in 5mL of methanol and volume was adjusted to the mark (10 mL) with the same. An appropriate volume of the stock solution was then further diluted with 10mM Ammonium acetate (as diluent) to get the required standard concentrations at a concentration range of 0.2-3µg/mL
Validation of the HPLC method
Following method development and optimization, analytical method validation was performed in line with the recommendations of the International Conference on Harmonization of Technical Requirements for Registration of Pharmaceuticals for Human Use (ICH) Q2 (R1) guideline 17
comprising the following performance parameters: Linearity
A series of five DIC standards were prepared over a concentration range of 0.2-3μg/mL (0.2, 0.5, 1, 2, 3μg/mL) from the stock and injected in triplicate. Linearity was evaluated by a plot of peak areas as a function of analyte concentration, and the data was subjected to regression analysis where by slope, intercept, and regression (R2)
correlation coefficients (R) were calculated and the data was given in Table-1.
Precision
Precision is the measure of closeness of the data values to each other for a given number of measurements under the same analytical conditions and was assessed by using a minimum of six determinations at 100% of the test
concentration. The standard deviation (SD) and the % relative standard deviation (RSD) were reported and the data was given in Table-1.
Specificity
The specificity of the method was determined by comparing the chromatograms obtained from the DIC with that of the samples obtained from transdermal permeation studies. The overlay of diluent, standard and sample chromatograms was shown in Fig. 2 and 3D plots were shown in Fig. 3.
Accuracy
To ascertain the accuracy of the proposed method, recovery studies were performed by the standard addition method where 80, 100, 120% of the known quantities of standard concentrations were added to the transdermal permeation studies samples and these solutions were analyzed by the developed method in triplicate. The % recovery and the % RSD values were calculated at each level of addition and the data was given in Table-1.
Limit of Detection (LOD) and Limit of Quantification (LOQ)
LOD and LOQ were calculated based on calibration curve data. They were expressed as LOD = (3.3 ×σ)/m; LOQ= (10.0×σ)/m (Where, is the standard deviation of the y-intercepts of the three regression lines and m is mean of the slopes of the three calibration curves).
Robustness
To show the robustness of the method developed, the LC
conditions were deliberately altered and the
chromatographic parameters viz., tailing factor, number of theoretical plates were recorded. To study the effect of flow rate, the flow rate was changed by ±5% and the effect of wavelength was studied by changing wavelength by ±2nm. Whereas, the effect of mobile phase composition was studied by changing ± 2% and the data was given in Table-2.
System suitability
System suitability was carried out by injecting a standard concentration at different injection volumes in the range of 10-50μL. The system suitability test parameters like retention time, tailing factor and theoretical plate number were noted and % RSD was calculated.
Stability of the stock solution
The stability of the stock solution was determined by analyzing the samples stored under refrigeration (8 ± 1o C)
conditions at different time intervals up to 1 month.
RESULTS AND DISCUSSION
Various HPLC, UV and spectrofluorimetric methods were published for the estimation of DIC in bulk and dosage forms, but no validated HPLC methods were reported for the quantification of DIC in in vitro transdermal permeation studies. Hence, the present investigation was aimed to develop a rapid and economical RP-HPLC-PDA method for the determination of DIC in transdermal permeation studies. Method Development
acetonitrile (38:62% v/v) as mobile phase was used at a flow rate of 1 mL/min and under these conditions the DIC peak merged with solvent front. Further trials were performed on Inertsil ODS (250x4.6mm, 5µ) column with 10mM ammonium acetate: acetonitrile as mobile phase combinations and finally a 62:38% v/v combination of 10mM ammonium acetate: acetonitrile was selected at flow rate of 1.0mL/min with 10mM ammonium acetate as diluent.
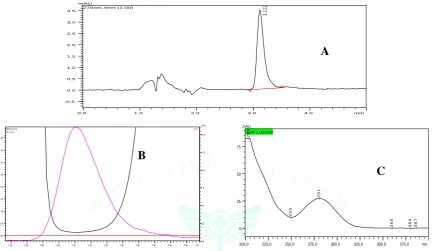
Under these conditions a sharp peak of DIC was eluted at 3.1min (Fig. 1) and the tailing factor, peak symmetry, theoretical plate numbers were all within the limits. For quantitative analytical purpose wavelength was set at 276 nm, which provided better reproducibility with no interference. The peak purity index was found to be greater than 0.9999 and indicating purity of the DIC sample used in the analysis and shown in Fig. 1 along with UV spectrum.
0.0 1.0 2.0 3.0 4.0 min
-0.5 0.0 0.5 1.0 1.5 2.0 2.5 3.0 3.5
mAU
276nm ,4nm (1.00)
3.
11
1
2.95 3.00 3.05 3.10 3.15 3.20 3.25 3.30 3.35 3.40 3.45 3.50 min
0.00 0.05 0.10 0.15 0.20 0.25 0.30 0.35 0.40
0.0 2.5 5.0 7.5 10.0 12.5 15.0 mAU
Peak
Zero Line
Purity Curv e
200.0 225.0 250.0 275.0 300.0 325.0 350.0 375.0 nm
0 25 50 75
mAU 3.20/ 1.00/smth
2
5
0
3
6
0
3
8
0
2
0
4
2
8
1
3
8
7
Figure 1: A – Standard chromatogram of DIC (1 µg/mL), B - Peak purity index of DIC and C - UV spectrum of DIC
Method validation
To establish the suitability of the optimized HPLC method for its intended purpose, the developed method has been validated in compliance with ICH-Guidelines with respect to the following parameters.
Linearity
The range of reliable quantification was set at the
concentrations of 0.2-3μg/mL. Peak areas and
concentrations were subjected to least square regression analysis. The correlation coefficient (R) was found to be 0.999 indicating a linear response over the concentration range selected and the data was given in Table-1.
Precision
Precision studies were carried out in terms of repeatability. Repeatability of standard application was assessed by using
six replicates of concentration at 1µg/mL level and the data was given in Table-1. The % RSD was found to be below 2 for peak areas and this shows the closeness of the data values to each other, indicating the precision of the method.
Specificity
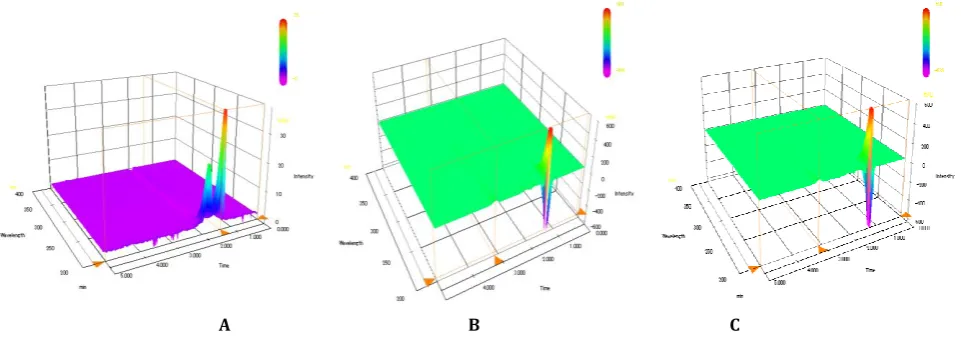
The specificity of the method was established by injecting the solutions of diluent, standard and in vitro transdermal permeation sample individually to examine any interference and from the overlay of chromatograms as shown in Fig. 2. It can be inferred that there were no co-eluting peaks at the retention time of DIC, this shows that peak of analyte was pure without any interferences and the peak purity indices for sample and standard was found to be greater than 0.999 and this confirms specificity of the method. The absence of interference peaks as supported by 3D plots of chromatograms, indicates the specificity of the proposed method.
0.0 0.5 1.0 1.5 2.0 2.5 3.0 3.5 4.0 4.5 min
-2000 -1000 0 1000 2000 3000 4000 5000
uV
Figure 2: Overlay of the diluent (A), standard (B) and permeation sample (C) chromatograms
B
B
A
B
C
B
A B C Figure 3: 3D Plots of diluent (A), standard (B) and permeation sample (C)
Accuracy
Accuracy of the proposed method was ascertained by performing recovery studies by standard addition method by spiking the known quantities of standard at 80, 100, 120% to transdermal permeation samples and these solutions were analyzed in triplicate in each level of addition. The % RSD and the % recovery were within the acceptable limit in all cases. From the results obtained, it is evident that the proposed method enables very accurate quantitative estimation of DIC.
Table 1: Linearity, Precision and Accuracy data of DIC Validation data of DIC
Linearity(n=3) Range
Regression equation Regression coefficient (R2)
Correlation coefficient (R)
0.2-3µg/mL y =29263x-2227 R=0.999 R2=0.999
Accuracy(n=3)
(% level of addition) Mean Recovery (% RSD) 80
100 120
99.533 (0.30) 100.533 (0.75) 98.513 (0.45)
Precision(n=6) Average Peak Area (% RSD)
30914.3 (0.74)
Limit of Detection (LOD) and Limit of Quantification (LOQ)
LOD and LOQ were determined based on statistical calculation from the calibration curves, where LOD = (3.3 ×σ)/m; LOQ= (10.0×σ)/m ( is the standard deviation of the y-intercepts of the three regression lines and m is mean of the slopes of the three calibration curves). The LOD for DIC was found to be 0.00852g/mL, the drug peak could be detected without any base line disturbances at this concentration. The LOQ for DIC was found to be 0.02581 g/mL
Robustness
As part of the robustness, a deliberate change in the flow rate, wavelength and mobile phase was made to evaluate the impact on the method. Retention times were significantly changed with flow rate, mobile phase and no change in the retention time was observed in wavelength change. The parameters like theoretical plate number, tailing factor were not changed and were within the limits. These results indicated that the method is robust in terms of flow rate, mobile phase and wavelength.
Table 2: Robustness data
Chromatographic parameter Retention time (min) Theoretical plates (#) Tailing factor Flow rate (mL/min)
0.95 1.0 1.05
3.25 3.11 3.05
2499 2472 2463
1.641 1.629 1.614 Wave length (nm)
274 276 278
3.11 3.11 3.11
2588 2472 2566
1.632 1.629 1.642 Composition of mobile phase (10mM ammonium acetate: Acetonitrile) 60:40
62:38 64:36
3.06 3.11 3.27
2469 2472 2546
System suitability
System suitability testing is an integral part of the analytical procedure. System suitability studies were carried out by different injection volumes (10L - 50L) of 1g/mL. The % RSD values for system suitability test parameters like retention time (1.13%), tailing factor (1.981%) and theoretical plate number (1.68%) were less than 2% indicating the present conditions were suitable for the analysis of DIC in in vitro transdermal permeation samples. Stability of the stock solution
The variation in assay values at different time intervals were found to be less than 2% of the initial time interval and these results indicate that, the solutions were stable for a period of 1 month when stored at 8oC.
In vitro transdermal permeation studies
The application of this method has been demonstrated by the study of in vitro transdermal Diffusate samples of DIC. Samples showed no interference peak at DIC elution i.e. 3.1 min. Permeation profile was shown in Fig. 4. From the permeation profile the steady state transdermal flux was found to be 13.07nmol/ cm2/ hr, with a lag time of
16.4293hrs. The amount of DIC retained in the skin after the transdermal permeation study was also estimated by the developed method. The method was successfully used for the quantification of DIC in the skin permeation studies.
Fig.4: In vitro skin permeation profile of DIC
CONCLUSION
In this work, a rapid and efficient RP-HPLC-PDA method was developed for the analysis of DIC in samples obtained from transdermal permeation studies. The method was validated as per ICH Guidelines, and found to be applicable for the estimation of DIC in in vitro transdermal permeation studies using isocratic binary mode of elution. The results of linearity, precision, accuracy and specificity were found to be within the limits. The method provides selective quantification of DIC without interferences from diluent and skin diffusion experiments. Therefore, this method can be selectively employed to quantify DIC in in vitro transdermal permeation studies using saline as the receptor solution.
ACKNOWLEDGEMENTS
The authors are thankful to Lifeline Formulations Ltd, Vijayawada, India for providing gift sample of DIC and to the Siddhartha Academy of General and Technical Education,
Vijayawada, for providing necessary facilities to carry out this research work.
REFERENCES
1. The United States Pharmacopeia USP 28, United States Pharmacopeial Convention, INC. Asian Edition, 2009; 21-24. 2. British Pharmacopoeia Commission. International edn. HMSO
publication, London. 2007; 1469.
3. Ku EC, Wsvary JM, Cash WD, Diclofenac sodium (GP 45840, Voltaren), a potent inhibitor of prostaglandin synthetase, Biochemical Pharmacology, 1985; 24(5):641-643.
4. Menasse R, Hedwall PR, Kraetz J, Pericin C, Riesterer L, Sallmann A, Ziel R, Jaques R, Pharmacological properties of Diclofenac Sodium and its metabolites, Scandinavian journal of rheumatology, Supplement, 1978; 22(22):5-16.
5. Brogen RN, Heel RC, Pakes GE, Speight TM, Avery GS, Diclofenac sodium: A review of its pharmacological properties and therapeutic use in rheumatic diseases and pain of varying origin, Drugs, 1980; 20(1):24-48.
6. Sznitowska M, Stokrocka M, Determination of diclofenac released from suppositories using UV spectrophotometry, spectra derivative spectrophotometry and HPLC, Acta Poloniae Pharmaceutica, 2007; 64(5):401-405.
7. De Souza RL, Tubino M, Spectrophotometric Determination of Diclofenac in Pharmaceutical Preparations, Journal of the Brazilian Chemical Society, 2005; 16(5):1068-1073.
8. Castellano PM, Vignaduzzo SE, Maggio RM, Kaufman TS, Application of a chemometric method for simultaneous determination of acetaminophen and diclofenac in content-uniformity and drug-dissolution studies, Analytical and Bioanalytical Chemistry, 2005; 382(7):1711-1714.
9. Arancibia JA, Boldrini MA, Escandar GM, Spectrofluorimetric determination of diclofenac in the presence of alpha-cyclodextrin, Talanta, 2000; 52(2): 261-268.
10. Mayee R, Rawat S, Thosar A, Atre K, Mane P, Development and validation of HPLC method for determination of Diclofenac sodium by tape stripping method, Asian Journal of Pharmaceutical and Biological Research, 2011; 1(3):317-322. 11. Avgerinos A, Karidas TH, Malamataris S, Extraction less
high-performance liquid chromatographic method for the determination of diclofenac in human plasma and urine, Journal of Chromatography B: Biomedical Sciences and Applications, 1993; 619(2):324-329.
12. Panusa A, Multari G, Incarnato G, Gagliardi L, High-performance liquid chromatography analysis of anti-inflammatory pharmaceuticals with ultraviolet and electrospray-mass spectrometry detection in suspected counterfeit homeopathic medicinal products. Journal of Pharmaceutical and Biomedical Analysis, 2007; 43(4):1221-1227.
13. Raj SB, Vijay V, Kumar DN, Himavarshini, Suguna P, Srikanth P, Raja SW. Design and in-vitro evaluation of Diclofenac-Paracetamol dual release transdermal patch, International Journal of Pharmacy & Therapeutics, 2013; 4(2):127-133. 14. Kriplani P, Sharma A, Aman, Pun P, Chopra B, Dhingra A,
Deswal G. Formulation and evaluation of transdermal patch of Diclofenac Sodium, Global Journal of Pharmacy & Pharmaceutical Sciences, 2018; 4(5) : 001-003.
15. Shivalingam MR, Durgabhavani G, Vaishnavi K, Priyanka K, Formulation and evaluation of Diclofenac potassium transdermal patches for enhanced therapeutic efficacy, Indian Journal of Research in Pharmacy and Biotechnology 2014, 2(3): 1152-1157.
16. Klimes J , Sochor J, Dolezal P, Korner J. HPLC evaluation of diclofenac in transdermal therapeutic preparations. International Journal of Pharmaceutics. 2001, 217(1-2): 153-60.