THE EFFECT OF INTERNAL TEMPERATURE LOADS ON ORIFICE
FLOWMETER
Liang-Huai Tong1, Su-Lu Zheng1*, Jian Fan2, Xiu-Qin Chen4, Hao-Nan Xu2, Jiang-Bo Tong2
1
Quzhou Special Equipment Inspection Center, Quzhou 324000, China.
2
College of Mechanical Engineering & Key Laboratory of Air-driven Equipment Technology
of Zhejiang Province, Quzhou University, Quzhou, 324000, China.
Article Received on 04/09/2019 Article Revised on 25/09/2019 Article Accepted on 15/10/2019
ABSTRACT
Orifice flowmeter has a wide range of applications, it can be applied to
all single-phase fluids (liquid, gas, steam) and part of miscible flow,
the diameter and working state (temperature and pressure) of general
production process can be measured. In order to study the influence of
different temperature loads on the accuracy of the orifice flowmeter
under certain pressure load on the inner wall of the orifice flowmeter pipeline, the
three-dimensional model of the orifice flowmeter is analyzed by using simulation software, and the
ability of the orifice flowmeter to withstand loads under natural conditions is analyzed. It is
found that the locations of the maximum stress and displacement of orifice flowmeter occur
at the inner wall of pipeline and inlet, and the maximum strain occurs in the shell. The
maximum stress, displacement and strain of the orifice flowmeter increase with the increase
of the temperature load when the pressure load is 0.1 MPa and keeps constant.
KEY WORDS: Orifice flowmeter; Finite element; Load; Maximum stress.
0 INTRODUCTION
Orifice flowmeter is a high range ratio differential pressure flowmeter consisting of standard
orifice plate and multi-parameter differential pressure transmitter, which can measure gas,
steam, liquid and so on. It has a series of advantages, such as simple structure, stable
World Journal of Engineering Research and Technology
WJERT
www.wjert.org
SJIF Impact Factor: 5.924*Corresponding Author
Su-Lu Zheng
Quzhou Special Equipment
Inspection Center, Quzhou
performance and wide application range, so it is widely used in the control process and
measurement of petroleum, chemical industry, metallurgy, electric power, heating, water
supply and other fields[1~2]. Orifice flowmeter is widely used in many fields, it can measure all unidirectional flow velocity and part of miscible flow velocity[3], when measuring, the fluid flows through the throttle device in the pipeline, causing local contraction near the
throttle, increasing flow velocity and generating static pressure difference on both sides of the
upstream and downstream. The greater the flow of medium, the greater the pressure
difference before and after the throttle[4~6], so orifice flowmeter can measure the flow rate by measuring the pressure difference, but the pressure loss is large, and orifice flowmeter needs
to convey hot air, which is easy to cause corrosion to the sensor, making the accuracy
difficult to guarantee[7~9]. Based on this, the orifice flowmeter is modeled by Solidworks[10], and the three-dimensional model is analyzed by the Simulation software[11], to analyze the distribution and variation of stress, displacement and strain of the orifice flowmeter under
natural conditions, and provide a theoretical basis for further improving the orifice flowmeter.
1 Calculation settings
The orifice flowmeter is made of 304 stainless steel, the elastic modulus of 304 stainless steel
is 190000 N/mm2, Poisson's ratio is 0.29, and the mass density is 8000 kg/m3, as shown in Tab. 1. Fix the middle two plates of the orifice flowmeter with definition fixture, so that the
orifice flowmeter cannot move in all directions, as shown in Fig. 1.
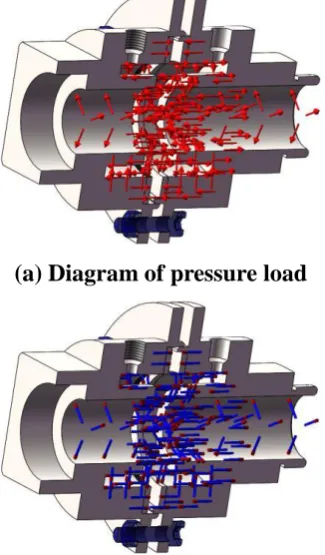
The force surface of the built 3D model is loaded to simulate the pressure and temperature
that it loaded in reality.
In this study, it is necessary to apply pressure load and temperature load on the inner wall of
the orifice flowmeter for a certain material, and on the premise of constant pressure load, the
additional temperature of the inner wall of the pipeline is changed, and the changes of stress,
displacement and strain of the orifice flowmeter are compared. Therefore, the pressure load
and temperature load are applied to the inner wall of the pipe to simulate the load of orifice
Tab. 1 Attribute of 304 stainless steel materials.
Fig. 1: Diagram of fixed middle plate of the orifice flowmeter.
(a) Diagram of pressure load
(b) Diagram of temperature load
Grid generation in Solidworks Simulation is an important part of finite element analysis. The
results of analysis of the orifice flowmeter can also be more accurate by choosing appropriate
grid. Based on this, the three-dimensional model is analyzed under the condition of different
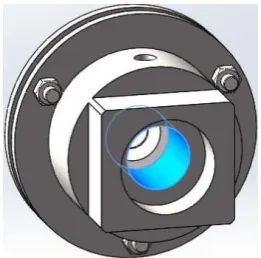
grid numbers, the selected pressure surface is shown in Fig. 3, and the appropriate grid is
obtained, as shown in Fig. 4.
Fig. 3 Pressure surface.
(a) Main view (b) Left view Fig. 4 Grid of the orifice flowmeter.
2 RESULTS ANALYSIS Stress analysis
Firstly, the temperature load of 20 ℃ and the pressure load of 0.1 MPa was applied to the
inner wall of the orifice flowmeter pipe, the results are shown in Fig. 5.
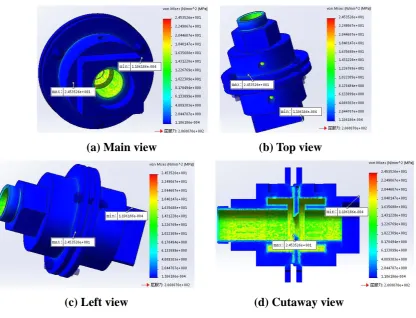
Fig. 5 (a) is the main view of stress of the orifice flowmeter at 20 ℃ and 0.1 MPa and its
detailed data; Fig. 5 (b) is the top view of stress of the orifice flowmeter at 20 ℃ and 0.1 MPa
and its detailed data; Fig. 5 (c) is the left view of stress of the orifice flowmeter at 20 ℃ and
0.1 MPa and its detailed data; Fig. 5 (d) is the cutaway view of stress of the orifice flowmeter
Fig. 5 (a) and Fig. 5 (d) show that the stress of the orifice flowmeter is concentrated at the
middle groove of the inner wall of the pipeline, the stress of the orifice flowmeter reaches its
maximum value at the middle groove of the inner wall of the pipe, which is 24.53526 MPa,
and reaches its minimum at the outlet of the orifice flowmeter, which is 0.0001106186 MPa.
Fig. 5 (a) shows that the maximum stress at the outlet of the orifice flowmeter is
2.044707MPa and the minimum stress at the outlet of the orifice flowmeter is
0.0001106186MPa; Fig. 5 (b) and Fig. 5 (c) show that the maximum stress of the orifice
flowmeter at its inlet is 6.133899MPa and the minimum stress of the orifice flowmeter at its
inlet is 2.044707MPa; Fig.5 (d) shows that the maximum stress of pipe inner wall of the
orifice flowmeter is 24.53526 MPa and the minimum stress of pipe inner wall of the orifice
flowmeter is 10.22309 MPa.
(a) Main view (b) Top view
(c) Left view (d) Cutaway view Fig.5 Stress diagram (20 ℃, 0.1 MPa).
Keep the pressure load applied on the orifice flowmeter unchanged, and increase the
temperature load from 20 ℃ to 100 ℃, as shown in Fig. 6.
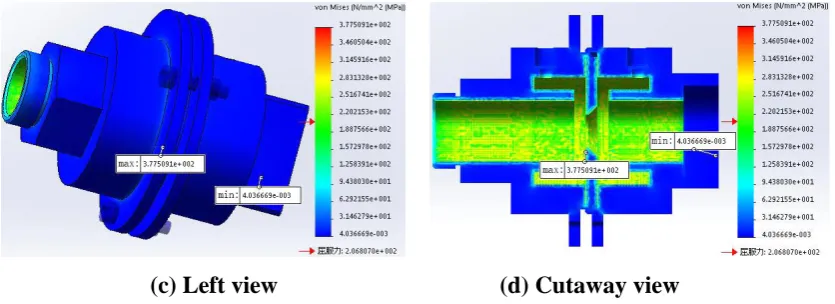
Fig. 6 (a) is the main view of stress of the orifice flowmeter at 100 ℃ and 0.1 MPa and its
MPa and its detailed data; Fig. 6 (c) is the left view of stress of the orifice flowmeter at 100
℃ and 0.1 MPa and its detailed data; Fig. 6 (d) is the cutaway view of stress of the orifice
flowmeter at 100 ℃ and 0.1 MPa and its detailed data.
With the change of the orifice flowmeter when the temperature load is 20 ℃ and the pressure
load is 0.1 MPa, it can be seen that the stress is still concentrated at the middle groove of the
inner wall of the pipe. Fig. 6 (a) and Fig. 6 (d) show that the maximum stress of the orifice
flowmeter is obtained at the middle groove of the orifice flowmeter, which is 377.5091 MPa,
it is 352.97384 MPa larger than that of the orifice flowmeter when the temperature load is 20
℃ and the pressure load is 0.1 MPa, the minimum stress of the orifice flowmeter is obtained
at the outlet of orifice flowmeter, which is 0.004036669 MPa, it is 0.0039260504 MPa larger
than that of the orifice flowmeter when the temperature load is 20 ℃ and the pressure load is
0.1 MPa. Fig. 6 (a) shows that the maximum stress at the outlet of the orifice flowmeter is
31.46279 MPa and the minimum stress at the outlet of the orifice flowmeter is 0.004036669
MPa; Fig. 6 (b) and Fig. 6 (c) show that the maximum stress at the inlet of the orifice
flowmeter is 94.38030 MPa and the minimum stress at the inlet of the orifice flowmeter is
0.004036669 MPa; Fig. 6 (d) shows that the maximum stress of the orifice flowmeter pipe
wall is 377.5091 MPa and the minimum stress of the orifice flowmeter pipe wall is 157.2978
MPa. It can be seen that the location of the minimum stress of the orifice flowmeter is
basically unchanged when the pressure load is 0.1 MPa and the temperature load is increased
from 20 ℃ to 100 ℃,the value increases by 0.0039260504 MPa, and the location of the
maximum value is basically unchanged, but the value changes greatly, which increases by
352.97384 MPa.
(c) Left view (d) Cutaway view Fig.6 Stress diagram (100 ℃, 0.1 MPa).
Continue to keep the pressure load applied on the inner wall of the orifice flowmeter pipeline
unchanged, and increase the temperature load from 100 ℃ to 500 ℃, as shown in Fig. 7.
Fig. 7 (a) is the main view of stress of the orifice flowmeter at 500 ℃ and 0.1 MPa and its
detailed data; Fig. 7 (b) is the top view of stress of the orifice flowmeter at 500 ℃ and 0.1
MPa and its detailed data; Fig. 7 (c) is the left view of stress of the orifice flowmeter at 500
℃ and 0.1 MPa and its detailed data; Fig. 7 (d) is the cutaway view of stress of the orifice
flowmeter at 500 ℃ and 0.1 MPa and its detailed data.
Comparing the changes, the stress of the orifice flowmeter is still concentrated at the middle
groove of the inner wall of the pipe. Fig. 7 (a) and Fig. 7 (d) show that the stress of the orifice
flowmeter reaches its maximum value at the two fixed plates on the inner wall of the
pipeline, which is 2387.728 MPa, it is 2010.2189 MPa larger than that of the orifice
flowmeter when the temperature load is 100 ℃ and the pressure load is 0.1 MPa, the stress of
the orifice flowmeter reaches its minimum value at the outlet, which is 0.01990113MPa, it is
0.015864461 MPa larger than that of the orifice flowmeter when the temperature load is 100
℃ and the pressure load is 0.1 MPa. Fig. 7 (a) shows that the maximum stress at the outlet of
the orifice flowmeter is 198.9956 MPa and the minimum stress at the outlet of the orifice
flowmeter is 0.01990113 MPa; Fig. 7 (b) and Fig. 7 (c) show that the maximum stress at the
inlet of the orifice flowmeter is 596.9469 MPa and the minimum stress at the inlet of the
orifice flowmeter is 198.9956 MPa; Fig. 7 (d) shows that the maximum stress of the orifice
flowmeter pipe wall is 2387.728 MPa and the minimum stress of the orifice flowmeter pipe
wall is 994.8982 MPa. It can be seen that the location of the minimum stress of the orifice
flowmeter is basically unchanged when the pressure load is 0.1 MPa and the temperature load
of the maximum value is basically unchanged, but the value changes greatly, which increases
by 2010.2189MPa.
(a) Main view (b) Top view
(c) Left view (d) Cutaway view Fig.7 Stress diagram (500 ℃, 0.1 MPa).
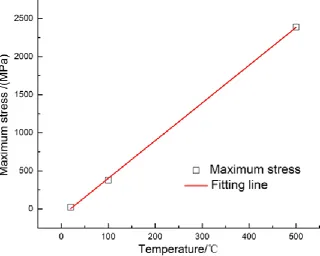
By comparing the data of the stress change obtained above, it can be seen that when the
pressure load is 0.1 MPa and remains unchanged, the stress change of the orifice flowmeter is
positively correlated with the change of additional temperature load, and the maximum stress
also increases with temperature load increasing, as shown in Fig. 8. The stress of the orifice
flowmeter is concentrated at the middle groove or its inlet of the inner wall of the pipe, it can
Fig. 8: Diagram of relation between maximum stress and temperature at 0.1 MPa.
(2) Displacement analysis
Firstly, the temperature load of 20 ℃ and the pressure load of 0.1 MPa was applied to the
inner wall of the orifice flowmeter pipe, the results are shown in Fig. 9.
Fig. 9 (a) is the main view of displacement of the orifice flowmeter at 20 ℃ and 0.1 MPa and
its detailed data; Fig. 9 (b) is the top view of displacement of the orifice flowmeter at 20 ℃
and 0.1 MPa and its detailed data; Fig. 9 (c) is the left view of displacement of the orifice
flowmeter at 20 ℃ and 0.1 MPa and its detailed data; Fig. 9 (d) is the cutaway view of
displacement of the orifice flowmeter at 20 ℃ and 0.1 MPa and its detailed data.
Fig. 9 (a) and Fig. 9 (d) show that the orifice flowmeter has the largest change of
displacement at the middle wall of the inner wall of the pipeline, with a value of
0.0002845755mm, and the smallest change at the two fixed plates, which is close to 0 mm.
Fig. 9 (a) shows that the maximum displacement at the outlet of the orifice flowmeter is
0.00007114387mm and the minimum displacement at the outlet of the orifice flowmeter is
0.00004742925mm; Fig. 9 (b) and Fig. 9 (c) show that the maximum displacement at the inlet
of the orifice flowmeter is 0.0002371462 mm and the minimum displacement at the inlet of
the orifice flowmeter is 0.00009485849 mm; Fig. 9 (d) shows that the maximum of the
orifice flowmeter pipe wall is 0.00002371462mm.
(a) Main view (b) Top view
(c) Left view (d) Cutaway view Fig.9 Displacement diagram (20 ℃, 0.1 MPa).
The pressure load applied on the orifice flowmeter is kept unchanged, and the temperature
increases from 20 ℃ to 100 ℃, as shown in Fig. 10.
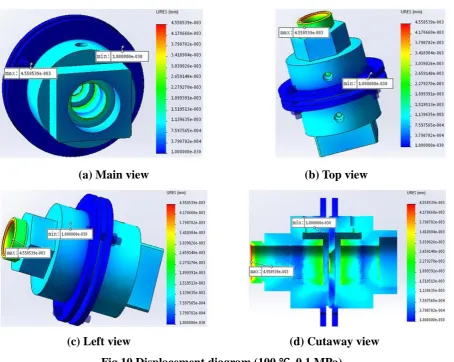
Fig. 10 (a) is the main view of displacement of the orifice flowmeter at 100 ℃ and 0.1 MPa
and its detailed data; Fig. 10 (b) is the top view of displacement of the orifice flowmeter at
100 ℃ and 0.1 MPa and its detailed data; Fig. 10 (c) is the left view of displacement of the
orifice flowmeter at 100 ℃ and 0.1 MPa and its detailed data; Fig. 10 (d) is the cutaway view
of displacement of the orifice flowmeter at 100 ℃ and 0.1 MPa and its detailed data.
Fig. 10(a) and Fig. 10(d) show that the location of maximum displacement of the orifice
flowmeter is changed from the middle wall of the inner wall of the pipeline to the inlet, and
the value is 0.004558539 mm, which is 0.0042739635mm larger than that of the orifice
flowmeter when the temperature load is 20 ℃ and the pressure load is 0.1 MPa, and the
10 (a) shows that the maximum displacement at the outlet of the orifice flowmeter is
0.001899391mm and the minimum displacement at the outlet of the orifice flowmeter is
0.0007597565mm; Fig. 10 (b) and Fig. 10 (c) show that the maximum displacement of outlet
of the orifice flowmeter is 0.004558539 mm and the minimum of outlet of the orifice
flowmeter is 0.001899391 mm; Fig. 10 (d) shows that the maximum displacement of the
orifice flowmeter pipe wall is 0.003418904 mm and the minimum displacement of the orifice
flowmeter pipe wall is 0.0003798782 mm. It can be seen that the location of maximum
displacement of the orifice flowmeter is changed from the middle wall of the inner wall of the
pipeline to inlet when the pressure load is 0.1 MPa and the temperature load is increased from
20 ℃ to 100 ℃, the value is increased by 0.0042739635mm, the location of minimum value
is unchanged, and the value is still almost 0.
(a) Main view (b) Top view
(c) Left view (d) Cutaway view Fig.10 Displacement diagram (100 ℃, 0.1 MPa).
The pressure load applied to the orifice flowmeter is kept unchanged, and the temperature
load is increased from 100 ℃ to 500 ℃, as shown in Fig. 11.
and its detailed data; Fig. 11 (b) is the top view of displacement of the orifice flowmeter at
500 ℃ and 0.1 MPa and its detailed data; Fig. 11 (c) is the left view of displacement of the
orifice flowmeter at 500 ℃ and 0.1 MPa and its detailed data; Fig. 11 (d) is the cutaway view
of displacement of the orifice flowmeter at 500 ℃ and 0.1 MPa and its detailed data.
Fig. 11 (a) and Fig. 11 (d) show that the displacement of the orifice flowmeter still reaches its
maximum at its inlet, which is 0.02872968 mm, and it is 0.024171141mm larger than that of
the orifice flowmeter when the temperature load is 100 ℃ and the pressure load is 0.1 MPa,
the minimum value is obtained at the two fixed plates, and the value is close to 0. Fig. 11 (a)
shows that the maximum displacement at the outlet of the orifice flowmeter is
0.01197070mm and the minimum displacement at the outlet of the orifice flowmeter is
0.002394140 mm; Fig. 11 (b) and Fig. 11 (c) show that the maximum displacement at the
inlet of the orifice flowmeter is 0.02872968 mm and the minimum displacement at the inlet
of the orifice flowmeter is 0.01197070 mm; Fig. 11 (d) shows that the maximum
displacement of the orifice flowmeter pipe wall is 0.02154726 mm and the minimum
displacement of the orifice flowmeter pipe wall is 0.002394140 mm. It can be seen that the
location of maximum displacement of the orifice flowmeter remains unchanged when the
pressure load is 0.1 MPa and the temperature load increases from 100 ℃ to 500 ℃, the value
increases by 0.024171141mm, and the location of minimum displacement of the orifice
flowmeter remains unchanged, and the value is still almost 0.
(c) Left view (d) Cutaway view Fig.11 Displacement diagram (500 ℃, 0.1 MPa).
The results show that the displacement of the orifice flowmeter is positively correlated with
the temperature load applied on the inner wall of the pipe when the pressure load is constant,
the larger the applied load, the more obvious the change of displacement is, and the location
of the maximum displacement of the orifice flowmeter is more obvious, as shown in Fig. 12.
Besides, except for the displacement of the orifice flowmeter is most obvious at the middle
wall of the inner wall of the pipeline at 20 ℃ and 0.1 MPa, in other cases, the displacement of
the orifice flowmeter is always the most obvious at its inlet, while the displacement of the
orifice flowmeter at the two fixed plates changes hardly.
Fig.12 Diagram of relation between maximum displacement and temperature at 0.1 MPa.
Strain analysis
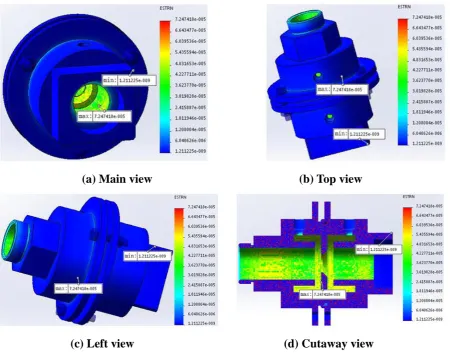
Similar to the stress analysis and displacement analysis, the temperature load of 20 ℃ and the
pressure load of 0.1 MPa are applied to the inner wall of the orifice flowmeter pipe, and the
Fig. 13 (a) is the main view of strain of the orifice flowmeter at 20 ℃ and 0.1 MPa and its
detailed data; Fig. 13 (b) is the top view of strain of the orifice flowmeter at 20 ℃ and 0.1
MPa and its detailed data; Fig. 13 (c) is the left view of strain of the orifice flowmeter at 20
℃ and 0.1 MPa and its detailed data; Fig. 13 (d) is the cutaway view of strain of the orifice
flowmeter at 20 ℃ and 0.1 MPa and its detailed data.
Fig. 13 (a) and Fig. 13 (d) show that the orifice flowmeter has the maximum strain in its
shell, with a value of 0.00007247418, the strain at its outlet is the smallest, with a value of
0.000000001211225. Fig. 13 (a) shows that the maximum strain at the outlet of the orifice
flowmeter is 0.000012080004 and the minimum strain at the outlet of the orifice flowmeter is
0.000000001211225. Fig. 13 (b) and Fig. 13 (c) show that the maximum strain at the inlet of
the orifice flowmeter is 0.00003623770 and the minimum strain at the inlet of the orifice
flowmeter is 0.000006040626. Fig. 13 (d) shows that the maximum strain of the orifice
flowmeter pipe wall is 0.00006039536 and the minimum strain of the orifice flowmeter pipe
wall is 0.00003019828.
(a) Main view (b) Top view
The pressure load applied on the orifice flowmeter is kept unchanged, and the temperature
load is increased from 20 ℃ to 100 ℃, as shown in Fig. 14.
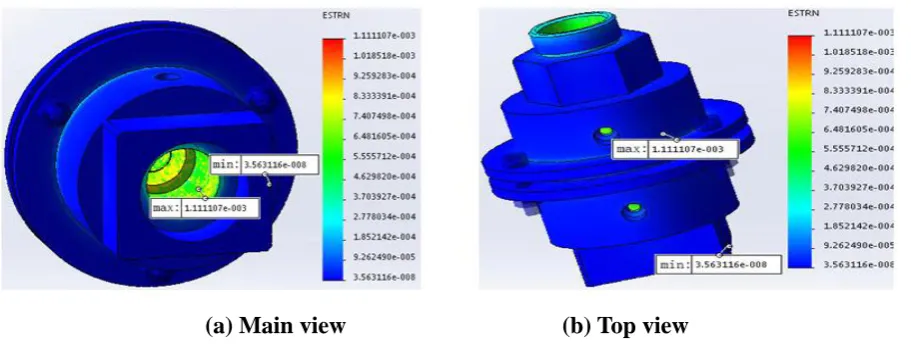
Fig. 14 (a) is the main view of strain of the orifice flowmeter at 100 ℃ and 0.1 MPa and its
detailed data; Fig. 14 (b) is the top view of strain of the orifice flowmeter at 100 ℃ and 0.1
MPa and its detailed data; Fig. 14 (c) is the left view of strain of the orifice flowmeter at 100
℃ and 0.1 MPa and its detailed data; Fig. 14 (d) is the cutaway view of strain of the orifice
flowmeter at 100 ℃ and 0.1 MPa and its detailed data.
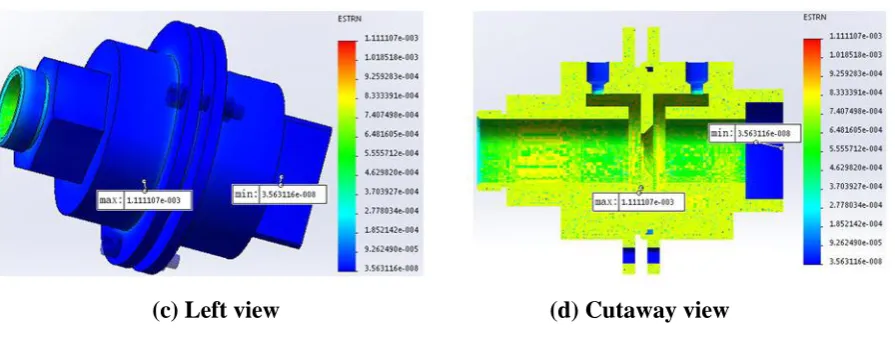
Fig. 14 (a) and Fig. 14 (d) show that the strain of the orifice flowmeter reaches its maximum
value in the shell, which is 0.001111107,and compared with the orifice flowmeter when the
temperature load is 20 ℃ and the pressure load is 0.1 MPa, it increases by 0.00103863282,
and the strain of the orifice flowmeter obtain the minimum value at its outlet which is
0.00000003563116, which is 0.000000034419935 larger than that of the orifice flowmeter
when the temperature load is 20 ℃ and the pressure load is 0.1MPa. Fig. 14 (a) shows that
the maximum strain at the outlet of the orifice flowmeter is 0.0001852142 and the minimum
strain at the outlet of the orifice flowmeter is 0.00000003563116; Fig. 14 (b) and Fig. (c)
show that the maximum strain at the inlet of the orifice flowmeter is 0.0006481605 and the
minimum strain at the inlet of the orifice flowmeter is 0.0002778034; Fig. 14 (d) shows that
the maximum value of the orifice flowmeter pipe wall is 0.0009259283 and the minimum
value of the orifice flowmeter pipe wall is 0.00055712. It can be seen that the maximum
strain of the orifice flowmeter is obtained in the shell when the pressure load is 0.1 MPa and
the temperature load is increased from 20 ℃ to 100 ℃,the value is increased by
0.00103863282, the location of minimum strain is unchanged, and the value is increased by
0.00000003563116.
(c) Left view (d) Cutaway view Fig.14 Strain diagram (100 ℃, 0.1 MPa).
Keep the pressure load applied on the orifice flowmeter unchanged, and increase the
temperature load from 100 ℃ to 500 ℃ as shown in Fig. 15.
Fig. 15 (a) is the main view of strain of the orifice flowmeter at 500 ℃ and 0.1 MPa and its
detailed data; Fig. 15 (b) is the top view of strain of the orifice flowmeter at 500 ℃ and 0.1
MPa and its detailed data; Fig. 15 (c) is the left view of strain of the orifice flowmeter at 500
℃ and 0.1 MPa and its detailed data; Fig. 15 (d) is the cutaway view of strain of the orifice
flowmeter at 500 ℃ and 0.1 MPa and its detailed data.
Fig. 15 (a) and Fig. 15 (d) show that the strain of the orifice flowmeter in its shell reaches a
maximum value of 0.007029017, and it is 0.00591791 larger than that of the orifice
flowmeter when the temperature load is 100 ℃ and the pressure load is 0.1 MPa. The strain at
the outlet of the orifice flowmeter reaches a minimum value which is 0.0000002955327, it is
0.00000025990154 larger than that of the orifice flowmeter when the temperature load is 100
℃ and the pressure load is 0.1MPa. Fig. 15 (a) shows that the maximum strain at the outlet of
the orifice flowmeter is 0.001171749 and the minimum strain at the outlet of the orifice
flowmeter is 0.0000002955327; Fig. 15 (b) and Fig. 15 (c) show that the maximum strain at
the inlet of the orifice flowmeter is 0.004100383 and the minimum strain at the inlet of the
orifice flowmeter is 0.0005860223. Fig. 15 (d) shows that the maximum strain at the inner
wall of the orifice flowmeter pipe is 0.005857563, and the minimum at the inner wall of the
orifice flowmeter pipe is 0.002928929. It can be seen that the maximum strain of the orifice
flowmeter can be obtained in the shell when the pressure load is 0.1 MPa and the temperature
load is increased from 100 ℃ to 500 ℃, the value is increased by 0.00591791, the location of
(a) Main view (b) Top view
(c) Left view (d) Cutaway view Fig.15 Strain diagram (500 ℃, 0.1 MPa).
Through the analysis of the above strain results, it can be seen that when the pressure load is
0.1 MPa and remains unchanged, the strain of the orifice flowmeter increases with the
increase of additional temperature load, and the maximum strain also increases with it, there
is a linear correlation between the two, as shown in Fig. 16. The maximum strain of the
orifice flowmeter is distributed in the shell, and the minimum strain is at the outlet of the
orifice flowmeter.
3 CONCLUSION
In this paper, the three-dimensional model of the orifice flowmeter is analyzed by using
simulation software, the stress, strain and displacement of the three-dimensional model are
observed under the given conditions, it is found that when a pressure load of 0.1 MPa and the
different temperature load are applied to the inner wall of the orifice flowmeter pipe, the
maximum stress on the orifice flowmeter occurs at the middle groove of the inner wall of the
pipe or its inlet, the displacement of the middle wall or the outlet of the inner wall of the pipe
changes most obviously, and the maximum strain of the orifice flowmeter occurs inside the
shell. The maximum stress, the maximum displacement and the maximum strain of the orifice
flowmeter are linearly correlated with temperature load, but they are affected little by
temperature load. In practical application, the corresponding location can be strengthened to
enhance the stability of the orifice flowmeter.
ACKNOWLEDGEMENTS
The work was supported by Zhejiang Provincial Market Supervision and Administration
Project (No. 20190131) and Quzhou Science and Technology Project (No. 2018K05).
REFERENCE
1. Gao Songwei, Goudan. Application of hydrodynamic software in orifice plate
measurement[J]. Journal of Shenyang University of Technology, 2009; 31(01): 84-88.
2. Sun Huaiqing. Development and Prospect of Orifice Flowmeter in China [J]. Automation
Instrument, 2007; (S1): 30-32.
3. Fang Shuping. Brief discussion on the use and measurement error of orifice plate
flowmeter [J]. Chemical Engineering and Equipment, 2010; (07): 75-76.
4. Yang Guolai, Li Mingxue. Simulation of flow field inside orifice flowmeter [J]. Gansu
Science Journal, 2015; 27(06): 79-81, 106.
5. Gao Jingwei, Xiao Jingguang. Application and daily management of standard orifice
flowmeter [J]. Equipment management and maintenance, 2015; (S2): 309-311.
6. Pang Haiming. The method of improving the measuring accuracy of orifice flowmeter[J].
Chemical automation and instrument, 2018; 45(12): 925-928.
7. Shi Xiaojun. Error analysis and correction of orifice flowmeter[J]. Automation
Instrument, 2010; 31(2): 72-73.
8. Zheng Boren. Measurement error of orifice flowmeter and its causes and solutions[J].
9. Zhou Chenxuan. Brief discussion on the factors affecting the orifice plate flowmeter to
measure gas flow [J]. Science and Technology Wind, 2017; (11): 220.
10.Wen Shiming. Application analysis of three-dimensional modeling software Solidworks
in scientific research and innovation[J]. Modern industrial economy and informatization,
2019; 9(04): 12-13, 26.
11.Han Liguang, Liu Fang. Finite element fatigue analysis of support shaft based on
Solidworks Simulation[J]. World Manufacturing Technology and Equipment Market,