Pharmacophore
2014, Vol. 5 (5), 693-700 USA CODEN: PHARM7 ISSN 2229-5402
Pharmacophore
(An International Research Journal)
Available online at http://www.pharmacophorejournal.com/
Original Research Paper
A SIMPLE AND SENSITIVE STABILITY-INDICATING HPTLC ASSAY
METHOD FOR THE DETERMINATION OF LINAGLIPTIN
K Venkata Rao
1,2,,
Raja Gorla
1,2,*, B Sreenivasulu
1, N Sreenivas
1, T Kaleemullah
1,
Sharma Hemant Kumar
1and Raghu Babu Korupolu
21
APL Research Centre-II (A Division of Aurobindo Pharma Ltd), Survey No: 71&72, Indra-
karan (V), Sangareddy (M), Medak Dist., Hyderabad-502 329, Andhra Pradesh, India
2
Department of Engineering Chemistry, A.U. College of Engineering (A), Andhra
University, Visakhapatnam-530 003, Andhra Pradesh, India
ABSTRACT
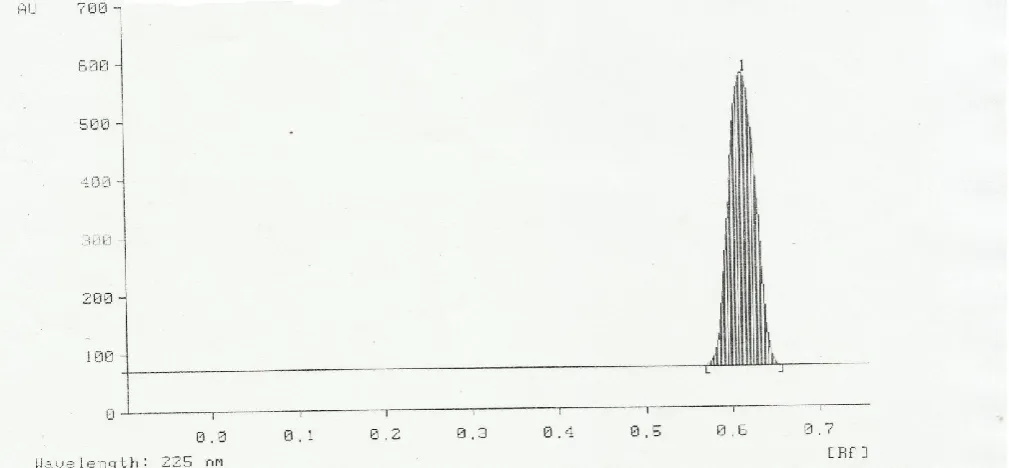
A simple, sensitive, accurate and stability-indicating economical densitometric method has been developed and validated for the quantitative determination of linagliptin in bulk and pharmaceutical dosage forms. Separation of the drug was carried out using ethyl acetate: IPA : Ammonia 7:3:0.4 (v/v/v) as mobile phase on precoated silica gel 60 F254 plates. The retention factor (Rf ) for linagliptin was 0.61 ±
0.05. The detection of band was carried out at 225 nm. The method is validated with respect to linearity, accuracy, precision, robustness and forced degradation studies, which further proves the stability-indicating supremacy of the method. During forced degradation studies, linagliptin is observed to be labile to acid, base hydrolysis and oxidative stress and stable in photolytic and thermal stress. The degradation products are well separated from the linagliptin peak, thus proving the stability-indicating superiority of the method. The calibration curve was linear in the concentration range 100 to 700 ng per band with correlation coefficient (r2= 0.997) and is found to be sensitive for linagliptin, with a detection limit of 47 ng per band and a quantification limit of 142 ng per band. The proposed method is simple, rapid and economical when compared to liquid chromatographic method for the determination of linagliptin in bulk and pharmaceutical dosage form.
Keywords:
Linagliptin, Densitometric method, Stability-indicating, Validation.INTRODUCTION
Linagliptin is a highly potent, selective CD26 (DPP-4) inhibitor with IC50 of 1 nM. Linagliptin is described chemically as 1H-Purine-2,6-dione, 8-[(3R)-3-amino-1-piperidinyl]-7-(2-butyn-1-yl)-3,7-dihydro-3-methyl-1-[(4-methyl-2quinazolin- yl) methyl]. Linagliptin is an oral drug that reduces blood sugar (glucose) levels in patients with type 2 diabetes. Linagliptin is a member of a class of drugs that inhibit the enzyme, dipeptidyl peptidase-4 (DPP-4). Linagliptin inhibits the enzyme, DPP-4, that destroys GLP-1 and GIP and thereby increases the levels and activity of both
the estimation of linaglipin in bulk and pharmaceutical dosage forms.8
To date there have been no published reports for quantitation of Linagliptin by HPTLC in bulk and in tablet dosage form. The proposed method is validated as per ICH guidelines.9 Present work describes a simple, accurate , precise and stability-indicating method for the estimation of linagliptin in bulk and tablet formulations.
MATERIAL AND METHODS
Materials
Pure drug Linagliptin, Tradjenta® tablets(Linaglitin-5 mg), a pro drug was provided by our APL Research Centre-II . (A Division of Aurobindo Pharma Ltd). All the reagents and chemicals used were of analytical grade from Merck Chemicals, India.
Standard stock solution (1 mg mL-1) of Linagliptin was prepared by dissolving 50 mg of drug in 50 mL methanol. This solution (5 mL) was further diluted to 50 mL to furnish stock solution of 100 ng µL-1
Chromatography
The samples were spotted in the form of bands of width 6mm with a 100 µL sample syringe(Hamilton, Bonaduz, Switzerland) on precoated silica gel 60 F254 aluminum HPTLC
plates (20 cm x 10 cm) with 250 µm thickness (E. Merck, Darmstadt, Germany) using a CAMAG Linomat V (Switzerland) sample applicator. The plates were prewashed with methanol and activated at 110°C for 5 min, prior to chromatography. Linear ascending development was carried out in a 20 cm x 10 cm twin-trough glass chamber (CAMAG) using the mobile phase ethyl acetate: IPA: Ammonia 7:3:0.4 (v/v/v). The chamber saturation time was 15 min. The development distance was 9 cm and the development time 20 min. The plates were dried in a current of air with the help of a hair dryer. Densitometric scanning was performed with a CAMAG TLC Scanner 3 at 225 nm operated by Wincats software version 4.06. The source of radiation utilized was a deuterium lamp emitting a continuous UV spectrum between 200 and 400
nm. The slit dimension were 5 mm x 0.45 mm and the scanning speed of 20 mm s-1.
Method Validation
The proposed method was validated as per ICH guidelines
Specificity
The specificity of the method was ascertained by analyzing standard drug and samples of equivalent concentration (500 ng per band). The band for linagliptin in the sample was confirmed by comparing the Rf values and spectra of the
band from the sample with those from the standard. The peak purity of linagliptin was assessed by comparing the spectra at three different levels, i.e., peak start, peak apex and peak end.
Precision
The repeatability of sample application and of measurement of peak area was determined by performing six replicate measurements of the same band using 500 ng per band of linagliptin. The intra-day and inter-day variation in the analysis of linagliptin was measured.
Limits of Detection and Quantification
To estimate the limits of detection (LOD) and quantification (LOQ), blank methanol was applied to a plate six times by the method described above. The signal-to-noise ratio (S/N) was determined. LOD and LOQ was regarded as the amounts for which S/N was 3:1 and 10:1 respectively.
Linearity
For preparation of the calibration plot aliquots of (1-7 µL) of the fresh standard stock solution (100 ng µL-1) of linagliptin were applied by over spotting on an TLC plate and the plate was developed and scanned as described above. Each standard was analyzed in five replicates and peak areas were recorded. Calibration plot for linagliptin was constructed separately by plotting peak area against respective concentration of linagliptin.
Accuracy
different levels of 50, 100, 150% to pre-analyzed sample solution. Densitograms were obtained and the peak areas was noted. The concentrations of drug and thus mean percentage recovery was calculated from respective calibration curves.
Robustness
The robustness of the method was studied, by small but deliberate variation of chamber saturation period (±10%), mobile phase composition (±2%), and time from development to scanning(0, 30, 60, 90 min). One factor at a time was changed to study the effect. The robustness of the method was checked at concentration of 500 ng per band to study the effect on the peak area of the drug.
Solution Stability
Sample solutions for the estimation of the assay were prepared and stored in tightly capped volumetric flasks, protected from light on a laboratory bench and evaluated at different time intervals up to 24 h. They were then applied to a TLC plate and analyzed by the method for the presence of any band other than that of the drug peak.
Analysis of Tablet Formulation
Tradjenta® tablets nominally containing 5 mg Linagliptin per tablet were weighed accurately and finely powdered. A quantity of powder equivalent to (25mg of linagliptin) was weighed and transferred to a 25 mL volumetric flask containing approximately 15 mL methanol and sonicated to dissolve, and the volume was made up to the mark with the methanol. The solution was filtered using Whatman no.41 paper. From the filterate 5 mL was further diluted to 50 mL to furnish sample stock solution of linagliptin(100 ng µL-1). From sample stock solution 5 µL was applied to an HPTLC plate to furnish final amount 0f 500 ng per band for linagliptin. After chromatographic development peak areas of the bands were measured at 225 nm and amount of drug present per tablet was estimated from the respective calibration plots. The procedure was repeated six times for analysis of homogenous sample.
Accelerated Degradation of Linagliptin
Stock solution of 50 mg linagliptin in 50 mL methanol was used for forced degradation study’
Acid and Base Degradation
HCl (1 M, 5 mL) and NaOH (1M 5 mL) were added separately to 5 ml stock solution of linagliptin. The mixtures were heated under reflux at 85°C on a water bath for 3 h. The forced degradation was performed in the dark to exclude the possible degradative effect of light. The resulting solution(1 µL, 500 ng per band) were applied to a TLC plate and the chromatograms were run as described above.
Hydrogen Peroxide-Induced Degradation
Hydrogen peroxide(10.0% v/v, 5 mL) was added to 5 mL stock solution of linagliptin and the mixture was heated under reflux at 85°C on a water bath for 1 h. The resulting solution (1 µL, 500 ng per band) was applied to TLC plate and the chromatogram was run as described above.
Photochemical Degradation
Photolytic studies was also carried out by exposure of drug to UV light up to 200 watt hours/m2 and subsequently cool fluorescent light to achieve an illumination of 1.2 million Lux hours. A solution of 50 mg of linagliptin in 100 mL methanol was prepared from the photochemical degraded samples and 1µL (500 ng per band ) were applied to TLC plate and the chromatogram was run as described above.
Thermal Degradation
Linagliptin drug powder was placed in oven at 105 °C for 2 h to study the thermal degradation. A solution of 50 mg linagliptin in 100 mL methanol was prepared from the thermal degraded sample and 1 µL (500 ng per band) was applied to a TLC plate and the chromatogram was run as described above.
RESULTS AND DISCUSSION
Method Development and Optimization
Introduce isopropanol (IPA) in presence of ethanol and tried in different ratios, slight moment was observed. Ammonia also introduced as a trail part in different concentration with the above composition then observed good results. Finally the mobile phase ethyl acetate : IPA : Ammonia 7:3:0.4 (v/v/v) was selected as optimum for obtaining well defined peak . The retention factor for linagliptin was 0.61 ± 0.05. The wavelength 225 nm was selected for detection because drug showed considerable absorbance at this wavelength.
Method Validation
Linearity
The standard calibration plots were linear over a range 100-700 ng per band with correlation coefficient of 0.997. The validation data is summarized in (Table 1). Which gives Beer’s law limit, linear regression equation, correlation coefficient, LOD and LOQ for drug.
Accuracy
Recovery study results ranged from 99.63 to 100.17% with RSD values ranging from 0.256 to 0.882%. Results of recovery studies are reported in (Table 2).
Precision
Intra-day variation, as RSD, was 0.512% and inter-day variation, as RSD, was 0.671% summarised in (Table 3). These low levels of the RSD show the repeatability and precision of the method was good.
Robustness
The robustness of the method was checked at concentration of 500 ng per band to study the effect on the peak area of the drug. Results of Robustness studies are reported in (Table 4).
Assay of Tablet formulation
The spectra acquired for linagliptin extracted from the tablet was also compared with those
acquired for linagliptin standard, good correlation between the corresponding spectra indicated that the method is specific for the drug and no other tablet components interfere with the drug.The assay [%] was 99.623 ± 0.203 in tablet formulation tested.
Stability-Indicating Property
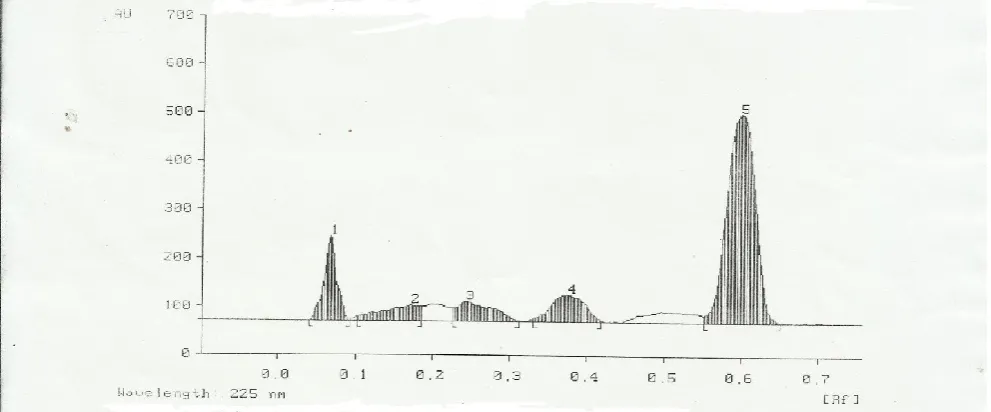
The chromatograms obtained from samples degraded by treatment with acid, base, hydrogen peroxide contained well-separated spots of the pure drug and some additional peaks at different RF values. It is apparent from that the spots of the
degradation products were well resolved from those of the drug. The peak of linagliptin was not significantly shifted in the presence of the degradation peaks, which indicated the stability-indicating nature of the method. Photochemical and thermal degradation shows no additional peaks other than drug peak.
CONCLUSION
The developed HPTLC technique is accurate, precise, specific, robust and stability indicating one, Statistical analysis proves that the method is reproducible and selective for the analysis of lingaliptin as bulk drug and pharmaceutical formulations. It is proposed for routine analysis of this drug in presence of degradation products in stability study.
ACKNOWLEDGMENTS
Figure 1: Chemical structure of Linagliptin
Figure 2: Spectra of linagliptin measured from 200 to 400 nm
Figure 4: Acid-Induced degradation chromatogram of Linagliptin
Table 1: Summary of validation data for the proposed method Linagliptin
Detection wavelength [nm] 225 Beer’s law limit [ng per band] 100-700 Correlation coefficient (r) 0.997 Linear regression equationa)(y = mx + c)
Intercept (c) -74.961 Slope(m) 5.4064 Detection limit [ng per band] 47 Quantitation limit [ng per band] 142
a)Where y is peak area and x is concentration (ng per band) n = 5
Table 2: Results from study of recovery of linagliptin (n = 3)
Drug Amount taken [ng/band]
Amount added [ng/band]
Amount found [ng/band]
Mean recovery[%]
RSD[%]n
AM
200 100 99.68 99.63 0.568
200 200 200.00 99.95 0.882
200 300 300.66 100.17 0.256
Table 3: Intra-day and inter-day precision (n = 6)
Amount (ng per band Linagliptin Mean area SD(±) RSD[%]n Intra-day precision
500
2508.80 12.79 0.512 Inter-day precision
500 2515.97 16.77 0.671
Table 4: Results from testing of robustness, as RSD [%] of peak area
Condition varied Linagliptin
Time from chromatography to scanning [min] 0.355 Chamber saturation period [min] 0.425 Mobile phase composition [%] 0.652
REFERENCES
1. Boehringer Ingelheim and Lilly (2011), “FDA
Approves Type 2 Diabetes Drug”.
2. (2010), “Four Phase III Trials Confirm Benefits of BI’s Oral, Once-Daily Type 2 Diabetes Therapy”, Genetic Engineering & Biotechnology News.
3. Martin, C Michel; Eric, Fliers and Cornelis, JF Van Noorden (2008), Dipeptidyl peptidase IV inhibitors in diabetes: more than inhibition
of glucagon-like peptide-1 metabolism?”,
Naunyn Schmiedebergs Arch
Pharmacol,377(3), 205–207.
4. Andre, J Scheen (2010),
“Dipeptidylpeptitase-4 Inhibitors (Gliptins)”,
Clinical Pharmacokinetics, 49(9),
573-588,
Linagliptin in Formulation”, Journal of
Atoms and Molecules, 2(2),155-164.
6. Rutvik, H Pandya; Rajeshwari, Rathod and Dilip, G Maheswari (2014), “Bioanalytical method development and validation for simultaneous determination of linagliptin and metformin drugs in human plasma by RP-HPLC method”, Pharmacophore, Vol. 5 (2), 7. Dyanneshwar, Thakare; Patil, Vikas;
Kalkotwar, Ramesh; Jadhav, Vijay B and Chandra, K Sekhar (2013), “A New RP-HPLC Method For Simultaneous Estimation of Metformin HCl and Linagliptin in Tablet Dosage Form”, WJPPS, 2(3), 1332-1341.
8. RI, El-Bagary; EF, Elkady and BM, Ayoub (2013), “Spectrophotometric methods for the determination of linagliptin in binary mixture with metformin hydrochloride and simultaneous determination of linagliptin and metformin hydrochloride using high performance liquid chromatography”, Int. J.
Biomed. Sci. Vol 9, 41-47.
9. (2005), “Validation of analytical procedures”,
International Conference on Harmonization (ICH) of Technical Requirements for the Registration of Pharmaceuticals for Human Use, Geneva,
Correspondence Author: Raja Gorla
APL Research Centre-II (A Division of Aurobindo Pharma Ltd), Survey No: 71&72, Indra- karan (V), Sangareddy (M), Medak Dist., Hyderabad-502 329, Andhra Pradesh, India