Available online on 15.1.2020 at http://ujpr.org
Universal Journal of Pharmaceutical Research
An International Peer Reviewed Journal Open access to Pharmaceutical research
This is an open access article distributed under the terms of the Creative Commons Attribution-Non Commercial Share Alike 4.0 License which permits unrestricted non
commercial use, provided the original work is properly cited
Volume 4, Issue 6, 2019
RESEARCH ARTICLE
IN VITRO-IN VIVO
BIO-EQUIVALENCE CORRELATION STUDY OF
ATENOLOL, AND ITS BRANDS OF IMMEDIATE RELEASE TABLET UNDER
BIO-WAIVER CONDITIONS
Ahmed EM
1, Ibrahim ME
1, Magbool FF
2 1College of Pharmacy, Department of Pharmaceutical Chemistry, Ribat National University, Khartoum, Sudan. 2Department of Pharmaceutical Chemistry, Omdurman Islamic University, Sudan.
ABSTRACT
Objective: The aim of present study is to examine the in vitro-in vivo correlation (IVIVC) of immediate release product. Atenolol 100mg and its brands of immediate release dosage forms. Atenolol is clearly classified into BCS class III, and could be evaluated under bio waiver conditions.
Methods: The in vitro parameters employed were hardness, weight uniformity, friability, disintegration time, absolute drug content, dissolution rate (in 0.1 N Hydrochloric acid, phosphate buffer and acetate buffer at 37ºC), and dissolution efficiencies
were also analyzed. The in-vitro dissolution study was performed on the brands, according to FDA, USP dissolution profile in
three different PH (1.2), (4.5), and (6.8) at 37ºC, using the USP apparatus II. A non linear relation was established which is typical for immediate release formulation, of class III.
Results:All Atenolol brands released about 90% drug in PH (6.8), where about 87% in PH (4.5), reference drug released about 91% and test drug released about 87% in pH (1.2). Dissolution efficiency of the entire brands differed by less than 10% from the
innovator brand.According to MINITAM 14 statistical program, there was significant relationship between in vitro and in vivo
data of reference Atenolol product.
Conclusion:By applying level A in vitro-in vivo correlation, study concluded that there is no linear correlation between percent of drug released and percent of drug absorbed, this may be due to uncontrollable permeability rate for class three Atenolol.
Keywords: Bioavailability, bioequivalence, biopharmaceutical classification system, Bio-waiver correlation.
Article Info: Received 20 September2019; Revised 16 December; Accepted 7 January, Available online 15 January 2020
Cite this
article-Ahmed EM, Ibrahim ME, Magbool FF. In vitro-in vivo bio-equivalence correlation study of atenolol, and its
brands of immediate release tablet under bio-waiver conditions. Universal Journal of Pharmaceutical Research 2019; 4(6):25-29.
DOI:https://doi.org/10.22270/ujpr.v4i6.332
Address for Correspondence:
Fatehalrahman F. Magbool, Department of Pharmaceutical Chemistry, Omdurman Islamic University, Sudan. Tel:
+966-582158608, E-mail: [email protected]
INTRODUCTION
Bio-equivalence is defined as the absence of a significant difference in the rate and extent to which the active ingredient or active moiety in pharmaceutical equivalents or pharmaceutical alternatives becomes available at the site of drug action when administered at the same molar dose under similar conditions in an appropriately designed study. If two medicines are bioequivalent there is no clinically significant difference in their bioavailability1. Development and optimization of formulation is an integral part of manufacturing and marketing of any therapeutic agent which is indeed a time consuming and costly process. Optimization process may require alteration in formulation composition, manufacturing process, equipment and batch sizes. If these types of changes are applied to a formulation, studies in human healthy
volunteers may be required to prove that the new formulation is bioequivalent with the old one2. Certainly, implementation of these requirements not only halts the marketing of the new formulation but also increases the cost of the optimization processes. It would be, desirable, therefore, to develop in vitro tests that reflect bioavailability data. A regulatory guidance for both immediate- and modified-release dosage forms has been, therefore, developed by the FDA to minimize the need for bioavailability studies as part of the formulation design and optimization3. IVIVC can be used in the development of new pharmaceuticals to reduce the number of human studies during the formulation development.
cardiovascular diseases. Introduced in 1976, atenolol was developed as a replacement for propranolol in the treatment of hypertension. It works by slowing down the heart and reducing its workload4.
MATERIALS AND METHODS
ATN reference standard USP, Mfg. August 2013, Exp. July 2018, and three different brands of ATN tablets 50 mg obtained from local market, DW and Methanol 99.8% (Sharlau, Spain).
Uniformity of weight test
Twenty randomly selected tablets were weighed. The average weights were determined. The tablets were weighed individually and the percentage of deviation of its weight from the average weight was determined for each tablet4.
Hardness test
The hardness of 10 tablets randomly selected from each batch was determined on an automatic tablet hardness tester. The crushing strength of uncoated tablets is accepted within 4-8 kg/cm2.
Friability test
20 tablets previously freed of dust were weighed together before transferring to a friabilator set to run for 4 min at 25 rpm. Thereafter they were removed, dusted and reweighed:
% Friability =𝑊𝑖 – 𝑊𝑓
𝑊𝑖 𝑋100
Where, Wi is the initial weight and Wf is the final weight of the tablets.
Disintegration time test
According to official monograph determination of disintegration time for uncoated tablets was adopted using a disintegrating apparatus and the medium was distilled water at 37±1oC. Six tablets were used for the determination. Accepted range for the uncoated tablet up to 30 minutes5.
Absolute drug content
Five pre-weighed tablets were crushed; the equivalent weight of a tablet was weighed out and dissolved in 100ml volumetric flask and filtered. The absorbance reading was determined using UV-visible spectrophotometer at 273 nm4.
In vitro dissolution test
Volume of 900 ml of each buffer was employed. Dissolution testing was performed using Tablet Dissolution Tester (USP Apparatus 2) at 75 rpm for class III test and reference products, temperature will be adjusted to 37±0.5oC. Twelve dosage units of each product test and reference were evaluated in the three media. Sample aliquots of 10 ml were taken manually with syringes. Samples were withdrawn at specified time intervals (10, 15, 30, 45, and 60 min) and replaced with 10 ml of appropriate medium. Withdrawn samples were filtered using 0.45-μm Millipore Filters, then 5 ml taken after filtration by volumetric pipette (3ml taken when use HCL buffer solution, and 1ml taken in case of acetate and phosphate buffer, and diluted to 50 ml). A UV–visible spectrophotometer was used to analyze dissolved drug in dissolution testing. Scanning of wavelength done in each buffer, and spectrum recorded between 200-800nm, and percentage of drug dissolved calculated6.
Buffers preparation
Simulated gastric fluid (SGF), simulated intestinal fluid (SIF), and acetate buffer PH (4.5) were prepared according to instructions in USP test solution. All media were prepared without enzymes, as follows:
Simulated Gastric Fluid (SGF) PH (1.2)
To prepare hydrochloric acid 0.1N, 8.5 ml was taken from concentrated HCL (37%) and volume completed to 1000 ml by distilled water7.
Simulated Intestinal Fluid (SIF) pH (6.8)
Potassium phosphate monobasic KH2PO4 0.2 M was
prepared by dissolving 27.22 g in water, and volume diluted to 1000 ml by distilled water. Then sodium hydroxide 0.2 M prepared by dissolving 8g in water and volume diluted to 1000 ml by distilled water. 250 ml from Potassium phosphate monobasic KH2PO4 0.2
M was placed into 200 ml volumetric flask, also 112 ml taken from sodium hydroxide 0.2M and volume completed to 1000 ml with distilled water7.
Acetate buffer pH (4.5)
Firstly acetic acid 0.2N was prepared from concentrated acetic acid 99.93%. Measured amount of 116 ml was taken and diluted with distilled water. Then 2.99 g of sodium acetate (NaC2H3O2) taken, and placed
in 1000 ml volumetric flask,14ml from acetic acid was added and volume completed to 1000 ml by distilled water8.
Preparation of standard stock solutions
Standard stock solutions of Atenolol in HCL, phosphate and acetate buffers were prepared by dissolving 100 mg of standard in 100 ml volumetric flask using acetate and phosphate buffers as solvents to give concentration of 1000 μg/ml, 5 ml diluted to 100 ml volumetric flask (50μg/ml), using 50 ml volumetric flask to give serial concentration of standard curve8.
Statistical analysis
All dissolution data evaluated using Excel spread sheet, and the results will be plotted for each brand. Average of % content of active pharmaceutical ingredient (API) dissolved in each media of 12 tablets will be taken and a plot of % of (API) dissolved against time will be drawn to represent the dissolution profile .The dissolution profile for local brand will be compared to that of the reference drug9.
If they are similar the similarity factor, f2 equal to or more than 50.This means that they are equivalent, if it’s less than 50 they are not equivalent.
f1 = {[3t=1n | Rt - Tt| ]/[3t=1n Rt ]}C f2 = 50 C log {[1+(1/n)3t=1n ( Rt - Tt )2 ] -0.5C 100}
The area under the dissolution-time curve method was used in calculating the dissolution efficiency (DE), and this was calculated at 30 min .The higher the dissolution efficiency (DE) is, the better the release efficiency of the tablets’ active ingredient, according to equation:
Where %D is the percentage dissolved at time t, % D (max) is the maximum dissolved at the final time T, and AUC (0-T)is the area under the curve from zero to time T10,11.
Correlation calculation was carried out using MINITAB14 specific statistical program.
In vitro-In vivo relationship determination of level A
correlation.
In vivo percent absorbed of reference product was calculated by following equation:
Where, 𝐴𝑡
𝐴0denotes the fraction of drug absorbed at time
t, Ct is the plasma drug concentration at time t, Kel is elimination rate constant, AUC0-t and AUC0-∞ are the area under the plasma concentration– time profile curve at time t and ∞ respectively.Then the values of percent of drug released were plotted against the percent of drug absorbed for reference products of Atenolol using MINITAB14 analysis program to find out the relationship between data (correlation).
RESULTS AND DISCUSSION
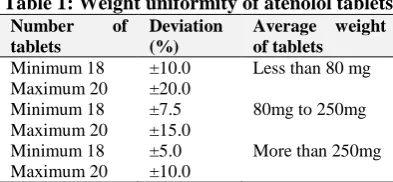
A summary of the results of weight uniformity, hardness, friability, disintegration and assay are shown in Table 2. Weight uniformity may serve as a pointer to amount of the active pharmaceutical ingredient (API) contained in the formulation.
Table 1: Weight uniformity of atenolol tablets
Number of tablets
Deviation (%)
Average weight of tablets
Minimum 18 Maximum 20
±10.0 ±20.0
Less than 80 mg
Minimum 18 Maximum 20
±7.5 ±15.0
80mg to 250mg
Minimum 18 Maximum 20
±5.0 ±10.0
More than 250mg
All the brands complied with the compendial specification for weight uniformity. Hardness is referred to as non-compendial test. The hardness or crushing strength assesses the ability of dosage form to withstand handling without fracturing or chipping, It can also influence other parameters such as friability and disintegration. Hence, the dosage forms of all brands were satisfactory for hardness7. Friability test is used to evaluate the tablets resistance to abrasion. Friability is now included in the United States
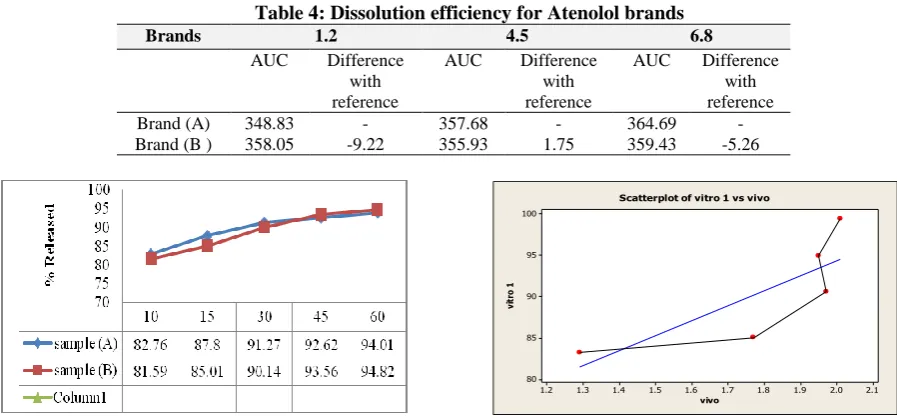
Pharmacopeia (USP, 1995) as a compendia test. The compendial specification for friability is less or equal to 1%. Friability for all brands of Atenolol was below 1%. Disintegration is the process of breaking of tablets in the liquid. Disintegration is a crucial step for immediate release dosage forms because the rate of disintegration affects the dissolution and subsequently the therapeutic efficacy of the medicine. A drug will be released rapidly as the dosage forms disintegrate. British Pharmacopeia specifies that uncoated tablets should disintegrate within 15 min and film coated tablet disintegrate within 30 min while USP specification for disintegration is 30 min for both uncoated and film coated tablets. All the brands were complied with both BP and USP specifications for disintegration as maximum disintegration time. Potency is the average amount of the active ingredient present per tablet. All the brands complied both BP and USP specification, as USP specification is that the content of active ingredient should not be less than 90% and not more than 110% while BP specifies that the content should not be less than 95% and not more than 105%.The results of dissolution studies are graphically represented in the Figure 1, Figure 2 and Figure 3. All dissolution data are based on the actual drug content of the test dosage form as calculated from the assay results. All Atenolol brands released about 90% drug in PH (6.8), where about 87% in PH (4.5), reference drug released about 91% and test drug released about 87% in pH (1.2).To compare the dissolution profiles of the brands, a model independent approach of difference factor f1 and similarity factor f2 were employed. Difference factor f1 is the percentage difference between two curves at each point and is a measurement of the relative error between the two curves. The similarity factor (f2) is a logarithmic reciprocal square root transformation of the sum of squared error and is a measurement of the similarity in the percent (%) dissolution between two curves. Two dissolution profiles to be considered similar and bioequivalent, f1 should be between 0 and 15 while f2 should be between 50 and 100 (FDA, 1997). All the values for f2 and f1 shown in Table 3 for atenolol, all brands f2 values were more than 50 and f1 values were less than 15. It means that all brands were equivalent with the innovator brand. In-vitro AUC in three PH (1.2),(4.5),(6.8) for class III product, there was large difference between in-vitro AUC and in-vivo AUC , the
in-vivo AUC is too small due to the lower permeability for this class of drug products , which will affect their AUC. Dissolution efficiency (DE) was also employed to compare the drug release from various brands. The reference and the test product can said to be equivalent if the difference between their dissolution efficiencies is within appropriate limits (±10%, which is often used).
Table 2: Quality control test results of atenolol brands
Assay % Friability
% Disintegration
Time(min) Weight variation
(RSD) Hardness
(kg/cm) Brands
99.88 0.01158
8:7 0.027
6.7 Sample (A)
103 0.0184
6:6 0.185
Table 3: F1 and F2 values for Atenolol
6.8 4.5
1.2 Samples
F2 F1 F2 F1 F2 F1
87 2 92 1 71 3
Sample (B)
Figure 1: Dissolution profile of Atenolol in pH (1.2)
Dissolution efficiency of the entire brands differed by less than 10% from the innovator brand. So, we can say that all the brands are pharmaceutically equivalent with the innovator brand6.
Figure 2: Dissolution profile of Atenolol in pH (4.5)
As IVIVC is a predictive mathematical model describing the relationship between variables (an in vitro property of a dosage form and a relevant in vivo
response). According to MINITAM 14 statistical program, there was significant relationship between in vitro and in vivo data of reference Atenolol product, Correlation and distribution of data with correlation coefficient (r=0.798, 0.815, 0.967), non linear
relationship with p-value (>0.05)=(0.106, 0.93, 0.009), there is no out lines, no lake of fits at P-Values=0.106, 0.040, 0.056 (>0.05) for the three pH (1.2,4.5,6.8) respectively8. Estimating the uncertainty in predicted correlation between vitro and vivo data. The interval is represented by the curved lines on either side of the regression line and gives an indication of the range within which the ‘true’ line might lie. Note that the confidence interval is narrowest near the center (the point x, y) and less certain near the extremes. By applying analysis of variance (ANOVA) for the dissolution data using MINITAB 14 we concluded that the test products are bioequivalent to reference products of Atenolol and could be interchangeable.
CONCLUSION
The bio waiver study has emphasized that pharmaceutical equivalence indicate that product have same drug molecule with approximately same pattern of dissolution release profile. By making fine turning in bioequivalent study we can reduce the time, cost, avoid Ethical, Ethnical consideration by unnecessary exposure of healthy subjects to medicines and finally to market the quality generic drug product. By applying level A in vitro-in vivo correlation, study concluded that there is no linear correlation between percent of drug released and percent of drug absorbed, this may be due to uncontrollable permeability rate for class three Atenolol. Atenolol are immediate release formulations. As dissolution is not a rate-limiting step in IR products, the fraction of drug absorbed against the fraction of drug released profile would be non-linear type which was obtained in present study. So it may be concluded that the in vitro-in vivo correlation is well established and justified for both reference formulations by level A correlation.
Table 4: Dissolution efficiency for Atenolol brands
6.8 4.5
1.2 Brands
Difference with reference AUC
Difference with reference AUC
Difference with reference AUC
-364.69 -
357.68 -
348.83 Brand (A)
-5.26 359.43
1.75 355.93
-9.22 358.05
Brand (B )
vivo
vi
tr
o
1
2.1 2.0 1.9 1.8 1.7 1.6 1.5 1.4 1.3 1.2 100
95
90
85
80
Scatterplot of vitro 1 vs vivo
Table 5: Relative dissolution efficiency of sample (B)
6.8 4.5
1.2
PH
98.56 99.51 102.64
%
vivo
vi
tr
o
2
2.1 2.0 1.9 1.8 1.7 1.6 1.5 1.4 1.3 1.2 94 92 90 88 86 84 82 80
Scatterplot of vitro 2 vs vivo
vivo
vi
tr
o
3
2.1 2.0 1.9 1.8 1.7 1.6 1.5 1.4 1.3 1.2 94 92 90 88 86 84 82
Scatterplot of vitro 3 vs vivo
Figure 5: Atenolol correlation at pH (4.5) Figure 6: Atenolol correlation at pH (6.8)
By applying analysis of variance (ANOVA) for the dissolution data using MINITAB 14 we concluded that the test products are bioequivalent to reference products of Atenolol and could be interchangeable.
ACKNOWLEDGEMENT
The authors are thankful to wish to Azal Industries, Khartoum, Sudan, for providing the gift sample of Atenolol (standard).
AUTHOR’S CONTRIBUTION
The manuscript was carried out, written, and approved in collaboration with all authors.
COMPETING INTERESTS
The authors declare that they have no competing interests.
REFERENCES
1. El-Gindy A, Emara S, Mostafa A. HPLC and chemometric
assisted spectrophotometry method for simultaneous
determination of atenolol, amiloride hydrochloride and chlorthaldine. IL Pharmaco 2005; 60:269-278.
https://doi.org/10.1016/j.farmac.2004.11.013
2. Bevinakatti LH, Banerji A. Lipase A. catalysis in organic
solvents. application to the synthesis of (R)-and (S)-Atenolol. J Org Chem 1992; 57(22): 6003-6005.
https://doi.org/10.1021/jo00048a040
3. Agon P, Goethals P, Van Haver D, Kaufman JM.
Permeability of the blood–brain barrier for atenolol studied by positron emission tomotography. J Pharm Pharmacol 1991; 43(8): 597–600.
https://doi.org/10.1111/j.2042-7158.1991.tb03545.x
4. Kudige N, Prashanth, Kanakapura B, Anal J. Sensitive
spectrophotometric determination of atenolol in
pharmaceutical formulations using bromate-bromide as an eco-friendly brominating agent methods chem. J Analyt
Meth Chem 2012; 20.https://doi.org/10.1155/2012/810156
5. Lalitha KV, Kiranjyoth R, Pama B. UV spectrophotometric
method development and validation for the determination of atenolol and losartan potassium by Q-analysis. Int Bulletin Drug Res 2013; 3(4): 54-62.
https://doi.org/10.4103/2229-4708.90364
6. BP2009 formulated preparation: specific monograph, 3,
Atenolol tab. https://doi.org/10.1016/j.hrthm.2019.01.024
7. International Conference on Harmonization of Technical
requirements for Registration of Pharmaceuticals for Human, ICH Harmonized Tripartite Guideline, and Validation of
Analytical procedure: Text and Methodology Q2
(R1).Current step version, Parent Guideline Dated27 October 1994, (Complementary Guideline on Methodology dated 6 November 1996 incorporated in November 2005).
https://doi.org/10.4103/0976-500X.162004
8. Mcpolin, Oona, Validation of analytical methods for
pharmaceutical analysis, copyright ©2009, Mourne Training Service, page 12 and page 1 and 73.
9. PanthagadaS, Kancherla S, Kandiboti L, Appapurapu AK,
Gutta S. Method development and validation of Atenolol in tablet dosage form by RP HPLC method. Int Res J Pharmacy, ISSN 2230-8407, 2012.
http://dx.doi.org/10.13040/IJPSR.0975-8232.8 (6).1000-10
10.UK Prospective diabetes study group, efficiency of atenolol
and captopril in reducing risk of macro vascular and micro vascular complication in type 2 diabetes :UK PDS 39.PMJ
1998:317:713-20. PMID: 9732338
11.Abdussleem K. Analytical method development and