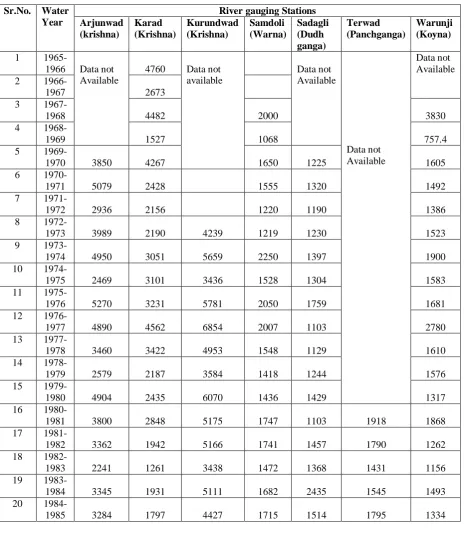
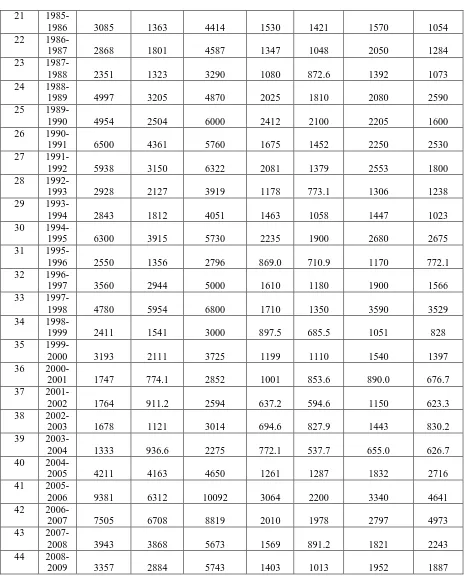
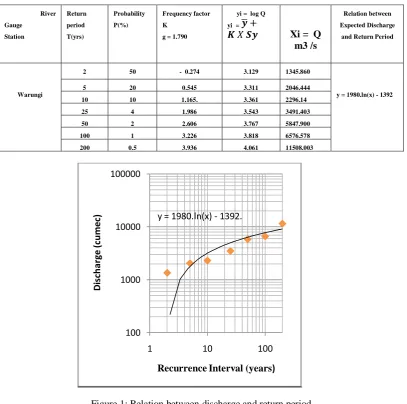
Flood Frequency Analysis of Upper Krishna River Basin catchment area using Log Pearson Type III Distribution
Full text
Figure

Related documents
Back to where he killed his last impala, the Newington male was seen sleeping in some long grass at Piccadilly Triangle.. We looked for him in the afternoon, but were unable
Line: 16 Item ID: 1000172594 Line Qty: 198 UOM: Each Description: Sweat Pants, Fire Fighter, Navy Blue, with logo, Size S-3XL. Item Specifications Manufacturer: Mfg
The work contained in this thesis has not been previously submitted to meet the requirements for an award at this or any other higher education institution. To the best of
For the case of typical refinements performed towards a point or an edge, the algorithm yields linear computational cost with respect to the mesh nodes for its sequential execution
The specificity index reflects the ability of a test to correctly identify individuals who do not have a mathematical learning disability.. The results for sensitivity and
Differentiated Storage Services is such a classification frame- work: I/O is classified in the computer system (e.g., filesys- tem journal, directory, small file, database log,
Stochastic volatility models, autoregressive conditional heteroscedastic (ARCH) and Generalized ARCH (GARCH) models can be used to capture and model the volatility
