©2016 Available online at www. worldessaysj.com ©2016 WEJ Journal
Study the Effect of Green Mixed Marketing
Programs on Performance of Production
Companies in Guilan Province
M.R.Gharib Ibrahim Saraei
1*, R.Doustdar Fashtekeh, K.Shahrodi
2, A.Jafar Nejad
31. M.A student of International bussines management, IAU, Rasht branch 2. M.A student of Tourism Planning, IAU, Rasht branch
3. PhD of Strategic business management & Professor Assistant of business management department, IAU, Rasht branch.
4. PhD of Industrial management and professor of Shahid Modarres University of Tehran ABST ARCT : Growing concern on stability of natural environment moved to completion fiels rapidly and directed companies toward seeking socts and benefits of green mixed marketing. We study a theoritical model which predicts the following (1) what is the role of green marketing programs on performance of companies. (2) what is the effect of risk aversion of senior managers on developing such programs. Analysis show that green marketing programs are run by companies, also green product and distribution program effect on market performance of the product positively; while prcing and promoting green methods deals with asset returs of company, positively. Finally, we found that risk aversion of senior managers leads to establishment of green marketing programs but act as a substitution for each of them, too. The main question is that how much green marketing is effective for Iranian companies and is there any relation between green marketing and sales increase? Our goals in this research are as follows: using environment while mainteninf energy resources, reducing pollution and garbage, study green pricing and More benefits for consumers and suppliers, reducing carbon emission in distributuin activities from supplier to the customer, increasing market portion for companies with green efforts and prodcung minimum wastes in green products. The research is applied one and the method is descriptive-survey. Statistic population includes all production companies located in industrial towns of Guilan province (210 companies). Samples were selected via available population sampling method. The main data gathering tool was questionnaire and data were analyzed using structural equation modeling techniques. Results show that gathered data were not normally distributed, thus softwares such SPSS and Smart PLS were used for analyzing in form of a structure model.
Key words: green marketing, company performance, risk aversion, highly competitive INTRODUCTION
Green marketing is one of the management fields related to environment and it seems all consumers, even individuals or industrial, are became more aware and interested in environment. Green marketing, also known as stable marketing, is an interesting event that in developing countries are foolws by retailers.
A research, in 1992, shows that for 93% of people environmental side effects of a product are important while shopping. In 1994, researchers reported that 42% of European consumers choose products based on their environmental performance and 27% in Enland choose products with environmental compatibility higher that 25%. (Rex , Emma and Baumann , Henrikke, 2007, p 568). Green products industry, in 2006, estimated to be more than 200 bilion dollar. (Gupta . Shruti and Ogden , Denise, 2009, p 376) Production of ecologically safer, reusable packaging and possible degradation, pollution control and oversight and operations that require more savings in energy, including ways that the Company resorted. (Kotler, Philip and Armstrong, Gary, p 853)
Problem statement
15 have been conducted to date, several methods have been widely adopted and has published in professional journals. So managers about whether the financial practices of green marketing concept and strategy companies can establish themselves or not, and that its continuation may have an impact on the answers to these questions or not, not intelligence. Secondly, even if companies are eco-friendly marketing programs, is far from being comprehensive, limited number of previous studies in this area has identified several external factors (eg Concern (interest) people, pressure monitoring), but the number of relatively few internal factors (eg, senior management commitment), this process will result. We've detected experimentally Jdydra also internal factors that have been widely ignored, we have evaluated the risk aversion senior managers Our review suggests that information gaps and provides two major contributions. First, to assess the effect of product market performance and return on assets (return on investment) eco-friendly, pricing, distribution, and promotion of pay. Found that green marketing programs, you can transfer the interests of financial performance and market the product. However, these benefits can vary within different green marketing campaign to show the key role of reputation in terms of the relations industry environment, we've detected.
Second, evidence of the critical role of risk aversion senior managers have invested in the establishment of green marketing programs. In addition, we examined the interactions. Our findings also show that risk aversion senior managers, to provide green marketing programs, will be replaced. Although both the potential in the company's response to the challenges of environmental understand how important it is, none has been the subject of previous empirical evaluation. Most importantly, the findings suggest that green marketing managers interested in trying their companies, need to adopt different methods based on the availability of free financial resources, competitive pressures in the marketplace, senior managers have a level of risk aversion. Our sustainability research with a brief review of green marketing and green marketing plan to draw from this case, we start. Then, the theoretical basis of our research model and hypotheses to explain the key relationships diagnosed, we expand. Then describes the research methods, presenting the results of the evaluation of hypotheses and discussion of theoretical and practical implications, are discussed. Finally, we consider the limitations of the study and future research identifies promising ways Dhym.az a full structural model, was conducted to test our hypotheses. We placed an average term mutual relationship to ensure unbiased estimates of parameters and multiple reduction potential, have used. (Lyvnydv et al., 2012) and the population of this study includes all Shrkt¬¬Hay actual production in the industrial towns Gilan Province, which is the number includes 210 companies.According to the above question this study was to evaluate the performance of the company's green marketing mix programs.
The necessity and importance of research
While environmentalists advocate the benefits of the natural environment in green marketing practices, many managers are still not convinced that such investments can be financial and strategic sense for the company to have. Our review model green marketing programs developed and offers an empirical evaluation of the model. Our results indicate that green companies that their marketing plans, they can realize market yield positive results.economic country also hoped to produce green products. (**** et al., 2012)
Research Goals
Protect and benefit the environment by using energy conservation and reduce pollution and waste for health Byshtrjamh
Check the pricing Green and greater benefit to consumers and suppliers of business The decrease of carbon emissions in distribution activities from the supplier to the customer Increase market share for companies that are green efforts
on manufacturing, green products produced at least waste
Theoretical Framework of Research
The theoretical framework is a conceptual model based on theoretical relationships between a numbers of factors that have been diagnosed with the importance of research on the issue. In summary, the theoretical framework of the affinities between variables that are finally involved in the dialogue examined the dynamics of the situation.( Uma Skaran, 1392 , P81)
16 Secondly, the most extensive study of green marketing, your theory of the concept of stakeholder theory, is derived. Our results suggest that the interests of the various stakeholders in the dispersion is generally assumed, is not. Our findings suggest that the presence of green marketing programs, benefits, at least for executives (senior managers and risk aversion return on investment), customers (the product market) and shareholders (return on investment) with respect to the natural environment , to have. As a rule, active interest in the environment, may be associated with an extension in which green marketing programs, transfer of benefits to the environment.
Thirdly, our results, the potential value of simultaneous evaluation of the different elements of the marketing program shows that may focus on one aspect of a marketing plan or marketing of a multidimensional or global scale is used. Our analysis shows: While relatively strong positive relationships among the four minor marketing program (Table 2), any marketing program, you can have different predictions and results differently under different conditions. So theorizing and empirical work on environmental marketing strategies, it is likely possible.(Lionido et al, 2012)
This exploratory research and field work (details in Methods), we assume that a review of previous cases and emergence performance effects of each of the aspects of the marketing mix, there may be a deeper attitudes towards marketing programs threats, as create a single structure. For example, some elements of marketing programs, may be greener than others, visibility and ease of a green marketing plan elements (and the resulting simulations), may be different. So green individual elements marketing programs, may have different costs and benefits, and a marketing application may also be components that are more green than in other cases. Check green marketing programs, it is possible to show the possibilities. So the effects differently expressed in their reviews and we were tentative as a problem.(Lionido et al, 2012)
Dependent variables in this study included the company's performance include: environmental performance, economic performance, operational performance, organizational performance and the independent variable which contains a mixture of green marketing, green marketing and environmental efforts in design, promotion, price and distribution products that do not harm the environment explains.
Chart 1: Research Conceptual Model
Research Background
Corporate investigated and found that independent risk aversion leads managers to adopt green marketing programs. But each also serves as an alternative.
RESEARCH METHOD
17 statistical samples, the sampling of available are used, the subjective choice of Hych¬Gvnh there before. Since the study population in certain (limited) and the scale of quantitative data from the sample (eq 3-1) are used to determine sample size. (Azar and momeni, 1384, p12)
N: sample vplume S: Standard deviation ε: precision estimation N:statistic population
In this study, using questionnaires distributed to 30 primary (initial samples), the estimated standard deviation of the population was calculated (0.436). ε is precision estimation between 0.1 to 0.01. Here the value calculated is 0.05. Also,
z
2
is selected from normalized destributuin table (
0.05
) and is equal to 1.96. Assuming above, sample volume will be
2 2
2 2 2
Sampling formula, the number of samples to show 122 manufacturing company to address the effects of missing and incomplete questionnaires and non-answered questions by managers and technical experts on the study estimated about 20 percent by volume, additional questionnaires distributed among managers and technical experts and finally 140 valid questionnaires were selected for the analysis of data. Structural equation modeling techniques were used to analyze the data and all analyzes were performed using SPSS and PLS Smart.
Green Product
Green refers to a product that environmental and social performance in the production, use and disposal compared to other competing goods is significantly improved. In other words, the green products that will not harm the environment and also contains elements that are potentially harmful to the environment, green products, by definition, are products with such criteria: usability has been designed, assembled and have re-production and re-production of the materials used which could be recycled. In terms of energy consumption efficiency and cause less environmental pollution than other goods and in general terms it can be defined as products that cause less environmental damage. A number of researchers in the green Khvdkalahay studies have been divided into several categories, including public green products, recycled paper products, products that are not tested on animals, environmentally friendly products, gases, ozone layer and products that are compatible with the energy-efficient. Given the discussion above, a green products according to the criteria outlined in Table 1 it can be reviewed.
Table 1: Green Product criteria
Green marketing mix Evaluation criteria
Green product
1) Contain elements that are not harmful for the environment 2) is Energy consumption efficient
3) is made from materials that can be recycled
4) Its production process is environmentally friendly. 5) causes less environmental pollution
ref: H. Ranari. K, A. Yari. B (1390)
According to the table (2) Average rating of Green Product is 3.69, with a standard deviation is 0.82. The lowest score of green product is 1 and maximum is 5 points.
Table 2: describing green product variable
Variable No Average Stv Var
Skewness Elongation
Min Max
statistic Standard
error statistic
Standard error
18 Chart2: Green Product Histogram
Advertising (Promotion) Green
Banerjee, has defined green propaganda as ads that have at least one of these criteria: 1) express clearly or implicitly the relationship between a product or service environment. 2) promote a green lifestyle. 3) express the company's environmental responsibility.
Table3: describing green promotion
Variable No Average Std Var
Skewness Elongation
Min Max
statistic Standard
error statistic
Standard error Green
promotion 140 3.73 0.60 0.36 -0.11 0.20 -0.58 0.40 2 5
Chart 3: Green Promotion Histogram
Green Price
Some belive that green price is defined as setting prices for green products so that the consumers' sensitivity to cost and his willingness to pay more for environmentally friendly goods to be balanced. Various studies indicate the importance of price in purchasing and he is satisfied.
Table4: describing green price variable
Variable No Average Std Var
Skewness Elongation
Min Max
statistic Standard
error statistic
Standard error
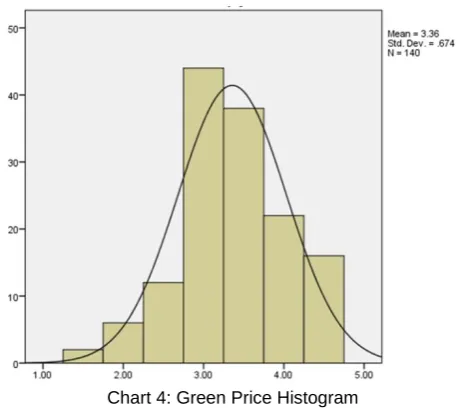
19 Chart 4: Green Price Histogram
Green Distribution
Environmental products will increase and therefore constantly to meet the environmental demands will be studied. The natural environment as a result of local and global environmental problems in recent years, trade has become a challenging issue for the organization. It is believed that the activities of the business such as sourcing, production and transport are responsible for this fact. .tbq studies have claimed that most customer’s products companies that are accused of environmental pollution will not buy. In fact, companies that do not comply with environmental regulations and those who seek to misuse of environmental issues are to increase your sales, customers sanctions were qrarkhvahnd. In this regard, the measures that companies can apply toward greening its distribution system are as follows:
Table 5: Measure of Green Distribution
Green marketing mix Measures
GREEN DISTRIBUTION
1) Efficient use of the available space.
2) Use of a new fleet of transport and ecological be effective. 3) Using green fuels such as fuel that is low in sulfur content as well as the use of
alternative fuels such as liquefied natural gas.
4) Using rail and marine transportation of bulk cargo. 5) Encourage people to economical driving to reduce fuel waste
ref: H. Ranari. K, A. Yari. B (1390)
Table6: Describing Green Distribution Variable
Variable No Average Std Var
Skewness Elongation
Min Max
statistic Standard
error statistic
Standard error Green
distribution 140 3.71 0.78 0.61 -0.72 0.20 -0.09 0.40 1.5 5
Chart 5: Green Distribution Histogram
20 technologies, have to. Companies that have green marketing programs, may be expanded relationships with the government and regulation (regulators) enjoy, which may reduce the cost of compliance with environmental regulations such as spending for it. Such companies may risk reducing environmental commitment, potentially limiting their respective insurance and legal costs and even reduce the cost of investment. As far as the principles of sustainability is important for employees, companies with green marketing programs, may increase employee morale, improve output as well as the expansion of production capacity, can benefit. Green marketing programs, may lead to higher returns. As previously mentioned, as well as green marketing programs, product performance and expand the market, the increase in unit sales as well. Green marketing programs may enable companies to create higher prices to customers, without reducing demand, provide, which in turn can lead to higher sales revenue.
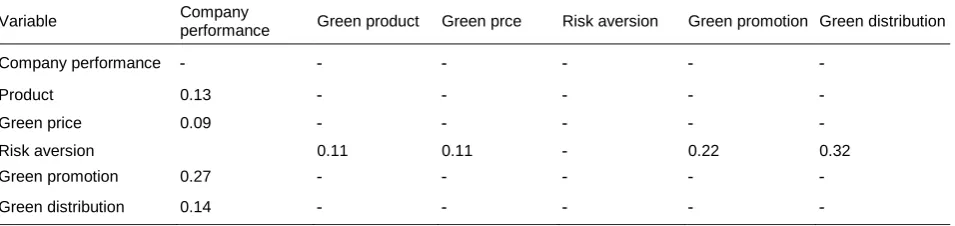
The effect of each independent variable on the dependent variable, for example, the effect of risk aversion on green products, promote green and green distribution, are 0.11, 0.22 and 0.32, respectively.
Table 7: rout coefficient of variables
Variable Company
performance Green product Green prce Risk aversion Green promotion Green distribution
Company performance - - - -
Product 0.13 - - - - -
Green price 0.09 - - - - -
Risk aversion 0.11 0.11 - 0.22 0.32
Green promotion 0.27 - - - - -
Green distribution 0.14 - - - - -
Research Findings Statistics
For the purpose of inferential statistics in this study, the normality of the data was analyzed using Kolmogorov-Smirnov test. The results of these tests indicate that are not normally distributed, collected data and analyze them in the form of a structural model for designing the PLS method used.
Data from measurement and structural model regression test separate hypothesis presented here and are as follows:
First hypothesis: the risk aversion of senior managers, the establishment of green product programs has a positive effect.
According to the results of the evaluation of the structural model to study the relationship between risk aversion of senior management and deployment of green product programs, it could be said that the coefficient of this relationship (β=0.11) and a significant number of (t=2.01) obtained that this amount 0.05 level is significant. They are therefore confirmed the first hypothesis. The risk aversion of senior managers to deploy application-green product has a positive effect. Given the amount of variance explained (R2) it could be said that a one percent increase in risk aversion variables senior managers, the establishment of green product programs, increased one percent.
The second hypothesis: Risk-averse senior management, green has a positive effect on pricing.
According to the results of the evaluation of the structural model to study the relationship betweenSenior management and pricing of risk aversion green, it could be said that the coefficient of this relationship ( β=0.11) and a significant number of (t=2.14) obtained that this amount at 0.05 is significant. They are therefore confirmed the second hypothesis. Green pricing has a positive effect on the risk aversion senior managers. Given the amount of variance explained (R2) it could be said that a one percent increase in risk aversion senior executives variable, green pricing, increased one percent.
The third hypothesis: Risk-averse senior management, the establishment of green distribution programs has a positive effect.
21
The fourth hypothesis: Risk-averse senior management, the establishment of programs to promote green has a positive effect.
According to the results of the evaluation of the structural model to study the relationship between Risk aversion senior managers and the establishment of programs to promote green, it could be said that the coefficient of this relationship (β=0.22) and a significant number of (t=4.24) obtained that this amount in 0.01 level is significant. The fourth hypothesis confirmed by GME. The risk aversion of senior managers to promote the establishment of green programs had a positive effect. Given the amount of variance explained (R2) it could be said that a one percent increase in risk aversion variables senior managers, the establishment of programs to promote green, 5% increase
Fifth hypothesis: the establishment of programs for green product has a positive effect on firm performance.
According to the results of the evaluation of the structural model to study the relationship between the establishment of a green product programs and performance, it could be said that the coefficient of this relationship (β=0.13) and a significant number of (t=2.25) obtained that this amount at 0.05 is significant. The research confirmed the hypothesis fifth flora. The establishment of programs for green product has a positive effect on firm performance.Given the amount of variance explained (R2) it could be said that a one percent increase in variable deployment of green product plans, performance increases 19%
Sixth hypothesis: green pricing has a positive effect on firm performance.
According to the results of the evaluation of the structural model to study the relationship between green pricing and performance, it could be said that the coefficient of this relationship (β=0.09) and a significant number of (t=1.90) obtained the amount of the 0.05 is not significant. They are the sixth research hypothesis is rejected.
The seventh hypothesis: the establishment of distributed applications Green has a positive effect on firm performance.
According to the results of the evaluation of the structural model to study the relationship between green distribution programs and the establishment of corporate performance, it could be said that the coefficient of this relationship ( β=0.14) and a significant number of (t=4.96) obtained that this amount at 0.01 is significant. The research confirmed the hypothesis seventh flora. The deployment of distributed applications Green has a positive effect on firm performance. Given the amount of variance explained (R2) it could be said that a one percent increase in variable deploy distributed applications Green, performance increases 19% .
Eighth hypothesis: the establishment of programs to promote green has a positive effect on firm performance.
According to the results of the evaluation of the structural model to study the relationship between the establishment of programs to promote green and firm performance, it could be said that the coefficient of this relationship (β=0.27) and a significant number of (t=2.26) obtained that this amount at 0.05 is significant. The study confirmed the hypothesis eighth flora. The establishment of programs that promote green has a positive effect on firm performance. Given the amount of variance explained (R2) it could be said that with the establishment of a percent increase in variable distribution of green programs, 19% increased performance.
CONCLUSION
22 less likely to have welcomed the strategic approach of green marketing. Having said that green marketing can be achieved before significant results, it requires, time, commitment and resources.
REFERENCES
Azar, Adel and Momeni, Mansour (1384), statistic and its application in management, Samt pub, Tehran, 8th edition, 2nd vol, p 72.
Chandra , Ramesh (2013) , Rath An Impact of Green Marketing on Practices of Supply Chain Management in Asia: Emerging Economic Opportunities and Challenges, International Journal of Supply Chain Management
Eric S.W. Chan, (2013) Managing green marketing: Hong Kong hotel managers’ perspective , International Journal of Hospitality Management ( Elsevier )
Eunju Ko, Yoo Kyung Hwang, Eun Young Kim(2013 ) Green marketing' functions in building corporate image in the retail setting- Journal of Business Research ( Elsevier )
Gupta . Shruti and Ogden , Denise T, (2009), To buy or not to buy? A social dilemma perspective on green buying, Journal of consumer marketing
Katler, Philip & Armstring, Garry (1385), Marketing Principles, Tranlated by Bahman Foroozandeh
Kumar Ramesh and Rakesh (2013) , Green Marketing: Reality or Greenwashing., Asian Journal of Multidisciplinary Studies
Mohammad Yunus , Mohammad Toufiqur Rahman (2014 ) Green marketing to create awareness for the green consumer
N. Leonidou & Constantine S. Katsikeas & Neil A. Morgan (2012) ,Greening” the marketing mix: do firms do it and does it pay off
Rex, Emma and Baumann , Henrikke , (2007), Beyond ecolabels: What green marketing can learn from conventional marketing, Journal of cleaner production