Conceptual Model for the Generation
of Performance Measures in
Manufacturing Firms
Luis E. Quezada, F. Córdova, P. Palominos
Department of Industrial Engineering, University of Santiago of Chile, USACH Santiago, Chile
Email: [email protected]
Christopher O’Brien
School of Business Studies, University of Nottingham Nottingham, United Kingdom Email: [email protected]
Abstract
This paper shows a conceptual model for the generation of performance measures in manufacturing fi rms. The conceptual model is based on a hierarchical approach for for-mulating manufacturing strategies in small and medium enterprises, which structures the process as a hierarchy and links the levels using tools of the Analytic Hierarchy Process (AHP). The original model consists of 4 levels: (a) the well-being of the company, (b) strategic objectives, (c) strategic business units, (c) critical success factors and (d) manufacturing decision area. This model includes the four perspectives of the Balanced Scorecard, as follows. The fi nancial perspective is included in the strategic objectives, the customer perspective is included in the critical success factors and the process perspective and innovation & development perspective are included in the manufacturing decision areas. In this way, the same hierarchical model for formulating a manufacturing strategy can be used as a tool for generating performance measures. The main contribution of this work is that it provides with a systematic mechanism for generating performance measures. It also allows the assignation of weights to the measures created, using a well known and proved process as AHP.
INTRODUTION
Manufacturing strategy has been a concept and an area of study since the early work by Skinner (1969). However, the large of approaches that have been described in the literature has created some confusion regarding the way the strategy is formulating. This article refers to the way the manufacturing strategy is formulated and the way performance measures are defi ned in order to evaluate the strategy and the operation of the company. The formulation of a manufacturing strategy is a process, by which the company establishes their long term objectives of the manufacturing function, defi nes action plans and allocates resources to achieve those objectives (Wheelwright, 1978).
Taken the structure of the hierarchical model of a manufacturing strategy proposed by Quezada et al. (2003) is possible to identify the four perspectives of the Balanced Scorecard developed by Kaplan and Norton (1990) to produce performance measures at a strategic level. The perspectives are Financial, Clients, Internal Processes and Learn-ing & Development. This latest perspective can be incorporated from the contribution of Platts and Maslem (1997), who argue that, apart from the traditional manufacturing decision areas of structure and infrastructure, the management of human resources should be considered separately of the others. Give this comparison as a starting point; it is possible the generation of performance measures to control the organization under the dynamic scenario that the environment presents.
This work aims at developing a methodology to generate and select performance measures for the manufacturing area. The proposed methodology is a combination of the model for formulating manufacturing strategies proposed by Quezada et al. (2003) and the Balanced Scorecard proposed by Kaplan and Norton (1990). The methodology attempts to fi ll the gap between the theory and the practice in the area.
PERFORMANCE MEASUREMENT IN MANUFACTURING
The subject of performance measurement has attracted a lot of attention recently in the business and manufacturing literature, even it if is not new. Neely (1999) states that between 1994 and 1996 some 3,615 articles were published. He states that perfor-mance measurement is still on the management agenda. He also argues that there are four basic questions that research in business performance seeks to address: (1) What are the determinants of business performance?, (2) How can business performance be measured?, (3) How to decide which performance measures to adopt? and (4) How can the performance measurement system be managed?.
measures of performance, but to give some guides to the process of designing a measure-ment system. What is surprising is that for managers it is easy to decide what should be measured. What is diffi cult for them is to reduce the number of measures to a set that is manageable and useful. It is very easy to decide which measures of performance to use, but this does not means that they are the right measures. One relevant aspect for this project is that these authors emphasize the need to do more research in the case of small of small and medium sized companies, where performance measurement system are considered as a luxury. A large number of studies, such as those undertaken by Blenkinsop and Burns (1992), Dummond (1994) and Evans (2004) attempt to relate external and internal variables with the management control system, but they do not study the generation of performance indices in manufacturing.
In the same way, Gomes et al. (2004) make a very good literature review of manu-facturing performance measures and measurement. They reviewed 388 articles from relevant journals, 144 papers from conference proceedings and some relevant books. They considered the literature published from 1988 to the end of 2000. They make an historical analysis, presenting some criticisms to the early approaches and the perfor-mance measurement systems that have been developed in response to those criticisms. They point that among those systems, the Balanced Scorecard is the most cited, even though it has also been criticized. In their study its is possible to observe the evolution of performance measures and measurement, going from individual measures consider-ing a company as a close system to performance measurement systems that look at the company in an holistic way.
Melnyck et al. (2004) argue that in spite of the importance of the performance mea-surement little research has been undertaken in the area of operations management. In the same way, they state that performance measurement continues being a challenge both for managers and researchers.
A different literature survey was developed earlier by White (1996), who attempts to produce taxonomy of strategy-related performance measures for manufacturing. He emphasizes that in most of the cases the performance measures are orientated to the achievement of “competitive priorities”, such as cost, quality, fl exibility and delivery. The taxonomy classifi es the 125 indicators into the following types: competitive capa-bility, data source, data type, reference and orientation. After the analysis, the author concludes that performance measures is a topic of considerable current interest both practitioners and academics, but the fi eld remains unstructured, with no framework for evaluating performance measures.
THE METHODOLOGY FOR FORMULATING A MANUFACTURING STRATEGY USING AHP
The methodology for formulating manufacturing strategies presented here was devel-oped by Quezada et al. (2004). It is orientated to MSEs and it is based on a quantitative approach and takes advantage of the hierarchical structure of the traditional conceptual model for manufacturing strategies.
It uses some concepts of strategic planning, which are the following:
Strategic Business Unit (SBU). It is an organizational unit which can be managed more or less independently from other units. To operasionalize the concept, the defi nition given by Widmer (1997) is used, which establishes that a SBU is a pair Product-Market Segment with homogeneous characteristics.
Critical Success Factors (CSF). They correspond to those characteristics of a good or services that are considered by the customer to make the decision of selecting the vendor. Hill (1985) calls them Order Winning Criteria.
The methodology represents the process in a hierarchical way:
Level 0: This level corresponds to the welfare of the company.
Level 1: This level includes the long term objectives of the fi rm.
Level 2: This level corresponds to the Strategic Business Units of the fi rm.
Level 3: This level corresponds to the Critical Success Factors of each SBU.
Level 4: This level represents the manufacturing decision areas.
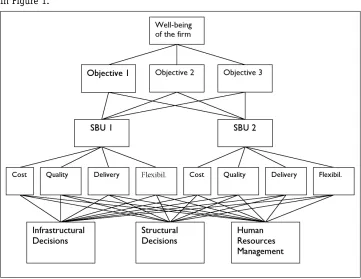
The manufacturing decision areas are: facilities, capacity, process & technology, scope of process, quality management, control systems, human resources management, supplier’s management and product design. They were taken directly from the litera-ture (see for example, Wheelwrigth (1978), Schroeder (1990), Hill (1985) and Platts (1990)). For the purpose of this work, they are classifi ed into two main areas: structural and infrastructural. The fi rst main area includes the fi rst four manufacturing decision areas and the second main area includes the rest of them, with the exception of hu-man resources hu-management, which is treated independently, as proposed by Platts and Maslem (1997).
in Figure 1.
Figure 1: Hierarchical Model for Manufacturing Strategy (Adapted from Quezada et al. (2003).
GENERATION OF PERFORMANCE MEASURES
From the work carried out by Kaplan and Norton (1990), an organization can be seen from four perspectives: Finances, Customers, Internal Processes and Innovation & Learning.
Performance measures are defi ned for each perspective, specifying the objective pursued their targets, the strategic initiatives to achieve the objectives and the actual results obtained. It is important to point out that the objectives must be related to the vision, mission and strategies of the fi rm.
At this point, the methodology proposed by Quezada et al. (2003) for formulating manufacturing strategies and the perspectives of the Balanced Scorecard approach are analyzed to try to establish a formal relationship between them. A relationship is for-malized in order to defi ne performance measures in manufacturing.
Financial Perspective: What do the shareholder expect from the fi rm?
The fi nancial perspective is directly related to the objectives of the company or the scale of value of the owner(s) or directory. In other words, the fi nancial perspective is related to the Level 1 of the hierarchy presented in Figure 1. The objectives established in Level 1 will serve as a basis for the decisions to be made in the other perspectives. The hierarchical model is wider in the sense that not only the fi nancial criteria are considered, but the scale of values as well.
Customer Perspective: What aspects of the relationship with customers do determine the fi nancial results?
In order to achieve the fi nancial performance desired by the company, it is funda-mental to have satisfi ed and loyal clients. With this objective in mind, the relationship with clients and the expectations they have about the company are measured.
This perspective takes into account the main elements that generate value to the clients, in order to focus the company only on key processes. The main elements of the product or service make the customer select the company and order them. According to these characteristics, this perspective is related to the Level 3 of the hierarchy, which includes the critical success factors of each SBU.
Internal Processes Perspective: What are the internal processes in which we must be out-standing to satisfy our customers?
Taken into account the marker the objectives of the company and the market(s) in which the company is participation, the key internal processes of the organization are identifi ed. It is important to orientate the efforts to achieve the excellence of the product and services required by customers, keeping in mind the vision of the company.
The internal processes perspective is related to the manufacturing decision areas (Level 4 of the hierarchy), because it includes all the manufacturing processes (struc-tural and infrastruc(struc-tural). The struc(struc-tural processes include those related with the actual manufacturing process, while the infrastructural processes include those related to management elements.
Innovation & Learning Perspective: What do we have to do to develop the human resources to achieve the excellence in our key processes and to achieve the vision?
This perspective is the driver of all the previous perspectives of the balances Score-card and it reveals the knowledge and capabilities that the company has to develop the products and services, as well as for changing and learning.
and training, which are related directly to the growth and learning of the organization. Therefore, the manufacturing decision areas of Structure and Infrastructure are related to the Internal Processes Perspective and the Human Resources Management is related to Innovation & Learning Perspective.
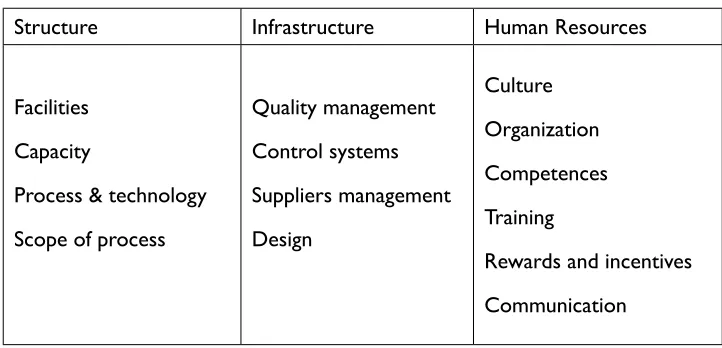
Then, the Level 4 that corresponds to the manufacturing decision areas can be divided into the following categories:
Table 2: Manufacturing decision areas for the creation of capabilities (level 4)
Structure Infrastructure Human Resources
Facilities
Capacity
Process & technology
Scope of process
Quality management
Control systems
Suppliers management
Design
Culture
Organization
Competences
Training
Rewards and incentives
Communication
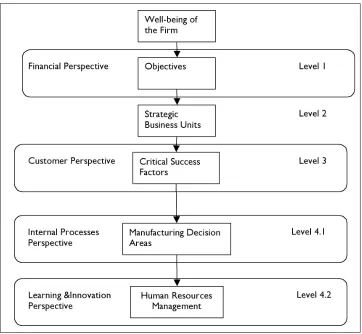
After having established a relationship between the perspectives of the Balanced Scorecard and the hierarchical model for formulation of manufacturing strategies, it is possible to present the conceptual model for the generation of performance measures in manufacturing.(Figure 2, on next page)
It is important to note one difference between the model hierarchical model of Figure 1 and the conceptual model of Figure 2. In the fi rst case, the area of human resources management is in the same level of the manufacturing areas, but it the last case; it is located in a lower level. This is because it was intended to be consistent with the BSC approach, in which the human resources are part of the learning perspective, which is the lower one. It is also mentioned that the directions of the arrows in Figure 2 are related to the hierarchical process, in which they have a meaning of dependence, which is different from the case of the BSC where they represent infl uence.
The process for creating the manufacturing performance measures is:
1. Formulation of a Corporate/Business Strategy • Defi nition of Mission and Vision.
• Assignment of weights to Objectives (using AHP) • Identifi cation of strategic objectives.
• Identifi cation of Strategic Business Units • Identifi cation of Critical Success Factors
• External Analysis of Strategic Business Units
• Assignment of weights to Strategic Business Units (using AHP) • Assignment of weights to Critical Success Factors (using AHP)
2. Evaluation of Manufacturing Decision Areas
• Assignment of weights to Manufacturing Decision Areas (using AHP) • Identifi cation of strategic objectives for Manufacturing Decision Areas
• Generation of performance indicators for decision areas
3. Evaluation of Human Resources Area
• Assignment of weights to Human Resources Management Area (using AHP) • Identifi cation of strategic objectives for Human Resources Management Area
• Generation of performance indicators for Human Resources Area.
The question that arises is: How to generate the performance indicators?. The fol-lowing procedure is suggested:
• Produce an assessment of every manufacturing and human resources manage-ment area regarding the degree they support the achievemanage-ment of the critical success factor. It is suggested to use a -2 through 2 points Likert scale.
Let xij the support given by area i to critical success factor j (using a Likert scale).
• Let aij the weight of the area i in relation to critical success factor j, which is estimated using the AHP tools.
• Prioritize the areas by (a) the value aij in an ascending way or by (b) the term aij xij in a descending way. In the fi rst case, it is given higher priority to those areas which are more important (higher weight). In the second case it is given a higher priority to those areas in which have more importance and have lower performance.
• Select those areas that are more important, according to the priory given in the last step.
• Defi ne strategic objectives for those selected areas.
• Once the strategic objectives for the manufacturing decision areas and the human resources management area have been identifi ed, the performance indicators are defi ned according to the Balance Scorecard approach.
It should be noted that the strategic objectives are only defi ned for the manufactur-ing area and the human resources management, because the objective of the conceptual framework is only to produce performance measurements for the manufacturing area. However, it is also possible to defi ne strategic objectives for the long term objectives and critical success factors using the same procedure.
SELECTION OF PERFORMANCE INDICATORS
The process described above may lead to a large number of performance measures. Considering the suggestion made by Kaplan and Norton (2000) that each perspective should contains only 4 to 6 measures, a procedure to reduce the number of them is proposed. However, for the case of the internal processes 4 to 6 measures will be con-sidered by manufacturing decision area. This is because; the aim is not the generation of performance measures exclusively at a strategic level.
multi-attribute rating technique (smart) to select performance measures. They argue that it the smart technique is better than the analytic hierarchy process (AHP). In spite of the criticisms they argue, AHP is used in this work to select indicators, to be consistent with the methodology to formulate manufacturing strategies and because AHP has a solid scientifi c base.
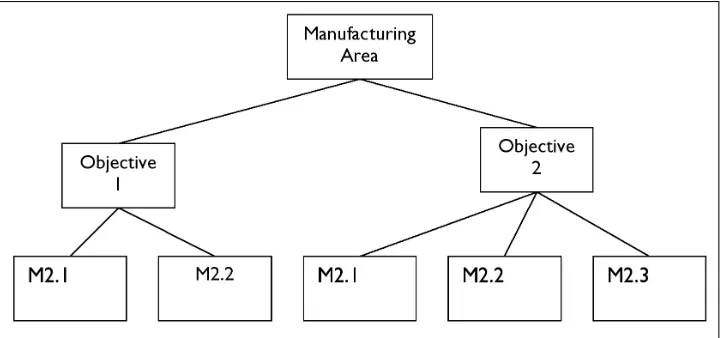
Once a set a measures is obtained for each perspective, a weight is assigned to each measure using a pair wise comparison. To do the comparison, the right question to ask is: How much important is indicator X than indicator Y for measuring the objective Z? Z is a strategic objective in the framework defi ned by Kaplan and Norton (1990).
A hierarchical model is built, as shown in Figure 3. The nodes referred as M, repre-sent measures. The model allows the selection of those performance measures with a high global weight.
Figure 3: Hierarchical Model for the Selection of Performance Measures.
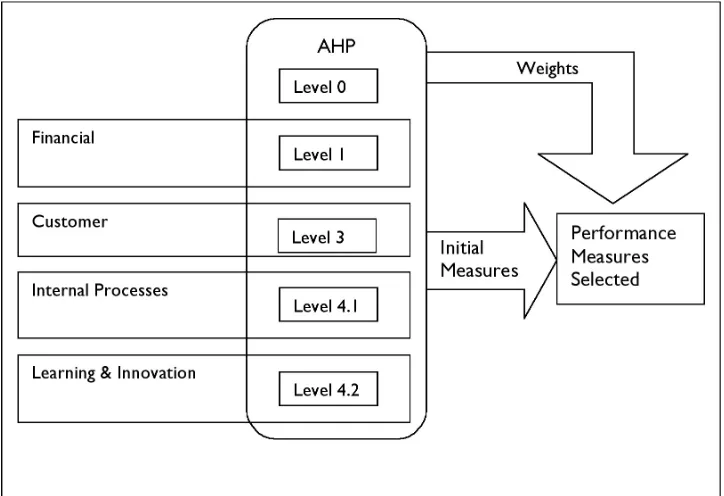
Finally, an explicative framework covering the complete conceptual model is depicted in Figure 4. It shows the relationship between the AHP model and the 4 perspectives of the Balanced Scorecard.
Figure 4: General Description of the Methodology
CONCLUSIONS
This research has led to the formulation and selection of manufacturing performance measures. This allows a practical approach for the manufacturing companies to determine performance indicators for the manufacturing area for controlling and managing their key external and internal processes.
The conceptual model developed is a combination of a methodology for formulating a manufacturing strategies and the Balanced Scorecard. They are used to generate an initial set of performance measures.
The Analytic Hierarchy Approach is used to select a reduced number of measures, in order to obtain a number of them that can be managed by the people in charge.
The work presented here is only a conceptual model. It does not attend to propose a new approach, but to create a practical tool to produce manufacturing performance measures.
is not necessary true. For example, the achievement of one objective may infl uence the achievement of other objective of the same level. In fact, those types of relationships are admitted by the Balanced Scorecard and are incorporated in what Kaplan and Norton (2000) call Strategic Maps. A tool that would solve this situation is the Analytic Network Process (ANP) which was also developed by Saaty (1996b). In this contest, Yurdakul (2003) proposes a model based on ANP to measures the performance of manufacturing. However, it considers pre-defi ned performance indicators, so the paper describes a way of assigning priorities to given indicators and a way to construct them is not presented.
If the process described is carried out regularly, the weight of the manufacturing and human resources areas may change, which means that the performance indicator may change. This means that the performance indicators used will vary along the time.
ACKNOWLEDGEMENTS
This project was supported by The University of Santiago of Chile (DICYT-USACH). We also would like to thank the postgraduate students Luis Valdivia and Jorge Zamorano for their valuable suggestions.
REFERENCES
Blenkinsop, S. and Burns, N., (1992), “Performance measurement revisited”, Interna-tional Journal of Operations & Production Management, Vol 12, No 10, pp. 16-25. Dumond, E. J. (1994), “Making best use of performance measures and information”,
International Journal of Operations & Production Management, Vol 14, No 9, pp. 16-31.
Evans, R.E., (2004), “An exploratory study of performance measurement systems and relationships with performance results”, Journal of Operations Management, Vol 22, pp. 219-232.
Gomes, C.; Yasin, M. and Lisboa, J. (2004). “A literature review of manufacturing per-formance measures and measurement in an organizational context: a framework and direction for future research”. Journal of Manufacturing Technology Management, Vol. 15, Nº 16, pp. 511 – 530.
Hill, T. (1985). “Manufacturing Strategy”. London, McMillan Education.
Maslen, R. and Platts, K. (1997). “Manufacturing vision and competitiveness”. Integrated Manufacturing Systems 8/5, pp. 313 – 322, MCB University Press.
Melnyck, S.A., Stewart, D.M and Swink, M., (2004), “Metrics and performance measure-ment in operations managemeasure-ment: dealing with the metrics maze”, Journal of Opera-tions Management, Vol 22, pp 209-217.
Neely, A. (2006), “The evolution of performance measurement research: developments in the last decade and a research agenda for the next”, International Journal on of Operations & Production Management, Vol. 25, No 12.
Norton, D. and Kaplan, R. (1990). “The Balanced Scorecard”. Harvard Business School Press, MA.
Norton, D. and Kaplan, R. (2000), “Strategic Maps”, Harvard Business School Press, MA.
Platts, K. y Gregory, M. (1990). “Manufacturing Audit in the Process of Strategy For-mulation”. International Journal of Operation & Production Management, Vol. 10, Nº 9, pp 5 – 26.
Quezada, L.; Córdova, F. and O’Brien, C. (2003). “Application of the Analytic Hierarchy Process in Manufacturing Strategy Formulation”. International Journal of Industrial Engineering, Vol. 10, No 3.
Skinner, W., (1969), “Manufacturing - missing link in corporate strategy”, Harvard Busi-ness Review, May-June , pp. 136-145.
Saaty, T.L. (1996a). “The Analytic Hierarchy Process”. RWS Publications, 2º Edition.. Saaty, T.L., (1996b), “Decisions Making with Dependence and Feedback: The analytic
Network Process”, RWS Publications, Pittsburgh, PA.
Schroeder, R. y Lahr, T. (1990). “Development of Manufacturing Strategy: A Proven Pro-cess”. En J.E. Ettlie, M.C. Burstein & A. Fiegenbaum (Eds.), Manufacturing Strategy, Boston Kluwer Academia Publishers.
Valiris, G.; Chytas, P. y Glykas, M. (2005). “Making decisions using the balanced scorecard and the simple multi-attribute rating technique”. Performance Measurement and Metrics, Vol. 6, Nº 3, pp. 159 – 171.
Wheelwright, S. (1978). “Refl ecting Corporate Strategy in Manufacturing Decisions”. Business Horizons, Vol. 1, Nº 1, pp. 57 – 66.
White, G. (1996). “A survey and taxonomy of strategy – related performance measures for manufacturing”. Journal of Operations & Production Management, Vol. 16, Nº 3, pp. 42 – 61.
Biography
Luis E. Quezada is an associate professor at the Department of Industrial Engineering of the University of Santiago of Chile. His main research interests are in the areas of manufacturing strategies and operations management. He is particularly interested in development quantitative methodologies to support the formulation of manufacturing strategies.
Professor Felisa E. Cordova works for the Department of Industrial Engineering of the University of Santiago of Chile. Her main research interests are in the areas of knowledge management systems, automation and business strategies. Her current research interest is mainly in the area of knowledge management to support operations strategies.
Pedro Palominos is an associate professor at the Department of Industrial Engineer-ing of the University of Santiago of Chile. His main research interests are in the areas of fl exibility in manufacturing, product design and operations scheduling.