Congenital Heart Defects and Receipt of
Special Education Services
Tiffany Riehle-Colarusso, MD, MPHa, Andrew Autry, PhDa, Hilda Razzaghi, PhD, MSPHa, Coleen A. Boyle, PhDa, William T. Mahle, MDb, Kim Van Naarden Braun, PhDa, Adolfo Correa, MD, PhD, MPHc
abstract
BACKGROUND:We investigated the prevalence of receipt of special education services amongchildren with congenital heart defects (CHDs) compared with children without birth defects.
METHODS:Children born from 1982 to 2004 in metropolitan Atlanta with CHDs (n= 3744) were identified from a population-based birth defect surveillance program; children without birth defects (n= 860 715) were identified from birth certificates. Cohorts were linked to special educationfiles for the 1992–2012 school years to identify special education services. Children with noncardiac defects or genetic syndromes were excluded; children with CHDs were classified by presence or absence of critical CHDs (ie, CHDs requiring intervention by age one year). We evaluated the prevalence of receipt of special education services and prevalence rate ratios using children without birth defects as a reference.
RESULTS:Compared with children without birth defects, children with CHDs were 50% more
likely to receive special education services overall (adjusted prevalence rate ratio [aPRR] = 1.5; 95% confidence interval [CI]: 1.4–1.7). Specifically, they had higher prevalence of several special education categories including: intellectual disability (aPRR = 3.8; 95% CI: 2.8–5.1), sensory impairment (aPRR = 3.0; 95% CI: 1.8–5.0), other health impairment (aPRR = 2.8; 95% CI: 2.2–3.5), significant developmental delay (aPRR = 1.9; 95% CI: 1.3–2.8), and specific learning disability (aPRR = 1.4; 95% CI: 1.1–1.7). For most special education services, the excess prevalence did not vary by presence of critical CHDs.
CONCLUSIONS:Children with CHDs received special education services more often than children
without birth defects. Thesefindings highlight the need for special education services and the importance of developmental screening for all children with CHDs.
WHAT’S KNOWN ON THIS SUBJECT:Poor
neurocognitive outcomes are associated with some types of congenital heart defects (CHDs). Guidelines for developmental screening for children with CHDs have been published. Population-based information on special education services needed among children with CHDs is limited.
WHAT THIS STUDY ADDS:Children in
metropolitan Atlanta with congenital heart defects (CHDs) received special education services more often than children without birth defects. These findings highlight the need for special education services and the importance of developmental screening for all children with CHDs.
aDivision of Birth Defects and Developmental Disabilities, National Center on Birth Defects and Developmental Disabilities, Centers for Disease Control and Prevention, Atlanta, Georgia;bSibley Heart Center, Children’s Health Care of Atlanta, Emory University School of Medicine, Atlanta, Georgia;cDepartments of Medicine and Pediatrics, University of Mississippi Medical Center, Jackson, Mississippi
Dr Riehle-Colarusso conceptualized and designed the study, coordinated analyses, interpreted the results, drafted the initial manuscript, and coordinated all revisions asfirst author; Drs Autry and Razzaghi carried out the analyses and reviewed and revised the manuscript; Drs Boyle, Mahle, and Van Naarden Braun helped design the study, interpreted the results, and reviewed and revised the manuscript; Dr Correa conceptualized and designed the study, interpreted the results, and reviewed and revised the manuscript; and all authors approved thefinal manuscript as submitted.
Thefindings and conclusions in this report are those of the authors and do not necessarily represent the official position of the Centers for Disease Control and Prevention.
www.pediatrics.org/cgi/doi/10.1542/peds.2015-0259
Congenital heart defects (CHDs) represent one of the most prevalent birth defects, occurring in∼1% of live births annually in the United States.1,2 As a result of medical and surgical advances, survival has greatly improved.3,4With more children with CHDs living into adolescence and adulthood, such children are at increased risk of developmental disabilities.5–10Mechanisms postulated to explain such neurodevelopmental sequelae are varied and include genetic syndromes, brain malformations,11,12 hypoxemic-ischemic insults,10brain injury prenatally or after surgery,13,14 or environmental factors at home or school.15,16
Several hospital-based studies have documented an increased frequency of poor neurocognitive outcomes among children with specific types of CHDs (eg, transposition of the great arteries, tetralogy of Fallot, single ventricle, and hypoplastic left heart syndrome)17–21and the need for developmental screening and special education services for these children. Furthermore, studies have reported that neurodevelopmental concerns are dynamic and occur at all
ages.5,16,22–26For example, one study noted that.50% of newborns and 38% of infants with CHDs had neurobehavioral abnormalities before surgery that persisted postoperatively.5Other clinical studies have noted developmental delays in children with several types of CHDs in early childhood,25at school age,22–24,26and in adolescence.16In an effort to optimize neurodevelopmental outcomes, in 2012 the American Heart Association and the American Academy of Pediatrics issued a joint scientific statement on guidelines for systematic developmental surveillance, screening, and evaluation of children with CHDs throughout childhood.15
Evidence-based policies and service planning for children with CHDs
would benefit from population-based data characterizing the frequency and types of special education services needed by children with CHDs. We used population-based birth defects surveillance data, vital records information, and administrative data on receipt of special education in metropolitan Atlanta to determine the prevalence of receipt of special education services among children with CHDs compared with children without major birth defects.
METHODS
Study Population
Children born to mothers residing in the 5-county metropolitan Atlanta area from 1982 to 2004 who survived to age 3 years were identified through vital records (ie, birth and death records) from the State of Georgia. To identify children with CHDs, children were deterministically linked with data from the Metropolitan Atlanta Congenital Defects Program (MACDP), an ongoing population-based birth defects surveillance system with active case
ascertainment of children from birth through age 6 years born in
metropolitan Atlanta. Further details about this system have been published elsewhere.27MACDP records of children with CHDs were previously classified by experts in pediatric cardiology, according to a standard clinical nomenclature and morphogenetic classification
system.28Children whose birth records did not link to the MACDP (ie, children with no birth defects) were selected as the referent cohort.
This study only included children with isolated CHDs, ie, children without syndromes, chromosomal abnormalities, or extracardiac defects. Syndromes and chromosomal abnormalities were identified through active abstraction up to age 6 years at birthing or children’s hospitals and local genetics clinics. Children with isolated CHDs were divided into 2
mutually exclusive groups: (1) children with critical CHDs (ie, CHDs that usually require surgical or catheterization intervention during thefirst year of life; see the Appendix and Oster et al29) and (2) children without critical CHDs but with any other CHDs, referred to as“only noncritical CHDs.”Children in either group could have.1 CHD, and children in the“critical”group could also have noncritical CHDs.
Receipt of Special Education Services
The Special Education Database of Metropolitan Atlanta (SEDMA) systematically links children identified by special education departments of 9 public school districts in the 5-county metropolitan Atlanta area longitudinally through their years of receiving special education services. SEDMA also captures the categories under which the child receive special education services: autism spectrum disorder, deaf/blind, deaf/hard of hearing, emotional or behavioral disorder, intellectual disability (mild, moderate, severe, profound), orthopedic impairment, other health impairment, significant developmental delay, specific learning disability, speech/ language impairment, traumatic brain injury, and visual impairment.“Other health impairment”means that because of a health condition (eg, CHDs or attention-deficit/ hyperactivity disorder) the child has a limited alertness in his/her educational environment, which affects performance and requires specialized instruction. To receive services under other health
impairment (OHI) the child must not have an intellectual, visual, hearing, emotional, or motor disability.30
were grouped as“sensory
impairment.” “Traumatic brain injury” was excluded because of the small number of cases. Because children may enter special education under a nonspecific category (eg, significant developmental delay), which may become more specific over time, we used the most recent reported category. Some school districts reported multiple categories for which a child was receiving services, whereas others reported only 1 category. Our analyses revealed no significant differences when various hierarchies were applied placing different categories as the primary category, if.1 was reported. The CHD and referent cohorts were deterministically linked to SEDMA to identify which children ages 3 to 10 years had received special education services at any time from 1992 through 2012.
Covariates
The study covariates were obtained from vital records and grouped as follows: birth year (1982–1987, 1988–1994, 1995–2000,
2001–2004), birth weight (,1500 g, 1500–2499 g,$2500 g), gender, maternal age (,19 years, 20–24 years, 25–29 years, 30–34 years,$35 years), maternal race/ethnicity (non-Hispanic white, non-(non-Hispanic black, Hispanic, Asian, other), and maternal level of education attained (some high school, high school graduate, college, postcollege). Gestational age was not included because gestational age, or markers used to estimate gestational age (eg, last menstrual period), was missing more often than birth weight (2.2% vs 1.5%), and birth weight was found to be correlated with, and a reasonable proxy for, gestational age. Children with missing covariate data were excluded from analysis.
Analysis
We report the number and
percentage of children with no major birth defects (referent cohort),
children with any type of isolated CHDs, children with critical CHDs, and children with only noncritical CHDs by maternal and infant characteristics. Pearson’sx2test was used to compare the distribution of characteristics of the 3 CHD groups with that of the reference group, with significance defined asP,.05. The prevalence of receipt of special education services overall and by special education categories among the referent group and the 3 CHD groups was estimated per 1000 3-year infant survivors. Poisson regression methods were used to estimate prevalence rate ratios, adjusted for all covariates, and 95% confidence intervals (CIs) for receipt of special education services among children with CHDs compared with the referent group. Results were reported only for cells with at least 5 observations. All analyses were performed by using SAS version 9.3 (SAS Institute, Cary, NC).
RESULTS
Study Population Characteristics
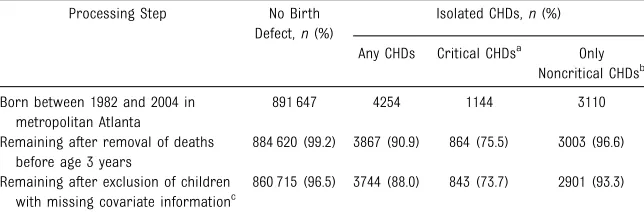
After linkages of the data sources and application of exclusion criteria, we identified 860 715 children without a birth defect and 3744 children with isolated CHDs born in metropolitan Atlanta from 1982 to 2004 (Table 1). The exclusion of deaths before age 3 years represented a greater fraction in the entire CHD cohort (9.1%) than
in the referent cohort (0.8%), and among critical CHD cases (24.5%) than among noncritical CHD cases (3.4%). Additional exclusions based on missing data were comparable between the 2 cohorts (n= 123 [2.9%] of the CHD group and
n= 23 905 [3.1%] of the referent group). Although the numbers were small, the excluded cases did not characteristically differ significantly from the included cases except in proportion of Hispanic and non-Hispanic black mothers (18% and 20% vs 5% and 35%, respectively; data not shown).
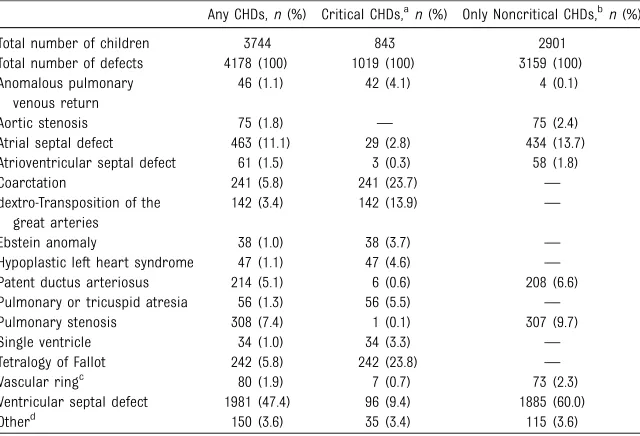
Of children with isolated CHDs who survived to age 3 years, 843 (22.5%) had critical CHDs and 2901 (77.4%) had only noncritical CHDs, most of whom (n= 2664; 91.8%) had a single noncritical CHD (data not shown). There was a wide variety of CHD phenotypes represented (Table 2), the most common being ventricular septal defects (47% among any isolated CHDs and 60% among only noncritical CHDs) (Table 2). Among children with critical CHDs, the most common phenotypes were tetralogy of Fallot (24%) and coarctation (24%) (Table 2).
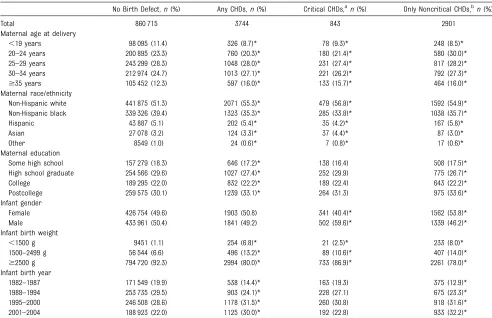
Compared with children without major birth defects, a slightly greater proportion of children with CHDs were born to mothers who were
$35 years of age, non-Hispanic white, and with a postcollege education (Table 3). Also, compared with
TABLE 1 Steps in the Selection of a Cohort of Children Without Birth Defects and a Cohort of Children With Isolated CHDs Born Between 1982 and 2004 in Metropolitan Atlanta
Processing Step No Birth Defect,n(%)
Isolated CHDs,n(%)
Any CHDs Critical CHDsa Only Noncritical CHDsb Born between 1982 and 2004 in
metropolitan Atlanta
891 647 4254 1144 3110
Remaining after removal of deaths before age 3 years
884 620 (99.2) 3867 (90.9) 864 (75.5) 3003 (96.6)
Remaining after exclusion of children with missing covariate informationc
860 715 (96.5) 3744 (88.0) 843 (73.7) 2901 (93.3)
Isolated CHDs exclude children with syndromes, chromosomal abnormalities, and extracardiac defects.
aCHDs that usually require surgical or catheterization intervention during thefirst year of life. bAbsence of critical CHDs but with$1 other CHDs.
children without major birth defects, children with CHDs were more likely to have lower birth weight and be born in the most recent birth year group. Table 3 also shows that the prevalence of CHDs increased across birth year groups, afinding consistent with previous published work from the same data.31
Receipt of Special Education Services
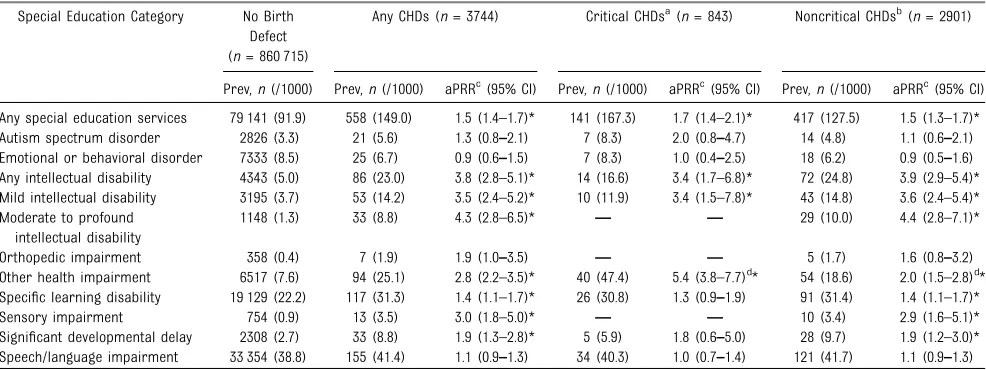
Of children with any isolated CHDs, 15% (558 of 3744) receive special education compared with 9% (79 141 of 860 715) of children with no major birth defects (Table 4). Children with any isolated CHDs were 50% more likely than those without birth defects to receive special education services (aPRR = 1.5; 95% CI: 1.4–1.7). Compared with children without major birth defects, the prevalence of several special education categories was significantly higher among children with any CHDs: intellectual disability (aPRR = 3.8; 95% CI: 2.8–5.1), sensory impairment (aPRR =
3.0; 95% CI: 1.8–5.0), other health impairment (aPRR = 2.8; 95% CI: 2.2–3.5), significant developmental delay (aPRR = 1.9; 95% CI: 1.3–2.8), and specific learning disability (aPRR = 1.4; 95% CI: 1.1–1.7) (Table 4). Children in the 3 CHD cohorts (any isolated CHDs, critical CHDs, or only noncritical CHDs) did not have an increased prevalence of the categories of autism, emotional/ behavioral disorders, orthopedic impairment, or speech/language impairment compared with children without birth defects. The most common category among all children in special education, including those in the 3 CHD cohorts, was speech/language impairment. A sensitivity analysis including children with missing covariates revealed no statistically significant changes in any of the aPRRs for the CHD cohorts (data not shown).
The statistically higher prevalence of several special education categories occurred in both the critical and only noncritical CHD groups of children. For most categories showing an
association with any CHDs, there was no significant variation in the magnitude of the excess prevalence by presence or absence of critical CHDs. The“other health impairment” category was the only category that showed a significantly higher prevalence among children with critical CHDs (aPRR= 5.4; 95% CI: 3.8–7.7) compared with children with only noncritical CHDs (aPRR = 2.0; 95% CI: 1.5–2.8) (Table 4).
DISCUSSION
Compared with children born without major birth defects in metropolitan Atlanta between 1982 and 2004, children born with isolated CHDs were 50% more likely to receive special education services in Atlanta during 1992–2012. Furthermore, the increased likelihood of receiving special education services for children with CHDs was not influenced appreciably by the presence of critical CHDs. Special education categories that were more prevalent among children with CHDs than among children without major birth defects included intellectual disability, other health impairment, sensory impairment, specific learning disability, and significant
developmental delay.
Ourfinding that 15% of children with CHDs received special education services is similar to observations from other studies in children with CHDs who underwent newborn or early childhood surgery.16,26 Our findings of a higher prevalence of receipt of special education services among children with CHDs compared with children without birth defects are consistent with previous reports of a higher prevalence of cognitive and other types of developmental impairment for children with specific types of CHD reported from hospital-based studies.7,8Furthermore, our findings are also consistent with reports that children with complex CHDs who underwent neonatal or infant surgery have a range
TABLE 2 Frequency of Select CHDs Among Children With Isolated CHDs Born Between 1982 and 2004 in Metropolitan Atlanta
Any CHDs,n(%) Critical CHDs,an(%) Only Noncritical CHDs,bn(%)
Total number of children 3744 843 2901
Total number of defects 4178 (100) 1019 (100) 3159 (100) Anomalous pulmonary
venous return
46 (1.1) 42 (4.1) 4 (0.1)
Aortic stenosis 75 (1.8) — 75 (2.4)
Atrial septal defect 463 (11.1) 29 (2.8) 434 (13.7)
Atrioventricular septal defect 61 (1.5) 3 (0.3) 58 (1.8)
Coarctation 241 (5.8) 241 (23.7) —
dextro-Transposition of the great arteries
142 (3.4) 142 (13.9) —
Ebstein anomaly 38 (1.0) 38 (3.7) —
Hypoplastic left heart syndrome 47 (1.1) 47 (4.6) — Patent ductus arteriosus 214 (5.1) 6 (0.6) 208 (6.6)
Pulmonary or tricuspid atresia 56 (1.3) 56 (5.5) —
Pulmonary stenosis 308 (7.4) 1 (0.1) 307 (9.7)
Single ventricle 34 (1.0) 34 (3.3) —
Tetralogy of Fallot 242 (5.8) 242 (23.8) —
Vascular ringc 80 (1.9) 7 (0.7) 73 (2.3)
Ventricular septal defect 1981 (47.4) 96 (9.4) 1885 (60.0)
Otherd 150 (3.6) 35 (3.4) 115 (3.6)
Select CHDs represent$1% of the total number of defects among children with any CHDs. Isolated CHDs exclude children with syndromes, chromosomal abnormalities, and extracardiac defects.—, defects with no occurrences among the group.
aCHDs that usually require surgical or catheterization intervention during thefirst year of life. bAbsence of critical CHDs but with$1 other CHDs.
cIncludes vascular rings, slings, and aberrant subclavian arteries.
d“Other”is a collective group of CHDs that individually are,1% of the total number of defects among children with any
of neurodevelopmental outcomes.16,22,24–26,32
Our study expands on previous studies by documenting the variation in the prevalence of receipt of special education services by severity of CHD with the use of population-based data. Although developmental impairments in children with critical CHDs (eg, transposition of the great arteries, tetralogy of Fallot, single ventricle, and hypoplastic left heart syndrome) have been documented,17–21little is known about the special education service needs among children with noncritical CHDs. A particularly interestingfinding in our study is that even after excluding chromosomal abnormalities, syndromes, and extracardiac defects, children with only noncritical CHDs were noted to
have a higher prevalence of receiving special education services relative to children without major birth defects. A variety of perioperative risk factors, especially among those with cyanotic or complex CHDs (ie, critical CHDs), have been considered major contributors to impaired brain function later in life.10,33–36However, neurodevelopmental outcomes may result from a complex combination of factors, in addition to perioperative risks. In fact, there is evidence to suggest that perioperative factors may be less significant as the child ages.16,37In contrast, there may be embryopathologic insults from yet to be identified genetic and/or environmental factors affecting both the brain and cardiac development.6 MRI studies have shown evidence of impaired brain function
preoperatively, which supports the hypothesis that some
neurodevelopmental impairment may be related to intrauterine factors.37 Furthermore, recent literature notes that numerous medical and
nonmedical risk factors occurring prenatally, perioperatively, and later in the school-age period may contribute to neurodevelopmental delays in children with many CHD phenotypes.16,25,32Nonmedical contributors to developmental milestones in these children may include environmental or sociodemographic factors, parental expectations, or access to early intervention services. These evolving hypotheses may partially explain the finding in our current study that children with both critical and noncritical CHDs have a higher
TABLE 3 Maternal and Infant Characteristics of Children Without Birth Defects and Children With Isolated CHDs Born Between 1982 and 2004 in Metropolitan Atlanta
No Birth Defect,n(%) Any CHDs,n(%) Critical CHDs,an(%) Only Noncritical CHDs,bn(%)
Total 860 715 3744 843 2901
Maternal age at delivery
,19 years 98 095 (11.4) 326 (8.7)* 78 (9.3)* 248 (8.5)*
20–24 years 200 895 (23.3) 760 (20.3)* 180 (21.4)* 580 (30.0)*
25–29 years 243 299 (28.3) 1048 (28.0)* 231 (27.4)* 817 (28.2)*
30–34 years 212 974 (24.7) 1013 (27.1)* 221 (26.2)* 792 (27.3)*
$35 years 105 452 (12.3) 597 (16.0)* 133 (15.7)* 464 (16.0)*
Maternal race/ethnicity
Non-Hispanic white 441 875 (51.3) 2071 (55.3)* 479 (56.8)* 1592 (54.9)*
Non-Hispanic black 339 326 (39.4) 1323 (35.3)* 285 (33.8)* 1038 (35.7)*
Hispanic 43 887 (5.1) 202 (5.4)* 35 (4.2)* 167 (5.8)*
Asian 27 078 (3.2) 124 (3.3)* 37 (4.4)* 87 (3.0)*
Other 8549 (1.0) 24 (0.6)* 7 (0.8)* 17 (0.6)*
Maternal education
Some high school 157 279 (18.3) 646 (17.2)* 138 (16.4) 508 (17.5)*
High school graduate 254 566 (29.6) 1027 (27.4)* 252 (29.9) 775 (26.7)*
College 189 295 (22.0) 832 (22.2)* 189 (22.4) 643 (22.2)*
Postcollege 259 575 (30.1) 1239 (33.1)* 264 (31.3) 975 (33.6)*
Infant gender
Female 426 754 (49.6) 1903 (50.8) 341 (40.4)* 1562 (53.8)*
Male 433 961 (50.4) 1841 (49.2) 502 (59.6)* 1339 (46.2)*
Infant birth weight
,1500 g 9451 (1.1) 254 (6.8)* 21 (2.5)* 233 (8.0)*
1500–2499 g 56 544 (6.6) 496 (13.2)* 89 (10.6)* 407 (14.0)*
$2500 g 794 720 (92.3) 2994 (80.0)* 733 (86.9)* 2261 (78.0)*
Infant birth year
1982–1987 171 549 (19.9) 538 (14.4)* 163 (19.3) 375 (12.9)*
1988–1994 253 735 (29.5) 903 (24.1)* 228 (27.1) 675 (23.3)*
1995–2000 246 508 (28.6) 1178 (31.5)* 260 (30.8) 918 (31.6)*
2001–2004 188 923 (22.0) 1125 (30.0)* 192 (22.8) 933 (32.2)*
Isolated CHDs exclude children with syndromes, chromosomal abnormalities, and extracardiac defects. *Significant difference in distribution of characteristics for CHD group compared with referent group of children without major birth defects,P,.05.
prevalence of receipt of special education services. Developmental delays in children with CHDs have been noted to be common and to vary with the age of the child25and therefore may require a variety of special education services.
Current recommendations are for periodic neurodevelopmental surveillance, screening, evaluation, and management of children with CHDs.15A management algorithm was created to stratify children with CHDs on the basis of several risk factors, with children at high risk receiving regular formal developmental evaluation.15Early intervention may help with school performance and enhance long-term outcomes.15,24However, our results suggest that using risk stratification criteria as the indicator for
conducting a developmental evaluation may miss children with mild or noncritical CHDs who may be in need of special services.
Strengths
This study has several strengths. First, children with CHDs were identified from a population-based, active-ascertainment birth defects
surveillance program with detailed case review and CHD classification. Second, vital records were linked to the MACDP to identify a contemporary cohort of children without major birth defects for comparison and to exclude all deaths under age 3 years from the study. Third, linkage to SEDMA allowed for longitudinal following of children through their receipt of special education services, so that the most recent and specific special education category was used in analysis. Finally, this study spans 20 years of
population-based data, providing a substantial sample size to examine groups of CHD phenotypes and specific special education categories.
Limitations
First, we did not have individual clinical information to distinguish the severity or surgical interventions within a CHD phenotype. Some phenotypes, such as ventricular septal defects, which were
considered noncritical, may consist of children with a range of severity, treatment, and neurodevelopmental outcomes. Thus, the noncritical CHD group of children is a heterogeneous
mix of severity, treatment, and other risk factors. However, our grouping of children with critical CHDs distinguishes CHDs that are likely to be cyanotic or have more severe functional limitations relative to other CHDs. Because of the small sample size we were unable to examine specific CHD phenotypes with special education eligibility categories.
Another limitation is that we lack migration data for the 5 central counties of metropolitan Atlanta that serve as the catchment area for the MACDP. We do not know how many children in the MACDP and vital records databases migrated out of the 5 central Atlanta counties and were not available for linkage to the special education data. Also, in-migrants are necessarily excluded because only children born in the catchment area were eligible for the study. Because most of the major pediatric cardiology referral centers in Georgia are located within the MACDP region, stable residence within the MACDP counties may have been more likely than for other children. Further work is warranted to evaluate the extent to which
TABLE 4 Prevalence and aPRRs of the Most Recent Special Education Categories Among Children Without Birth Defects and Children With Isolated CHDs in Metropolitan Atlanta, 1992–2012
Special Education Category No Birth Defect (n= 860 715)
Any CHDs (n= 3744) Critical CHDsa(n= 843) Noncritical CHDsb(n= 2901)
Prev,n(/1000) Prev,n(/1000) aPRRc(95% CI) Prev,n(/1000) aPRRc(95% CI) Prev,n(/1000) aPRRc(95% CI) Any special education services 79 141 (91.9) 558 (149.0) 1.5 (1.4–1.7)* 141 (167.3) 1.7 (1.4–2.1)* 417 (127.5) 1.5 (1.3–1.7)* Autism spectrum disorder 2826 (3.3) 21 (5.6) 1.3 (0.8–2.1) 7 (8.3) 2.0 (0.8–4.7) 14 (4.8) 1.1 (0.6–2.1) Emotional or behavioral disorder 7333 (8.5) 25 (6.7) 0.9 (0.6–1.5) 7 (8.3) 1.0 (0.4–2.5) 18 (6.2) 0.9 (0.5–1.6) Any intellectual disability 4343 (5.0) 86 (23.0) 3.8 (2.8–5.1)* 14 (16.6) 3.4 (1.7–6.8)* 72 (24.8) 3.9 (2.9–5.4)* Mild intellectual disability 3195 (3.7) 53 (14.2) 3.5 (2.4–5.2)* 10 (11.9) 3.4 (1.5–7.8)* 43 (14.8) 3.6 (2.4–5.4)* Moderate to profound
intellectual disability
1148 (1.3) 33 (8.8) 4.3 (2.8–6.5)* — — 29 (10.0) 4.4 (2.8–7.1)*
Orthopedic impairment 358 (0.4) 7 (1.9) 1.9 (1.0–3.5) — — 5 (1.7) 1.6 (0.8–3.2)
Other health impairment 6517 (7.6) 94 (25.1) 2.8 (2.2–3.5)* 40 (47.4) 5.4 (3.8–7.7)d* 54 (18.6) 2.0 (1.5–2.8)d* Specific learning disability 19 129 (22.2) 117 (31.3) 1.4 (1.1–1.7)* 26 (30.8) 1.3 (0.9–1.9) 91 (31.4) 1.4 (1.1–1.7)*
Sensory impairment 754 (0.9) 13 (3.5) 3.0 (1.8–5.0)* — — 10 (3.4) 2.9 (1.6–5.1)*
Significant developmental delay 2308 (2.7) 33 (8.8) 1.9 (1.3–2.8)* 5 (5.9) 1.8 (0.6–5.0) 28 (9.7) 1.9 (1.2–3.0)* Speech/language impairment 33 354 (38.8) 155 (41.4) 1.1 (0.9–1.3) 34 (40.3) 1.0 (0.7–1.4) 121 (41.7) 1.1 (0.9–1.3)
Isolated CHDs exclude children with syndromes, chromosomal abnormalities, and extracardiac defects. *Statistically significant aPRR. Estimates with,5 cases are not reported. Prev, prevalence.
aCHDs that usually require surgical or catheterization intervention during thefirst year of life. bAbsence of critical CHDs but with$1 other CHDs.
differential migration could affect ourfindings on receipt of special education services.
Finally, it is important to note that these data reflect the receipt of special education services as reported by 1 of the 9 public school special education departments serving the 5 central metropolitan Atlanta counties and do not include children attending and receiving services at private schools or through homeschooling. These data reflect the category through which the child primarily received his or her special education services as reported by the school system. Active review of children’s records was not conducted as a part of SEDMA. Therefore, these data do not include assessment of specific types of developmental disability (eg, IQ measurements, behavioral characteristics, or physicalfindings). Furthermore, the category of“other health impairment,” by definition, is
heterogeneous and therefore results in this category are challenging to interpret. It is also important to note that additional factors may affect the receipt of special education services that we were unable to study, such as access to early intervention services, developmental screening, or other environmental factors influencing development.
Conclusions
Children in metropolitan Atlanta with critical and/or noncritical CHDs received special education services more often than children without major birth defects. Thesefindings highlight the need for special education services and the importance of developmental screening for children with both critical and noncritical CHDs. As survival continues to improve for all persons with CHDs, and with the increase in CHD prevalence over the study period, one public health
implication of our study is that there will be a corresponding increased need for special education services for this growing population of children with CHDs, which may be magnified without early and appropriate intervention. Further corroboration of ourfindings is warranted to better understand the scope of long-term
neurodevelopmental outcomes of all children with CHDs.
ABBREVIATIONS
aPRR: adjusted prevalence rate ratio
CHD: congenital heart defect CI: confidence interval MACDP: Metropolitan Atlanta
Congenital Defects Program
SEDMA: Special Education Database of Metropolitan Atlanta
Address correspondence to Tiffany Riehle-Colarusso, MD, MPH, Centers for Disease Control and Prevention, 4770 Buford Highway, Mailstop E-86, Atlanta, GA 30341. E-mail: tja4@cdc.gov
PEDIATRICS (ISSN Numbers: Print, 0031-4005; Online, 1098-4275).
Copyright © 2015 by the American Academy of Pediatrics
FINANCIAL DISCLOSURE:The authors have indicated they have nofinancial relationships relevant to this article to disclose.
FUNDING:No external funding.
POTENTIAL CONFLICT OF INTEREST:The authors have indicated they have no potential conflicts of interest to disclose.
REFERENCES
1. Hoffman JI, Kaplan S. The incidence of congenital heart disease.J Am Coll Cardiol. 2002;39(12):1890–1900
2. Reller MD, Strickland MJ, Riehle-Colarusso T, Mahle WT, Correa A. Prevalence of congenital heart defects in metropolitan Atlanta, 1998-2005.J Pediatr. 2008;153(6):807–813
3. Gilboa SM, Salemi JL, Nembhard WN, Fixler DE, Correa A. Mortality resulting from congenital heart disease among children and adults in the United States, 1999 to 2006.Circulation. 2010;122(22): 2254–2263
4. Marelli AJ, Mackie AS, Ionescu-Ittu R, Rahme E, Pilote L. Congenital heart
disease in the general population: changing prevalence and age distribution.Circulation. 2007;115(2): 163–172
5. Limperopoulos C, Majnemer A, Shevell MI, Rosenblatt B, Rohlicek C, Tchervenkov C. Neurodevelopmental status of newborns and infants with congenital heart defects before and after open heart surgery.J Pediatr. 2000;137(5): 638–645
6. Decoufle P, Boyle CA, Paulozzi LJ, Lary JM. Increased risk for developmental disabilities in children who have major birth defects: a population-based study.
Pediatrics. 2001;108(3):728–734
7. Petterson B, Bourke J, Leonard H, Jacoby P, Bower C. Co-occurrence of birth defects and intellectual disability.Paediatr Perinat Epidemiol. 2007;21(1):65–75
8. Jelliffe-Pawlowski LL, Shaw GM, Nelson V, Harris JA. Risk of mental retardation among children born with birth defects.Arch Pediatr Adolesc Med. 2003;157(6):545–550
9. Eide MG, Skjaerven R, Irgens LM, Bjerkedal T, Oyen N. Associations of birth defects with adult intellectual
performance, disability and mortality: population-based cohort study.Pediatr Res. 2006;59(6):848–853
Neurodevelopmental outcome and lifestyle assessment in school-aged and adolescent children with hypoplastic left heart syndrome.Pediatrics. 2000;105(5): 1082–1089
11. Byrne A, MacDonald J, Buckley S. Reading, language and memory skills: a comparative longitudinal study of children with Down syndrome and their mainstream peers.Br J Educ Psychol. 2002;72(Pt 4):513–529
12. Brugge KL, Nichols SL, Salmon DP, et al. Cognitive impairment in adults with Down’s syndrome: similarities to early cognitive changes in Alzheimer’s disease.
Neurology. 1994;44(2):232–238
13. Dent CL, Spaeth JP, Jones BV, et al. Brain magnetic resonance imaging
abnormalities after the Norwood procedure using regional cerebral perfusion.J Thorac Cardiovasc Surg. 2005;130(6):1523–1530
14. Hoffman GM, Mussatto KA, Brosig CL, et al. Systemic venous oxygen saturation after the Norwood procedure and childhood neurodevelopmental outcome.
J Thorac Cardiovasc Surg. 2005;130(4): 1094–1100
15. Marino BS, Lipkin PH, Newburger JW, et al. Neurodevelopmental outcomes in children with congenital heart disease: evaluation and management: a scientific statement from the American Heart Association.Circulation. 2012;126(9): 1143–1172
16. Schaefer C, von Rhein M, Knirsch W, et al. Neurodevelopmental outcome, psychological adjustment, and quality of life in adolescents with congenital heart disease.Dev Med Child Neurol. 2013;55 (12):1143–1149
17. DeMaso DR, Beardslee WR, Silbert AR, Fyler DC. Psychological functioning in children with cyanotic heart defects.J Dev Behav Pediatr. 1990;11(6):289–294
18. Zeltser I, Jarvik GP, Bernbaum J, et al. Genetic factors are important determinants of neurodevelopmental outcome after repair of tetralogy of Fallot.J Thorac Cardiovasc Surg. 2008; 135(1):91–97
19. Hesz N, Clark EB. Cognitive development in transposition of the great vessels.
Arch Dis Child. 1988;63(2):198–200
20. Wernovsky G, Stiles KM, Gauvreau K, et al. Cognitive development after the Fontan operation.Circulation. 2000;102 (8):883–889
21. Uzark K, Lincoln A, Lamberti JJ, Mainwaring RD, Spicer RL, Moore JW. Neurodevelopmental outcomes in children with Fontan repair of functional single ventricle.Pediatrics. 1998;101(4): 630–633
22. Liamlahi R, von Rhein M, Buhrer S, et al. Motor dysfunction and behavioural problems frequently coexist with congenital heart disease in school-age children.Acta Paediatr. 2014;103(7): 752–758
23. Majnemer A, Limperopoulos C, Shevell M, Rohlicek C, Rosenblatt B, Tchervenkov C. Developmental and functional outcomes at school entry in children with congenital heart defects.J Pediatr. 2008; 153(1):55–60
24. Mulkey SB, Swearingen CJ, Melguizo MS, et al. Academic proficiency in children after early congenital heart disease surgery.Pediatr Cardiol. 2014;35(2): 344–352
25. Mussatto KA, Hoffmann RG, Hoffman GM, et al. Risk and prevalence of
developmental delay in young children with congenital heart disease.Pediatrics. 2014;133(3). Available at: www.pediatrics. org/cgi/content/full/133/3/e570
26. Shillingford AJ, Glanzman MM, Ittenbach RF, Clancy RR, Gaynor JW, Wernovsky G. Inattention, hyperactivity, and school performance in a population of school-age children with complex congenital heart disease.Pediatrics. 2008;121(4). Available at: www.pediatrics.org/cgi/ content/full/121/4/e759
27. Correa A, Cragan JD, Kucik JE, et al. Reporting birth defects surveillance data 1968-2003.Birth Defects Res A Clin Mol Teratol. 2007;79(2):65–186
28. Riehle-Colarusso T, Strickland MJ, Reller MD, et al. Improving the quality of surveillance data on congenital heart defects in the metropolitan Atlanta congenital defects program.Birth Defects Res A Clin Mol Teratol. 2007;79 (11):743–753
29. Oster ME, Lee KA, Honein MA, Riehle-Colarusso T, Shin M, Correa A. Temporal
trends in survival among infants with critical congenital heart defects.
Pediatrics. 2013;131(5). Available at: www. pediatrics.org/cgi/content/full/131/5/e1502
30. Georgia Department of Education Archives. Documentation on other health impairments. Available at: http://archives. gadoe.org/DMGetDocument.aspx/OHI_ Rules_and_Regulations.pdf?p=6CC6799F- 8C1371F6C24E001B33B21F8D923A06632F-ECA29C0A1C0B77F4864BD2&Type=D. Accessed on June 19, 2015
31. Bjornard K, Riehle-Colarusso T, Gilboa SM, Correa A. Patterns in the prevalence of congenital heart defects, metropolitan Atlanta, 1978 to 2005.Birth Defects Res A Clin Mol Teratol. 2013;97(2):87–94
32. Majnemer A, Limperopoulos C, Shevell MI, Rohlicek C, Rosenblatt B, Tchervenkov C. A new look at outcomes of infants with congenital heart disease.Pediatr Neurol. 2009;40(3):197–204
33. Aisenberg RB, Rosenthal A, Nadas AS, Wolff PH. Developmental delay in infants with congenital heart disease:
correlation with hypoxemia and congestive heart failure.Pediatr Cardiol. 1982;3(2):133–137
34. Bellinger DC, Wernovsky G, Rappaport LA, et al. Cognitive development of children following early repair of transposition of the great arteries using deep hypothermic circulatory arrest.
Pediatrics. 1991;87(5):701–707
35. Newburger JW, Silbert AR, Buckley LP, Fyler DC. Cognitive function and age at repair of transposition of the great arteries in children.N Engl J Med. 1984; 310(23):1495–1499
36. Wells FC, Coghill S, Caplan HL, Lincoln C. Duration of circulatory arrest does influence the psychological development of children after cardiac operation in early life.J Thorac Cardiovasc Surg. 1983;86(6):823–831
37. Li Y, Yin S, Fang J, Hua Y, Wang C, Mu D, Zhou K. Neurodevelopmental delay with critical congenital heart disease is mainly from prenatal injury not infant cardiac surgery: current evidence based on a meta-analysis of functional magnetic resonance imaging.
APPENDIXClassification of CHDs
Critical Noncritical
Coarctation of the aorta Aortopulmonary window dextro-Transposition of the great arteries Aortic stenosis Double-outlet right ventricle Atrial septal defects Ebstein anomaly Atrioventricular septal defect Hypoplastic left heart syndrome Bicuspid aortic valve
Interrupted aortic arch Congenitally corrected transposition of the great arteries
Pulmonary atresia Cor triatriatum
Single ventricle Double-chambered right ventricle
Tetralogy of Fallot Partial anomalous pulmonary venous return Total anomalous pulmonary venous return Patent ductus arteriosus
Tricuspid atresia Pulmonic stenosis
Truncus arteriosus Vascular ring
DOI: 10.1542/peds.2015-0259 originally published online August 17, 2015;
2015;136;496
Pediatrics
T. Mahle, Kim Van Naarden Braun and Adolfo Correa
Tiffany Riehle-Colarusso, Andrew Autry, Hilda Razzaghi, Coleen A. Boyle, William
Congenital Heart Defects and Receipt of Special Education Services
Services
Updated Information &
http://pediatrics.aappublications.org/content/136/3/496 including high resolution figures, can be found at:
References
http://pediatrics.aappublications.org/content/136/3/496#BIBL This article cites 33 articles, 10 of which you can access for free at:
Subspecialty Collections
ers_sub
http://www.aappublications.org/cgi/collection/cardiovascular_disord Cardiovascular Disorders
http://www.aappublications.org/cgi/collection/cardiology_sub Cardiology
rning_disorders_sub
http://www.aappublications.org/cgi/collection/cognition:language:lea Cognition/Language/Learning Disorders
al_issues_sub
http://www.aappublications.org/cgi/collection/development:behavior Developmental/Behavioral Pediatrics
following collection(s):
This article, along with others on similar topics, appears in the
Permissions & Licensing
http://www.aappublications.org/site/misc/Permissions.xhtml in its entirety can be found online at:
Information about reproducing this article in parts (figures, tables) or
Reprints
DOI: 10.1542/peds.2015-0259 originally published online August 17, 2015;
2015;136;496
Pediatrics
T. Mahle, Kim Van Naarden Braun and Adolfo Correa
Tiffany Riehle-Colarusso, Andrew Autry, Hilda Razzaghi, Coleen A. Boyle, William
Congenital Heart Defects and Receipt of Special Education Services
http://pediatrics.aappublications.org/content/136/3/496
located on the World Wide Web at:
The online version of this article, along with updated information and services, is
by the American Academy of Pediatrics. All rights reserved. Print ISSN: 1073-0397.