Archives • 2020 • vol.1 • 206-212
EFFECT OF THE TRIAZOLE ANALOG TAN ON GDF-15 EXPRESSION IN HUMAN
COLORECTAL CANCER HCT116 CELL LINE
Almedeny, A ,S.
1*; Al-Kelaby K, K.
2; Abdul Hussein, A, H.
3, Gany
, N, S
3 1University of Kufa, Iraq. Faculty of pharmacy ,department of pharmacology
2University of Kufa, Iraq . Faculty of pharmacy, department of clinical and laboratory
3University of Kufa, Iraq. Faculty of medicine .Department of pharmacology
*seheralmadany@yahoo.com
Abstract
A tumor marker is a term usually refers to proteins that is indicating the presence of a tumor
biochemically. They are mainly found in blood or urine and other body fluids, those markers may be used to detect expected primary or secondary tumor. GDF_ 15 is one of the tumor markers that engaged in controlling apoptosis & inflammatory response during disease & tissue injury). It is assumed to be a biomarker for p53 pathway enhancement in human CA. In the current study we try to assess the effect of our investigational drug TAN on the expression of GDF-15 in in human colorectal cancer HCT116 cell line by comparing its effect with the standard anticancer agents doxorubicin(DOX) and the traditional triazole member; itraconazole (ITC).Objectives : To assess the effect of the triazole analog TAN on GDF-15 expression in human colorectal cancer cell line HCT116.
Results : TAN shows a significant decrease in GBF15 level at concentration of 20 and 40 μg/ml, and a significant increase at 80 μg/ml concentration .
Conclusions: TAN significantly decreased the GDF15 level in HCT 116 cells in low and moderate concentrations.
Introduction
markers are almost helpful in assessing the progress of the tumor status after primitive chemotherapy and radiotherapy
to plan for next management
strategies(1).
The typical tumor marker should be both specific and sensitive to diagnose small tumors to permit early detection or aid in tumor screening, little number of markers
are specific for a specific tumor. Tumor (2)
. It is assumed to be a biomarker for p53
pathway enhancement in human CA (3; 4 ;
5
) Its level increase in many tapes of
cancers including colorectal cancer(6) and
this is associated with poor clinical outcomes , its serum levels in CRC indicates reduced disease overall survival
rates & lymph node penetration( 7 ). In this
study we try to assess the effect of our investigational drug TAN on GDF-15 expression in comparison with the traditional triazole member ITC and the standard anticancer agent DOX.
GDF -15 is belonged to the β super family of the transforming growth factor & it is correlated with P53 pathway activation in human CA. GDF_ 15 is engaged in controlling apoptosis & inflammatory response during disease & tissue injury . Normally, GDF-15 expressed in significant amounts by the placenta only ; although it is found in little amounts in some tissues like pancreatic, renal & colonic tissues
Materials and methods
Cell line
HCT-116 colorectal carcinoma cell
line(ATCC® CCL-247™) USA TAN and ITC solutions :
These solutions were prepared in a final concentration 1000 µg/ml for application of biomarker assay assay, micro titration of these compounds was done as the experiment required.
Doxorubicin (DOX) :
The molecular weight for this drug is 580.0 and chemical formula: C27 H29NO11,HCl. This solution was prepared in a final
concentration of 1000 µg/ml for
application of biomarker assay, and for use micro titration of this compound was done as the experiment required.
GDF-15
By using Human GDF-15 ELISA kit (Enzyme linked immune assay for GDF-15 Cloud clone, USA) :
A. Principle : In these kits The micro-plate supplied has been pre-covered with a specific antibody to GDF-15. Standards or specimens are then added to the proper micro-plate wells with a biotin-conjugated antibody specific to GDF-15. After that , a conjugation of Avidin conjugated and
Horseradish Peroxidase (HRP) is
introduced to each micro-plate well and
incubated.
When TMB substrate solution is applied , only the wells which have GDF-15,
biotin-conjugated antibody and
enzyme-conjugated Avidin will show a color difference. The enzyme-Substrate reaction is ended by the applying of sulphuric acid solution and the color difference is detected by spectrophotometer at a
wavelength of 450 nm. GDF-15
concentration in the specimens is then detected by comparing the O.D. of the specimens to the standard curve.
B. GDF-15 concentration is measured for
untreated cells and that treated with 20,40,and 80 μg/ml of different compounds including TAN, ITC, and DOX by final absorbance reading at 450 nm wavelength ELISA reader
Statistical analysis
Statistical descriptive measures (mean and median ) and scattering measures(SD
and SE ) in addition to R2 and ANOVA
Results
After 24 hours incubation of drug treated and untreated HCT 116 cells the cells are submitted to the standard procedure of tumor marker GDF-15 assay . IC50 concentration of standard and test drugs (
that obtained from our research
Evaluation of the apoptotic effect of the triazole analog TAN on human colorectal Cancer cell line HCT 116 by flow cytometry)
(8) , IC50 which was for TAN: 63.94 µg/ ml ,
for ITC: 21.85 µg/ ml and DOX: 345.176 µg/
ml).
TAN shows a significant decrease in GBF15 level at concentration of 20 and 40 μg/ml, and a significant increase at 80 μg/ml
concentration with negative R2 (table 1
and figure 1 ) .
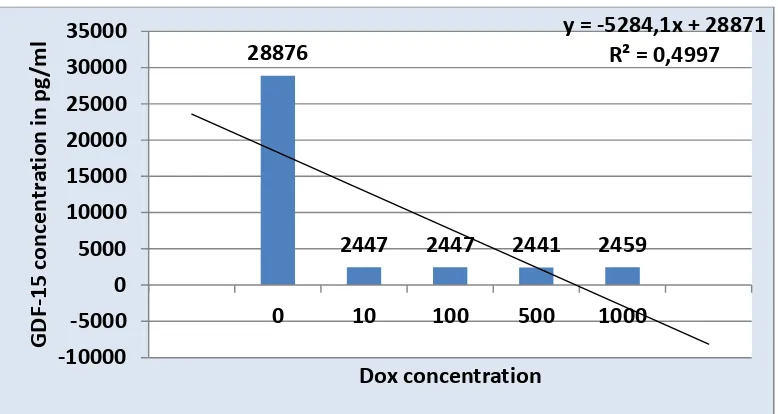
Itraconazole shows a significant decrease in GBF15 level with positive R, (table 2 and figure 2) . DOX reveals a significant decrease in GBF15 level but with negative (table 3 , and figure 3 ).
Discussion
TAN shows a significant decrease in GDF-15 level at 20 and 40 μg/ml concentrations and a significant increase at concentration of 80 μg/ml with negative R. This reveals that TAN has concentration independent effect on GDF-15 level. Lakhal et al., mentioned that hypoxia and iron depletion in the cell are responsible for elevating GDF-15 levels ( 9 ), this may explain the unexpected increase in the GDF-15 levels in cells treated with high concentrations of TAN as it could be due to hypoxia that results from apoptotic ITC shows a significant decrease in GDF-15 level with positive R , so it demonstrates a dose dependent effect on GDF-15 level. DOX reveals a significant decrease in GDF-15 level but with negative R, this means that DOX has a dose independent ability to decrease GDF-15 level , however , in an invitro study on isolated cardiomyocytes GDF-15 shows a very interesting profile and responds to doxorubicin with a significant dose dependent up-regulation
at day 1, 2, 7, and 14. Based on the gene
expression profile analysis of GDF-15 (10).
Conclusions
1. TAN showed a significant dose
independent decreasing ability on the GDF-15 levels in low and
moderate concentrations in
HCT116 cells.
2. ITC appeared a significant dose
dependent reducing effect on the GDF-15 in HCT116 cells.
3. DOX revealed a significant dose
independent reducing effect on the GDF-15 in HCT116 cells.
Acknowledgement
Authors are so grateful to Prof. Anna Capasso , chief editor of PHOL and to Dr. Imma PAGANO for their great efforts in publishing this work.
References
1. Cooner WH. Definition of the ideal
tumor marker. Urol Clin North Am. 1993;20(4):575-579.
2. Fairlie WD, Moore AG, Bauskin AR,
Russell PK, Zhang HP, Breit SN ( MIC-1 is a novel TGF-beta superfamily cytokine
associated with macrophage
activation. J Leukoc Biol. 1999 Jan; 65(1):2-5.)
3. Seetoo DQ, Crowe PJ, Russell PJ, Yang,
JL . Quantitative expression of protein markers of plasminogen activation system in prognosis of colorectal cancer. J Surg Oncol. 2003 Mar; 82(3):184-93.)
4. Weber F, Shen L, Aldred MA, Morrison
CD, Frilling A, Saji M, Schuppert F, Broelsch CE, Ringel MD, Eng C. Genetic classification of benign and malignant thyroid follicular neoplasia based on a
three-gene combination. J Clin
Endocrinol Metab. 2005 May;
90(5):2512-21.)
5. Brown DA, Stephan C, Ward RL, Law M,
Giles GG, Breit SN. (Measurement of serum levels of macrophage inhibitory cytokine 1 combined with prostate-specific antigen improves prostate cancer diagnosis.Clin Cancer Res. 2006 Jan 1; 12(1):89-96.
6. Mehta RS, Song M, Bezawada N, Wu K,
Garcia-Albeniz X, Morikawa T, Fuchs CS, Ogino S, Giovannucci EL, Chan AT , J
Natl A prospective study of
macrophage inhibitory cytokine-1 (MIC-1/GDF15) and risk of colorectal cancer., Cancer Inst. 2014 Apr; 106(4):dju016.
7. Xue H, Lü B, Zhang J, Wu M, Huang Q,
Wu Q, Sheng H, Wu D, Hu J, Lai M. Identification of serum biomarkers for colorectal cancer metastasis using a differential secretome approach. J Proteome Res. 2010 Jan; 9(1):545-55.) .
8. Almedeny S., Al-Kelaby K., Gany S.,
Abdul Hussein H. Evaluation of the apoptotic effect of the triazole analog TAN on human colorectal Cancer cell line HCT 116 by flow cytometry. Sys Rev Pharm, 2019;10 (1) : 214-219.
9. Lakhal S., Talbot N. , Crosby A.,
Stoepker C., Townsend A., Robbins P., Pugh C., Ratcliffe P. and Mole D. Regulation of growth differentiation factor 15 expression by intracellular iron. Blood 2009 113:1555-1563;
10. Holmgren, G. , Synnergren J., Bogestål,
Y., Améen C., Åkesson K.,Holmgren S., Lindahl, A., and Sartip P. Identification of novel biomarkers for
doxorubicin-induced toxicity in human
cardiomyocytes derived from
Table (1) The Effects of Different Concentrations of TAN on GDF-15 Levels
Table (2): The Effects of Different Concentrations of ITC on GDF-15 Levels
Table (3 ) : The Effects of Different Concentrations of DOX on GF15 Levels TAN Dose (μg/ml) N
Effect on GDF-15 marker
Level of significance
Mean± SEM
0 (control) 2 2.45450± .000000
20 2 .77850 ±.162635 .000
40 2 1.09000±.088388 .003
80 2 2.97650±.000000 .000
ITC Dose (μg/ml) N
Effect on GDF-15 marker
Level of significance
Mean± SEM
0 (control) 2 2.45450± .000000
20 2 1.17500± .020506 .001
40 2 1.11200±.256680 .001
80 2 1.22250± .033941 .003
DOX Dose (μg/ml) N
Effect on GDF-15 marker
Level of significance
Mean± SEM
0 (control) 2 2.45450± .000000
10 2 .17650± .082024 .000
100 2 .20800± .013435 .000
500 2 .20800± .024749 .000
Figure (1) The Effects of Different Concentrations of TAN on GDF-15 Levels in Pg. / ml obtained from HCT116 homogenate 24 hr. after addition of TAN
Figure (2) : The Effects of Different Concentrations of ITC on GDF-15 Levels. Levels in Pg. / ml obtained from HCT116 homogenate 24 hr. after addition of ITC.
28918
13824
13082
14382
y = -4434,7x + 33073
R² = 0,5681
0
5000
10000
15000
20000
25000
30000
35000
0
20
40
80
GD
F-15
co
n
cent
ra
ti
on
in
p
g/m
l
Figure (3) The Effects of Different Concentrations of DOX on GF15 Levels in Pg. / ml obtained from HCT116 homogenate 24 hr. after addition of DOX.