Nat. Hazards Earth Syst. Sci., 12, 1059–1072, 2012 www.nat-hazards-earth-syst-sci.net/12/1059/2012/ doi:10.5194/nhess-12-1059-2012
© Author(s) 2012. CC Attribution 3.0 License.
Natural Hazards
and Earth
System Sciences
Quasi-synchronous multi-parameter anomalies associated with the
2010–2011 New Zealand earthquake sequence
K. Qin1,3, L. X. Wu2,3, A. De Santis4,5, J. Meng1, W. Y. Ma1,6, and G. Cianchini4
1College of Geosciences and Surveying Engineering, China University of Mining and Technology (Beijing), Beijing, China 2Academy of Disaster Reduction and Emergency Management, Ministry of Civil Affairs/Ministry of Education of P.R. China (Beijing Normal University), Beijing, China
3School of Environment Science and Spatial Informatics, China University of Mining and Technology, Xuzhou, China 4Istituto Nazionale di Geofisica e Vulcanologia, Rome, Italy
5G. D’Annunzio University, Chieti, Italy
6China Earthquake Networks Center, Beijing, China
Correspondence to: L. X. Wu (awulixin@yahoo.com.cn)
Received: 31 January 2012 – Revised: 25 March 2012 – Accepted: 26 March 2012 – Published: 16 April 2012
Abstract. Positive thermal anomalies about one month be-fore the 3 September 2010 Mw=7.1 New Zealand earth-quake and “coincidental” quasi-synchronous fluctuations of GPS displacement were reported. Whether there were simi-lar phenomena associated with the aftershocks? To answer it, the following was investigated: multiple parameters includ-ing surface and near-surface air temperature, surface latent heat flux, GPS displacement and soil moisture, using a long-term statistical analysis method. We found that local thermal and deformation anomalies appeared quasi-synchronously in three particular tectonic zones, not only about one month be-fore the mainshock, but also tens of days bebe-fore the 21 Febru-ary 2011Mw=6.3 aftershock, and that the time series of soil moisture on the epicenter pixel had obvious peaks on most of the anomalous days. Based on local tectonic geology, hydrol-ogy and meteorolhydrol-ogy, the particular lithosphere-coversphere-atmosphere coupling mode is interpreted and four mecha-nisms (magmatic-hydrothermal fluids upwelling, soil mois-ture increasing, underground pore gases leaking, and positive holes activating and recombining) are discussed.
1 Introduction
The scientific community has reported a large number of thermal anomalies occurring before many medium-to-large (M >5.5) earthquakes all over the world (Mil’kis, 1986; Mogi et al., 1989). With the rapid development of satellite
remote sensing technology after the 1980s, many researchers began to study thermal infrared (TIR) anomaly in relation to seismic activity with satellite data (Gorny et al., 1988; Qiang et al., 1991; Tronin, 1996; Saraf and Choudhury, 2004; Ouzounov and Freund, 2004; Tramutoli et al., 2005; Sarad-jian and Akhoondzadeh, 2011; Blackett et al., 2011). In the meantime, anomalous surface latent heat flux (SLHF) before earthquakes was also discovered (Dey and Singh, 2003; Cer-vone et al., 2005; Qin et al., 2009). Moreover, during the past decades, some researchers have conducted a series of imaging detection on TIR increment (Qiang et al., 1995) on rock loaded to fracturing (Freund, 2002, 2007a, b; Freund et al., 2007c; Wu et al., 2002, 2006a, b), and some mech-anisms/hypotheses have been proposed, including Earth de-gassing and hence resulting in the greenhouse effect (Qiang et al., 1995) and Lithosphere-Atmosphere-Ionosphere Cou-pling (LAIC) (Pulinets et al., 2006) to explain the possible mechanism of observed thermal anomalies. To emphasize especially the influence of coversphere (including surface sand, soil, water body and vegetation), which is quite dif-ferent from the rock in lithosphere, to satellite remote sens-ing and to thermal anomaly mechanism, the Lithosphere-Coversphere-Atmosphere Coupling (LCAC) was suggested (Wu and Liu, 2009).
1060 K. Qin et al.: Quasi-synchronous multi-parameter anomalies
explained by the pre-slip or the pre-shock aseismic slip on a plate boundary. It was also reported that pre-earthquake crustal deformation can cause groundwater level changes at the well near the epicenter (Koizumi et al., 2004).
According to the New Zealand (NZ) GNS Science, an Mw=7.1 earthquake occurred near the town of Darfield on the South Island of NZ (43.55◦S, 172.18◦E) at 16:35 UTC on 3 September 2010, with a focal depth of 10 km (hence-forth, the Darfield earthquake). Since then, many after-shocks occurred including six events with Mw>5.0. At 23:51 UTC on 21 February 2011, a large aftershock (Mw= 6.3, 43.58◦S, 172.68◦E) with a focal depth of 5 km oc-curred close to the city of Christchurch (henceforth, the Christchurch earthquake), killing hundreds of people and causing severe losses. We had reported positive thermal anomalies about one month before the Darfield earthquake and “coincidental” quasi-synchronous fluctuations of GPS displacement (Qin et al., 2011). Whether there were also similar thermal and deformation anomalies associated with the aftershocks? What were the possible geophysical mech-anisms of the anomalies? To answer the questions, we tracked the results of previous studies and investigated multi-ple parameters (i.e. surface and near-surface air temperature, SLHF, GPS displacement and soil moisture) using a long-term statistical analysis method, and then further explored the LCAC effect behind the “coincidence” referring to the knowledge of tectonic geology, hydrology and meteorology.
2 Tectonics description
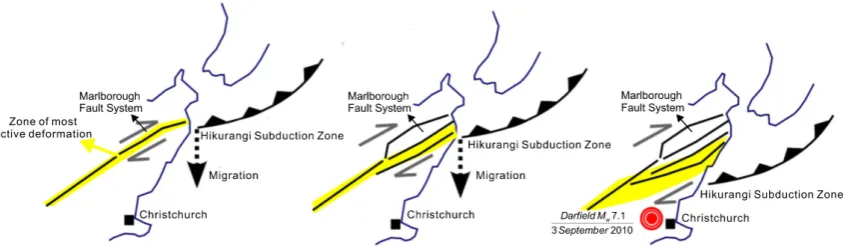
As shown in Fig. 1, NZ is located on the tectonic plate bound-ary between the Australian (A) and Pacific (P) plates. To the east of North Island, the P-plate consists of oceanic litho-sphere that sinks beneath the buoyant continental litholitho-sphere of the A-plate to form the Hikurangi Subduction Zone (HSZ). To the south of the South Island, there is another subduc-tion zone, i.e. Puysegur Subducsubduc-tion, with the A-plate be-ing pulled under the P-plate. In between, through most of the South Island, the two plates grind past each other along the Alpine Fault (AF), which acts as a hinge between the two subduction zones. On the northern South Island, the AF splays into four major fault zones of the Marlborough Fault System (MFS) including Wairau, Awaters, Clarence and Hope.
The 2010–2011 NZ earthquake sequence occurred as a result of strike-slip faulting within the crust of the P-plate, near the eastern foothills of the Southern Alps at the western edge of the Canterbury Plains. The Darfield earthquake ruptured nearly 40 km from the northern Can-terbury Plains, partially on the now recognized Greendale Fault (Fig. 1b). Even though the Christchurch earthquake occurred several months after the Darfield earthquake, scientists consider it as an aftershock, since it was caused by a fault rupture within the zone of aftershocks that followed
the Darfield earthquake (http://www.naturalhazards. org.nz/NHRP/Hazard-themes/Geological-Hazards/
February-22nd-aftershock/February-2011-aftershock). The displacement history of the individual faults in the MFS showed that the older northern faults were more active in the geological past and presented quite small recent displacements, while the younger south-ern faults have much larger recent displacements (http://all-geo.org/highlyallochthonous/). The ongoing changes in the nature of the plate boundary at the junction between the subduction zone and the continental transform cause new strands of the MFS to grow in order to accommo-date more efficiently the plate motions (Fig. 2). This may be the reason why the earthquake sequence occurred away from the southern MFS.
3 Thermal anomalies analysis
3.1 Theoretical model
At land surface, energy fluxes interact instantaneously with each other in accordance with the prevailing meteorological conditions and the specific thermal and radiative characteris-tics of the soil surface. The surface temperature represents the state variable that adjusts continuously to changes in hy-draulic and meteorological forcings in such a way that the energy balance is always preserved (Alkhaier et al., 2011):
Rn=LE+H+G. (1)
Here,LE is latent heat flux, i.e. the heat from the surface to the atmosphere, which is associated with evaporation or transpiration of water at the surface and subsequent con-densation of water vapor in the troposphere. H is sensible heat flux, i.e. the heat exchanged between the surface and air when there is a difference in temperature between them. G is ground heat flux, i.e. the heat transferred from the surface downwards via conduction.Rnis the net radiation, which is
the outcome of the radiation irradiated by the sun (Kin) and the atmosphere (εLin) onto the land surface, subtracted by the reflected radiation (αKin) or emitted radiation from the land surface (εσ Ts4):
Rn=(1−α)Kin+εLin−εσ Ts4 (2)
whereαandεare land surface albedo and emissivity, respec-tively, whereasTsandσare the physical temperatures of land
surface and the Stefan-Boltzmann constant, respectively. 3.2 Data and method
K. Qin et al.: Quasi-synchronous multi-parameter anomalies 1061
Fig. 1. Tectonic map in the seismic region of the 2010–2011 New Zealand earthquake sequence. (a) shows the main structural features
of New Zealand associated with the obliquely convergent Australia-Pacific plate boundary zone (Provided by Jarg Pettinga, University of Canterbury); the fat-arrows indicate relative plates convergence direction, teeth lines indicate subductions, thin-arrows indicate strike-slip faults, and tick lines indicate normal faults. (b) shows the epicenter locations and the Greendale Fault (from GNS Science).
Fig. 2. A schematic plot of the southward migration of the Hikurangi Subduction Zone, causing new strands of the MFS to grow in order
to accommodate more efficiently the plate motions (slightly modified from http://all-geo.org/highlyallochthonous/). This may be the reason why the earthquake sequence occurred away from the southern MFS.
Reanalysis Project, which is a joint project of the National Centers for Environmental Prediction (NCEP) and the Na-tional Center for Atmospheric Research (NCAR), USA. The dataset is generated from multi-source observations
1062 K. Qin et al.: Quasi-synchronous multi-parameter anomalies
Fig. 3. Time series of air temperature from the weather station NZCH near the epicenter and of SLHF data on the epicenter pixel (42.86◦S 172.5◦E). The brown columns indicate the mainshock and aftershocks (M >5) and the red circles indicate the outliers exceeding µ + 3σ.
(a) shows the multiple year (1996–2011) mean values of air temperature and trend curve obtained by the Gaussian fitting (Gaussian
func-tion:f (x)=a1∗e− h
x−b1
c1 i2
, a1 = 15.95(15.77, 16.13), b1 = 201.2(199.6, 202.8), c1 = 165.8(163, 168.7), R-square:0.9306). (b) shows the detrended data of air temperature from 1 July 2010 to 30 June 2011. (c) shows the multiple year (1980–2011) mean values of SLHF and trend
curve obtained by the Gaussian fitting (Gaussian function: f (x)=a1∗e− h
x−b1
c1 i2
+a2∗e− h
x−b2
c2 i2
, a1 = 47.43(38.66, 56.21), b1 = 157.6 (152.9, 162.2), c1=94.77(82.03, 107.5), a2 = 27.75(−65.35, 120.9), b2 = 665.5(−2678, 4009), c2 = 661(−1505, 2827), R-square:0.8442).
(d) shows the detrended data of SLHF from 1 July 2010 to 30 June 2011.
are represented in a T62 Gaussian grid with 192×94 pixels (94 lines of latitude from 88.542◦N to 88.542◦S, with a reg-ular 1.875◦ longitudinal spacing from 0◦E to 358.125◦E). In addition, near-surface air temperatures from the local weather station were also used for data validation to enhance data accuracy. To extract anomalous signals associated pos-sibly with the 2010–2011 NZ earthquake sequence from the strong meteorological background, the data were processed based on statistical analysis method as the following.
3.2.1 Spatial distribution imaging
The increment (1P )of a thermal parameter of each pixel at any day can be calculated as
1P =PEQ− 1 N
N
X
i=1
Pi (3)
wherePEQ is the value of a thermal parameter on any day within the analysis period,Pi is the value of the thermal
K. Qin et al.: Quasi-synchronous multi-parameter anomalies 1063
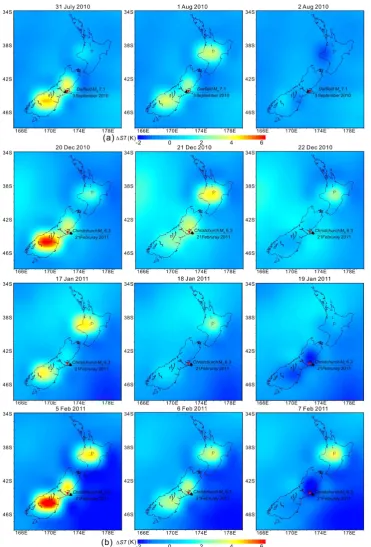
Fig. 4. (a) Spatial distribution of surface temperature increment (1ST) from 31 July to 2 August 2010, obtained by subtracting the mean
value of years without large (M >5.5) earthquakes (1980–2009), representing a background, from the data of 2010; (b) Spatial distribution of surface temperature increment (1ST) on 20–22 December 2010, 17–19 January 2011 and 5–7 February 2011, respectively, obtained by
1064 K. Qin et al.: Quasi-synchronous multi-parameter anomalies
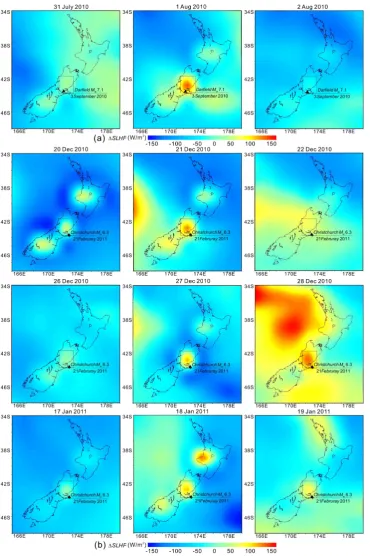
Fig. 5. (a) Spatial distribution of SLHF increment (1SLHF) from 31 July to 2 August 2010, obtained by subtracting the mean value of
years without large (M >5.5) earthquakes (1980-2009), representing a background, from the data of 2010; (b) Spatial distribution of SLHF increment (1SLHF) on 20–22 December 2010, 26–28 December 2010 and 17–19 January 2011, obtained by subtracting the mean value of
K. Qin et al.: Quasi-synchronous multi-parameter anomalies 1065
Fig. 6. (a) Velocity model of New Zealand relative to the Australian Plate. It shows how far the point moves relative to the Australian plate
in 1 year. Points near Auckland move hardly at all. Points near Christchurch move southwest at about 40 mm each year (from GNS Science).
(b) Shear train map. Maximum shear strain map shows the rate at which shearing or sideways deformation is taking place. The red areas
are those that are undergoing the most shear strain. The units on the scale bar are ppm/yr or parts per million per year (from GNS Science).
1066 K. Qin et al.: Quasi-synchronous multi-parameter anomalies
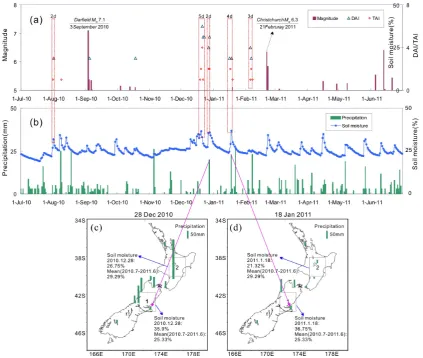
Fig. 8. (a) and (b) show the temporal quasi-synchronism of multi-parameter anomalies. The first window (2 days: 31 July and 1
Aug-sut 2010) shows the quasi-synchronism before the mainshock, and the later four windows (5 days: 19–23 December 2010; 2 days: 27 and 28 December 2010; 4 days: 16–19 January 2011; 3 days: 5–7 February 2011) show the quasi-synchronism before the 21 February 2011 aftershock. Displacement anomaly index (DAI) was obtained by adding the number of outliers of GPS simple-point displacement (only the day that had more than three outliers was shown). Thermal anomaly index (TAI) was obtained by adding the number of outliers in time series and anomalies in spatial distribution images together, both in temperature and in SLHF. The brown columns indicate the mainshock and after-shocks (M >5). Soil moisture has a volumetric soil water content at depth 0–10 cm. Precipitation is from the weather station NZCH. (c) and
(d) show that the local increment of soil moisture on the epicenter pixel in contrast to the decrement of soil moisture on the comparative
pixel, on 28 December 2010 and 18 January 2011, and was likely related to the NZ earthquakes rather than regional precipitation.
medium-to-large (M >5.5) earthquakes, andN is the num-ber of years without medium-to-large (M >5.5) earthquakes preceding the earthquake sequence (in this paperN =30). Using digital imaging technology, the spatial distribution fea-tures of1P can be visualized in a group of images.
3.2.2 Time series analysis
Long time series of near-surface air temperature data from the weather station NZCH near the epicenter and the SLHF data on the epicenter pixel (42.86◦S 172.5◦E) were ana-lyzed. The curves of the multi-year mean values (Fig. 3a and c) are characterized by seasonal variation, having a
K. Qin et al.: Quasi-synchronous multi-parameter anomalies 1067
3.2.3 Thermal anomaly index estimation
A thermal anomaly index (TAI), reflecting the thermal anomaly intensity, was then determined by adding the num-ber of outliers in time series and the anomalies in spatial dis-tribution images together, both in temperature and SLHF.
3.3 Results
The images of surface temperature increment (1ST) (Fig. 4) show that there were isolated anomaly zones northeast and close to the epicenter, on the central North Island and the southwest South Island on 31 July 2010, 1 August 2010, 20– 22 December 2010, 17 and 18 January 2011 and 5–7 Febru-ary 2011, respectively. Similar to the images of1ST, anoma-lous SLHF increments (1SLHF) appeared in the three zones, but were more concentrated to the northeast of the epicen-ter on 1 August 2010; 20, 21, 27 and 28 December 2010 and 17–19 January 2011, respectively (Fig. 5). With Fig. 4 contrasting to Fig. 5, we found that the surface temperature anomalies were coincident with SLHF anomalies in spatial adjacency and temporal quasi-synchronism, i.e. the surface temperature anomalies and SLHF anomalies occurred gener-ally at adjacent places on approximately the same dates.
The time series of detrended air temperature data, from NZCH near the epicenter, shows that there were two out-liers on 21 December 2010 and 6 February 2011, respec-tively (Fig. 3b). The time series of detrended SLHF data, on the epicenter pixel, shows that there were seven outliers on 1 and 8 August 2010; 19, 21, 27 and 28 December 2010 and 18 January 2011, respectively (Fig. 3d).
Based on comprehensive analysis of the spatial distribu-tion images and the time series, the thermal anomaly pat-terns can be summarized: temperature and SLHF showed anomalous changes quasi-synchronously about one month before the mainshock, and the anomalies got more frequent in December 2010, January and February 2011, which were 14 days to two months before the 21 February 2011 after-shock. The anomalies occurred generally the same in three zones, which were the spots northeast and close to the epi-center, the center of the North Island and the southwestern South Island, respectively.
4 Deformation anomalies analysis
4.1 New Zealand velocity model and strain-rate map
Global Positioning System (GPS) survey can be used to determine how surface deformation has occurred over the past decades. New Zealand velocity model (Fig. 6a), com-puted by using repeated GPS observations from more than 300 sites throughout the country, shows some significant features (Beavan and Haines, 2001): (1) extension across the Taupo volcanic zone (TVZ); (2) strong contraction (or
squashing) on the lower North Island and northern South Is-land; (3) strong shearing (or sideways sliding) motion along the Southern Alps. The strain-rate map (Fig. 6b), which shows more directly how much stretching, squashing and shearing were taking place in different parts of the country, was derived from the velocity model. Figure 6b together with Fig. 1 show that the region with highest shear strain rate is the Southern Alps along the west coast of the South Island, and the shear strains developed continuously from north to south through the TVZ, the southern North Island, and MFS. 4.2 Data and method
New Zealand GeoNet project (http://www.geonet.org.nz/), sponsored by the NZ Government, provides GPS displace-ment data to facilitate the research on natural hazards and risk assessment. To analyze the GPS displacement change asso-ciated with the 2010–2011 NZ earthquake sequence, the GPS raw measurements were processed as the following (steps 1 to 3 were achieved by GeoNet project):
1. GPS raw data (in RINEX format) together with IGS orbits data and Earth orientation parameters were processed (e.g. format transfer, baselines generation and preprocess) using Bernese v5.0 software. This step provided daily solution files.
2. The coordinates and their formal uncertainties were extracted from the daily solution files, and converted to east-west (E–W), north-south (N–S) and up-down (U-D) displacements in millimeters from an initial point. Some “outlier” data points, which were far different from the neighbouring data points, were removed from the time series using an automated procedure to get raw displacement time series.
3. A noise signal that is more-or-less common to all GPS sites in NZ was subtracted from each raw displacement time series to get the regional-filtered displacement time series.
1068 K. Qin et al.: Quasi-synchronous multi-parameter anomalies
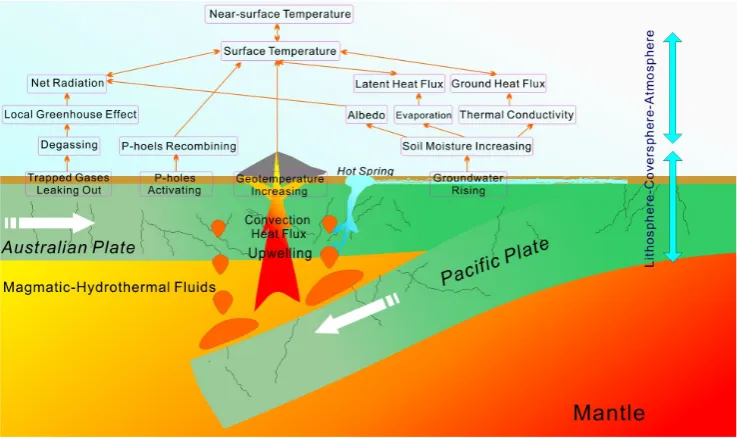
Fig. 9. A schematic plot of the LCAC mode interpreting the quasi-synchronous multi-parameter anomalies associated with the 2010–
2011 New Zealand earthquake sequence. Firstly, the magmatic-hydrothermal fluids, which upwelled via convection from the deep crust and mantle, had increased the geotemperature in particular zones, which were connected with subsurface fluids. Secondly, soil moisture increased due to the rising ground water level that had altered the physical properties of the land surface (i.e. thermal conductivity, albedo and evaporation), which led to local differences in latent heat flux and ground heat flux. Thirdly, the leaking out of trapped pore gases from underground to lower atmosphere had produced a local greenhouse effect, which resulted in more net radiation locally. Finally, positive holes were activated by stresses and recombined at the surface, which led to a stimulated electromagnetic emission in the TIR window and the heating of a thin surface layer.
multiple stations. Furthermore, a displacement anomaly index (DAI), reflecting the displacement fluctuation, was obtained by adding the number of outliers.
5. As the GPS simple-point displacement is affected by many factors such as seismic structure, motion mechanism and ionosphere disturbance, it connects loosely with specific earthquakes. Hence, multiple baseline-lengths reflecting the relative displacement between two stations were further analyzed.
4.3 Results
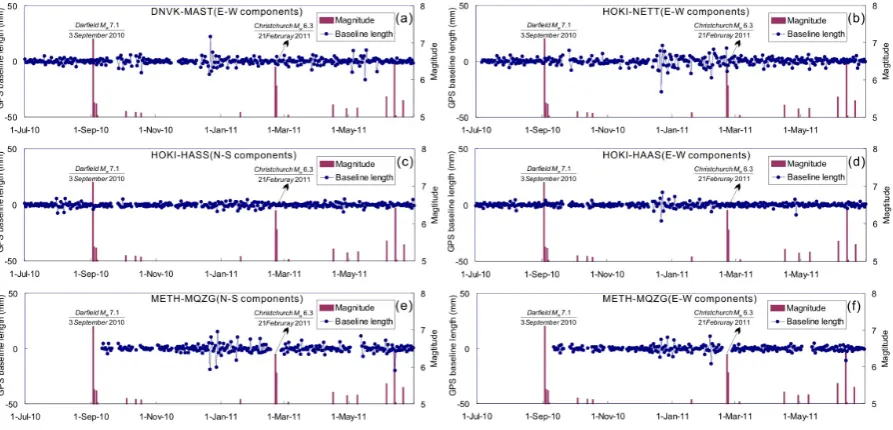
The DAI (Fig. 8) shows that multiple GPS stations had recorded synchronous fluctuations on 1 August, 4 Septem-ber, 18 OctoSeptem-ber, 21–23, 27 and 28 December 2010, and 16, 18 January, 5 and 6 February 2011, respectively. The GPS baseline-length change between two stations crossing three different tectonic activity zones (Fig. 7) shows that (1) In the south of the North Island, the E–W components of DNVK-MAST baseline-lengths elongated obviously on 22 December 2010; (2) At the two sides of AF, the E–W components of HOKI-NETT shortened obviously on 22 De-cember 2010; the N–S components of HOKI-HAAS elon-gated mildly on 31 July and 8 August 2010, respectively, and
shortened mildly on 1 and 7 August 2010, respectively; the E–W components of HOKI-HAAS shortened obviously on 21 December 2010 and elongated obviously on 22 Decem-ber 2010; (3) In the Canterbury Plains, the N–S components of METH-MQZG shortened obviously on 21 and 27 ber 2010, respectively, and elongated mildly on 28 Decem-ber 2010, and the E–W components of METH-MQZG elon-gated obviously on 27 December 2010 and 5 February 2011, respectively, and shortened obviously on 6 February 2011.
K. Qin et al.: Quasi-synchronous multi-parameter anomalies 1069
5 Discussion and conclusion
In general, local thermal and deformation anomalies ap-peared quasi-synchronously, not only about one month be-fore the mainshock of the 2010–2011 NZ earthquake se-quence, but also tens of days before the 21 February 2011 af-tershock (Fig. 8). Obviously, this is not a simple coincidence. What is the geophysical mechanism behind them? Here, in consideration of the existing mechanisms/hypotheses, we at-tempt to give a possible explanation.
Firstly, let us pay attention to the particular tectonic set-ting of NZ (Fig. 1). In HSZ, magmatic-hydrothermal fluids released at the upper surface of the subducting P-slab mi-grated upward through the lithosphere of the overlying A-plate. Groundwater near the magma got heated and more buoyant than the surrounding colder waters and rose through porous rock into the fractures deep underground, and then discharged at the surface through hot springs and steam-ing ground. There are numerous volcanoes and hot sprsteam-ings throughout the central North Island’s TVZ, while there are many more hot springs on the South Islands, most of which are strongly aligned along the AF. The AF hot spring system transits to the MFS in the northeast. Thermal waters from wells and springs also discharge in coastal Canterbury. From Figs. 4 and 5, it is clear that the thermal anomalies are lo-cated mainly in the southern MFS, which occupies many hot springs to the northeast of the epicenter, in the TVZ at the center of the North Island, and in the southwestern South Is-land, where geothermal zones are widely distributed.
Secondly, we need to understand the effect of rising groundwater on surface energy balance. The presence of shallow groundwater alters soil moisture, which will affect soil physical properties and thereby affect the different com-ponents of surface energy balance as in Eq. (1) (Rezapour et al., 2010). Specifically, (1) through its effect on the thermal conductivity of soil profile, groundwater increases the prop-agation of heat in the subsurface and thereby affects ground heat flux; (2) a temperature gradient in moist soil can in-duce a vapor pressure gradient, which can drive water vapor transport, hence leading to the increment of latent heat flux; (3) since albedo changes according to soil moisture(Idso et al., 1975), wet land surface zones reflect less shortwave radi-ation to the atmosphere due to their lower albedo, hence get-ting more net radiationRn (Eq. (2)). Over the past decades,
lots of changes were observed in water level, pressure, tem-perature and the composition of groundwater and soil mois-ture before some earthquakes, and they are believed to be in response to crustal strain (Mogi, 1982; Mil’kis, 1986; Mogi et al., 1989; Esposito et al., 2001). According to the website of www.stuff.co.nz, the GNS geochemist Dr. Agnes Reyes sampled the springs near Christchurch after the Darfield and Christchurch earthquakes, and found that more water was discharged and more gases were released. Although it was a post-earthquake report, it provided proof of the possible correlation between groundwater changes and the build-up
of tectonic deformation. In addition, the volumetric soil moisture at depth 0-10 cm from dataset in NCEP/NCAR Reanalysis Project and its relation with precipitation data from weather stations were analyzed. The time series of soil moisture on the epicenter pixel showed obvious peaks on 1 August 2010, 20, 27 and 28 December 2010, and 18 Jan-uary 2011, which were coincident with the dates that had thermal and deformation anomalies (Fig. 8a, b).There was no precipitation recorded at NZCH on 1 August 2010, 20 and 27 December 2010, though there were two precipitation events on 28 December 2010, and 18 January 2011 (Fig. 8b). On 28 December 2010 and 18 January 2011, the soil mois-ture on the epicenter pixel (zone-1 in Fig. 8c, d) was 35.9 % and 36.75 %, respectively, which was greater than 25.33%, the mean value from 1 July 2010 to 30 June 2011, while the soil moisture on the comparative pixel (zone-2 in Fig. 8c, d) was 26.75 % and 21.32 %, respectively, which was less than 29.29 %, the mean value from 1 July 2010 to 30 June 2011. Unlike the local soil moisture increment, the two precipita-tion events on 28 December 2010 and 18 January 2011 were regional events (Fig. 8c, d). Hence, the local increment of soil moisture on the epicenter pixel in contrast to the decre-ment of soil moisture on the comparative pixel, on 28 De-cember 2010 and 18 January 2011, was likely related to the NZ earthquakes rather than regional precipitation.
Thirdly, the Earth degassing and hence resulting green-house effects are also important contributors to pre-earthquake thermal anomalies. It is of common knowledge that crust rock contains pore gases at depth. The tectonic mo-tions and the crust deformamo-tions in the vicinity of the fault zone will result in crack developing, rock fracturing and gas leaking. Further, the release of underground pore gases, such as H2, He, CH4, CO2, O3, H2S and Rn, will change the air composition of the lower atmosphere and hence lead to a lo-cal greenhouse effect. This statement is confirmed by numer-ous observations in wells, sparse gas observations and ther-mal another-malies on the surface from tectonically active regions of the world (Biagi et al., 2000; Salazar et al., 2002) and the gases release (www.stuff.co.nz) could have contributed to the local thermal anomalies in NZ.
1070 K. Qin et al.: Quasi-synchronous multi-parameter anomalies
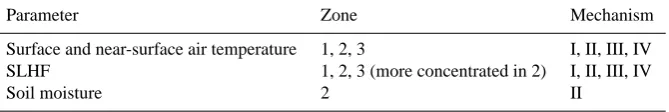
Table 1. The spatial relationship between multi-parameter anomalies and four mechanisms. Zones 1, 2 and 3 are the zones to the northeast
of the epicenter, in the center of the North Island, and in the southwestern South Island, respectively. Mechanisms I, II, III, and IV are magmatic-hydrothermal fluids upwelling, soil moisture increasing, underground pore gases leaking, and positive holes activating and recombing, respectively. Zone 2, where the New Zealand earthquake sequence located, is different form Zones 1 and 3 in obvious soil moisture anomaly, which brought with SLHF anomaly more concentrated.
Parameter Zone Mechanism
Surface and near-surface air temperature 1, 2, 3 I, II, III, IV SLHF 1, 2, 3 (more concentrated in 2) I, II, III, IV
Soil moisture 2 II
In a few words, the geophysical mechanism of multi-parameter anomalies associated with the 2010–2011 NZ earthquake sequence is not simple but multiple. The com-prehensive mechanisms can be interpreted with LCAC mode (Fig. 9).
Lithosphere-Coversphere Coupling: The long-term tec-tonic activity in the interface region between the P- and A-plates was enhanced in the latter period of the seismogenic process, which led to rock expansion and crack development in local subduction zone, hence providing abundant chan-nels for magmatic-hydrothermal fluids to get upwell from the deep crust and the mantle. Then, the convection heat flux (hot water and gas) caused local temperature to increase in partic-ular zones (the geothermal zones in the southern MFS to the northeast of the epicenter, in the TVZ at the center of the North Island, and in the southwestern South Island), which were connected with the subsurface fluids. Furthermore, the fluids moving upwards raised the groundwater level in shal-low aquifer, and consequently increased the soil moisture content locally. Moreover, the enhanced tectonic stresses in local zones had resulted in the trapped pore gases leaking out from subsurface to ground surface and to atmosphere, and had resulted in p-holes activating.
Coversphere-Atmosphere Coupling: On the one hand, the increment of local soil moisture further changed the prop-erties of land surface (i.e. thermal conductivity, albedo and evaporation), which affected the different components of the local surface energy balance, including the increment of la-tent heat flux due to higher pola-tential evaporation, the incre-ment of ground heat flux due to higher thermal conductiv-ity, and the increment of net radiation due to lower albedo. On the other hand, the increment of greenhouse gases in local atmosphere and the stimulated IR emission due to p-hole recombination led to the accumulation of heat near the surface. Furthermore, the surface temperature increment en-hanced the rate of energy exchange between surface and at-mosphere, resulting in the increment of SLHF. As a result of these synthetic effects, local thermal anomalies were found along with local crustal deformations.
Based on the above analysis to the local LCAC mode, we deduce that there existed four mechanisms associated with 2010–2011 NZ earthquake sequence:
I-magmatic-hydrothermal fluids upwelling via convection heats to the upper-lying ground layers; II-soil moisture increment due to the rise of ground water level, altering the physical proper-ties of land surface, and thereby affecting the different com-ponents of the surface energy balance; III-the underground pore gases leaking to the atmosphere absorbing more os the Earth’s infrared radiation due to the greenhouse effect, and thus leading to the accumulation of heat near the surface. IV-the p-holes activating and recombining, and thus releasing thermal energy.
The spatial adjacency (Table 1) and temporal quasi-synchronism (Fig. 8) of multi-parameter anomalies can be understood as well: with pre-earthquake crustal deformation (GPS displacement) appeared, in particular tectonic activity zones, a temperature (surface and near-surface air tempera-ture) and SLHF increase in the three geothermal zones due to mechanisms I, II, III, and IV, while a soil moisture in-crease only in the zone to the northeast of the epicenter and hence the local SLHF increment was more concentrated due to mechanism II.
Although the study on LCAC mode related with seis-mogenic process is preliminary, it is extremely significant for earthquake anomaly recognition and for the analysis of multi-parameter changes based on Global Earth Observation System of System (GEOSS) (Wu et al., 2012). LCAC mode and multi-parameter anomalies analysis will be helpful for seismicity monitoring and earthquake precaution.
Supplementary material related to this article is available online at:
http://www.nat-hazards-earth-syst-sci.net/12/1059/2012/ nhess-12-1059-2012-supplement.pdf.
Acknowledgements. This work was jointly supported by the
K. Qin et al.: Quasi-synchronous multi-parameter anomalies 1071
New Zealand, for providing a tectonic map on New Zealand. We acknowledge the New Zealand GeoNet project and USA NCEP/NCAR Reanalysis Project, for providing data used in this study.
Edited by: M. E. Contadakis
Reviewed by: M. Blackett and F. Freund
References
Alkhaier, F., Flerchinger, G. N., and Su, Z.: Shallow groundwater effect on land surface temperature and surface energy balance under bare soil conditions: modeling and description, Hydrol. Earth Syst. Sci. Discuss., 8, 8639–8670, doi:10.5194/hessd-8-8639-2011, 2011.
Beavan, R. J. and Haines, J.: Contemporary horizontal velocity and strain rate fields of the Pacific-Australian plate boundary zone through New Zealand, J. Geophys. Res.-Sol Ea., 106, 741–770, 2001.
Biagi, P. F., Ermini, A., Kingsley, S. P., Khatkevich, Y. M., and Gordeev, E. I.: Possible precursors in groundwater ions and gases content in Kamchatka (Russia), Phys. Chem. Earth, 25, 295–305, 2000.
Blackett, M., Wooster, M. J., and Malamud, B. D.: Exploring land surface temperature earthquake precursors: A focus on the Gujarat (India) earthquake of 2001, Geophys. Res. Lett., 38, L15303, doi:10.1029/2011GL048282, 2011.
Cervone, G., Singh, R. P., Kafatos, M., and Yu, C.: Wavelet max-ima curves of surface latent heat flux anomalies associated with Indian earthquakes, Nat. Hazards Earth Syst. Sci., 5, 87–99, doi:10.5194/nhess-5-87-2005, 2005.
Cicerone, R. D., Ebel, J. E., and Britton, J.: A systematic compi-lation of earthquake precursors, Tectonophysics., 476, 371–396, 2009.
Dey, S. and Singh, R. P.: Surface latent heat flux as an earth-quake precursor, Nat. Hazards Earth Syst. Sci., 3, 749–755, doi:10.5194/nhess-3-749-2003, 2003.
Esposito, E., Pece, R., Porfido, S., and Tranfaglia, G.: Hy-drological anomalies connected to earthquakes in southern Apennines (Italy), Nat. Hazards Earth Syst. Sci., 1, 137–144, doi:10.5194/nhess-1-137-2001, 2001.
Freund, F. T.:, Charge generation and propagation in igneous rocks, J. Geodynam., 33, 543–570, 2002.
Freund, F. T.: Pre-earthquake signals – Part I: Deviatoric stresses turn rocks into a source of electric currents, Nat. Hazards Earth Syst. Sci., 7, 535–541, doi:10.5194/nhess-7-535-2007, 2007a. Freund, F. T.: Pre-earthquake signals – Part II: Flow of battery
cur-rents in the crust, Nat. Hazards Earth Syst. Sci., 7, 543–548, doi:10.5194/nhess-7-543-2007, 2007b.
Freund, F. T., Takeuchi, A., Lau, B. W. S., Al-Manaseer, A., Fu, C. C., Bryant, N. A., and Ouzounov, D.: Stimulated infrared emis-sion from rocks: assessing a stress indicator, eEarth, 2, 7–16, 2007c.
Gorny, V., Sal’man, A. G., Tronin, A. A., and Shilin, B. V.: Outgo-ing terrestrial infrared radiation as an indicator of seismic activity (in Russian), Dokl. Akad. Nauk USSR., 30, 67–69, 1988. Idso, S. B., Jackson, R. D., Reginato, R. J., Kimball, B. A., and
Nakayama, F. S.: The dependence of bare soil albedo on soil water content, J. Appl. Meteorol., 14, 109–113, 1975.
Kalnay, E., Kanamitsu, M., Kistler, R., Collins, W., Deaven, D., Gandin, L., Iredell, M., Saha, S., White, G., Woollen, J., Zhu, Y., Leetmaa, A., Reynolds, R., Chelliah, M., Ebisuzaki, W., Higgins, W., Janowiak, J., Mo, K. C., Ropelewski, C., and Wang, J.: The NCEP/NCAR 40-year reanalysis project, B. Am. Meteor. Soc., 77, 437–470, 1996.
Koizumi, N., Kitagawa, Y., Matsumoto, N., Takahashi, M., Sato, T., Kamigaichi, O., and Nakamura, K.: Preseismic groundwater level changes induced by crustal deformations related to earth-quake swarms off the east coast of Izu Peninsula, Japan, Geo-phys. Res. Lett., 31, L10606, doi:10.1029/2004GL019557, 2004. Mil’kis, M. R.: Meteorological precursors of earthquakes,
Izvestiya, Earth Physics, 22, 195–204, 1986.
Mogi, K.: Temporal variation of the precursory crustal deformation just prior to the 1944 Tonankai earthquake, J. Seismol. Soc. Jpn., 35, 145–148, 1982 (in Japanese).
Mogi, K., Mochizuki, H., and Kurokawa, Y.: Temperature changes in an artesian spring at Usami in the Izu peninsula (Japan) and their relation to earthquakes, Tectonophysics., 159, 95–108, 1989.
Ouzounov, D. and Freund, T.: Mid-infrared emission prior to strong earthquakes analyzed remote sensing data, Adv. Space Res., 33, 268–273, 2004.
Pulinets, S., Ozounov, D., Karelin, A. V., Boyarchuk, K. A., and Pokhmelnykh, L. A.: The physical nature of thermal anoma-lies observed before strong earthquakes, Phys. Chem. Earth., 31, 143–153, 2006.
Qiang, Z. J., Xu, X. D., and Dian, C. G.: Thermal infrared anomaly precursor of impending earthquakes, Chin. Sci. Bull., 36, 319– 323, 1991.
Qiang, Z. J., Kong, L. C., Guo, M. H., and Wang, Y. P.: Laboratory research on mechanism of satellite infrared anomaly, Chin. Sci. Bull., 16, 1403–1404, 1995.
Qin, K., Guo, G. M., and Wu, L. X.: Surface latent heat flux anoma-lies preceding inland earthquakes in China , Earthq. Sci., 22, 555–562, 2009.
Qin, K., Wu, L. X., De Santis, A., and Wang, H.: Surface latent heat flux anomalies before the MS7.1 New Zealand earthquake 2010, Chin. Sci. Bull., 56, 3273–3280, 2011.
Rezapour, N., Fattahi, M., and Bidokhti, A. A.: Possible soil ther-mal response to seismic activities in Alborz region (Iran), Nat. Hazards Earth Syst. Sci., 10, 459–464, doi:10.5194/nhess-10-459-2010, 2010.
Saradjian, M. R. and Akhoondzadeh, M.: Thermal anomalies de-tection before strong earthquakes (M >6.0) using interquartile, wavelet and Kalman filter methods, Nat. Hazards Earth Syst. Sci., 11, 1099–1108, doi:10.5194/nhess-11-1099-2011, 2011. Salazar, J. M. L., Perez, N., Hernandez, P. A., Soriano, T.,
Bara-hona, F., Olmos, R., Cartagena, R., Lopez, D. L., Lima, R. N., Melian, G., Galindo, I., Padron, E., Sumino, H., and Notsu, K.: Precursor diffuse carbon dioxide degassing signature related to a 5.1 magnitude earthquake in El Salvador, Central America, Earth Planet. Sc. Lett., 205, 81–89, 2002.
Saraf, A. K. and Choudhury, S.: Satellite detects surface ther-mal another-malies associated with the Algerian earthquakes of May 2003, Int. J. Remote Sens., 26, 2705–2713, 2004.
1072 K. Qin et al.: Quasi-synchronous multi-parameter anomalies
(Izmit) earthquake, 17 August 1999, Remote Sens. Environ., 96, 409–426, 2005.
Tronin, A. A.: Satellite thermal survey-a new tool for the study of seismoactive regions, Int. J. Remote Sens., 41, 1439–1455, 1996. Wu, L. X., Liu, S. J., Wu, Y. H., and Li, Y. Q.: Changes in IR with rock deformation, Int. J. Rock Mech. Min., 39, 825–831, 2002. Wu, L. X., Liu, S. J., and Wu, Y. H.: Precursors for rock fracturing
and failure-part I: IRR image abnormalities, Int. J. Rock Mech. Min., 43, 473–482, 2006a.
Wu, L. X., Liu, S. J., and Wu, Y. H.: Precursors for rock fracturing and failure-part II:IRR T-curve abnormalities, Int. J. Rock Mech. Min., 43, 483–493, 2006b.
Wu, L. X. and Liu, S. J.: Remote Sensing Rock Mechanics and Earthquake Infrared Anomalies, edited by: Jedlovec, G., in: Adv. Geosci. Remote Sens, Sweden In-Teh., 709–741, 2009. Wu, L. X., Qin, K., and Liu, S. J.: GEOSS-Based Thermal