IJSRR, 8(1) Jan. –March, 2019 Page 120
Research article Available online www.ijsrr.org
ISSN: 2279–0543
International Journal of Scientific Research and Reviews
A Structural Equation Model for Consumers’ Buying Behaviour and
Satisfaction Towards Durable Goods in Erode District
M.Hemalatha
1*and P.Parimaladevi
21
Department of Commerce, Vellalar College for women (Autonomous), Thindal, Erode, Tamil Nadu, India
2
Department of E-Commerce, Vellalar College for women(Autonomous), Thindal, Erode ,India
ABSTRACT
Consumer behaviour can be characterized as “the decision-making process and physical action engaged with getting, assessing, utilizing and discarding merchandise and ventures”. Purchasing conduct is all psychological, social and physical conduct of potential client as they wind up mindful of assess buy devour and enlighten other individuals regarding the item and administrations. For the present study, the universe comprises of the consumers, who are utilizing durable products in Erode district. The sampling units have been selected by covering all the nine taluks of Erode district. The size of sample is 770 respondents. Both primary and secondary data were used in the study for the purpose of analysis. For collecting primary data, field survey technique was employed. Descriptive research has been considered the most appropriate for the study. The researcher used close-ended and open-ended questions in the questionnaire to collect primary data. Structural Equation Modeling, or SEM, is a very general, linear, cross-sectional statistical modeling technique. The Factor analysis, path analysis and regression represent the special cases of SEM. SEM is a largely confirmatory, rather than exploratory technique. The model is first estimated and the correlations or covariance matrix between the constructs or factors then serves as input to estimate the structural coefficients between constructs or latent variables.
KEYWORDS:
Discarding Merchandise, Ventures, SEM and Cross-Sectional Statistical Modeling Technique, Consumers’ Satisfaction, Perception, Learning, Attitude and Motivation.*Corresponding author
M. Hemalatha
Department of Commerce,
Vellalar College for women(Autonomous),
IJSRR, 8(1) Jan. –March, 2019 Page 121
E Mail Id- [email protected]
INTRODUCTION
Consumer satisfaction is the measure of how the requirements and reactions are teamed up
and conveyed to exceed expectations that consumer desire. It must be achieved if the consumer has a
general decent association with the supplier. In the present aggressive business commercial center,
consumer satisfaction is a vital execution example and essential differentiator of business
methodologies. Thus, the more is consumer satisfaction; more is the business and the holding with
consumer. Consumer satisfaction is a piece of consumer’s experience that uncovered a supplier’s
conduct on consumer’s desire. It additionally relies upon how proficiently it is overseen and how
speedily benefits are given. The satisfaction could be identified with different business angles like
manufacturing, engineering, quality of products and services, responses, customer’s problems and
queries, consummation of project, post delivery services, grievance administration and so on.
NEED OF THE STUDY
The model is useful, two different factors that need to be considered are inclusion and
propensity arrangement. Involvement refers to the subjective significance of the purchase and is a
component of money related and utilitarian significance, saw chance, enthusiastic esteem and sign
esteem. On the other hand, numerous choices can be found on propensity, propensity development
being an essential of brand dedication. Contingent upon the level of association and whether a
propensity has been framed or not, four sorts of purchasing choice develop: complex choices, mark
dedication, restricted choices, and latency. Consumer behaviour is significant in the scholarly world
for two great reasons. First, scholastics disperse information about consumer behaviour when they
show courses regarding the matter. Second, scholastics create information about buyer conduct when
they consider investigation concentrating on how customers act, think, and feel when procuring,
utilizing and discarding offerings. Thus, such scholastic research is valuable to promoting chiefs,
support gatherings, controllers and other people who need to understand consumer behaviour.
LITERATURE REVIEW
Priyadharshini and Selladurai, 20091 A study on Customers Satisfaction towards Sony
Television in Salem City” ,identified in their research, the attitude of the customers dealing with
Sony Television in Salem city. The main objective of the study was to find out the customer
satisfaction towards Sony television. The study was based purely on primary data which were
collected using the personal contact approach. Questionnaires were distributed to a sample of 100
respondents in Salem city. Simple random sampling method was adopted for the study. Simple
IJSRR, 8(1) Jan. –March, 2019 Page 122
the market leader. Sony Television had to come up with more innovative promotional campaigns in
order to gain more consumers. Since, most of the respondents were expressed a position note on
factors like company image, price and perfection, it was indeed the manufacturer’s duty to maintain
the above factors at the same time with a view to retain the top position in the market.
Rajendraprasad, et al., 20122A relative analysis on customers’ satisfaction of microwave
oven: study on select companies” aimed to analyze the satisfaction level of customers towards
microwave oven products of LG, Onida& Videocon. The objectives of this research were to identify
and compare the customer satisfaction level for the select microwave companies and to study the
existing customer satisfaction strategies adopted by the select microwave companies. The sample
size of 300 respondents was taken from three major cities like Hubli, Dharwad and Belgaum of
North Karnataka by using simple random sampling method. The data was analyzed with statistical
tools like standard deviation, arithmetic mean and hypothesis was tested with chi-square test. They
concluded than the users of LG microwave were satisfied at a higher enormity that the domestic
firms, Videocon and Onida. Also, the study revealed that the LG firm was highly customer oriented
and known for making customer driven innovative and superior quality products. LG products had
proved themselves about their advanced technology, be it television, microwave oven or washing
machine and all these have outperformed domestic company products.
Richard Chinomona, et al., 20133 “Brand Service Quality, Satisfaction, Trust and
Preference as Predictors of Consumer Brand Loyalty in the Retailing Industry” sought in their
research to explore the direct effects of brand service quality on consumer brand satisfaction and
brand trust and the mediating role of brand satisfaction and trust in brand service quality, brand
loyalty relationship. A sample size of 151 South African consumers in Gauteng was selected. In this
study, structural equation modelling (SEM) approach using Smart (PLS) statistical software was
used to test the posited hypotheses in the conceptual research model. The results indicated that brand
service quality had a stronger effect on brand satisfaction than it had on brand trust. The relationship
between brand satisfaction and brand trust was altogether solid. This finding demonstrated that brand
benefit quality had a critical effect on brand trust by means of brand fulfilment. This implied that
purchaser would not believe the administration nature of a brand fulfilment. This implied that
purchaser would not believe the administration nature of a brand unless they were happy with that of
brand's administration quality.
OBJECTIVES
IJSRR, 8(1) Jan. –March, 2019 Page 123
2. To offer better ways and means to improve the satisfaction level of the consumers and
increase the market share of the durable products.
RESEARCH HYPOTHESES
H1-H3 : There is no significant association between age, family monthly income, amount
spent per annum and Perception.
H4-H6 : There is no significant association between age, family monthly income, amount
spent per annum and Learning.
H7-H9 : There is no significant association between age, family monthly income, amount
spent per annum and Attitude.
H10-H12 : There is no significant association between age, family monthly income, amount
spent per annum and Motivation.
H13-H16 : There is no significant association between Perception, Learning, Attitude, Motivation
and Level of Satisfaction towards Consumer Durable Goods.
METHODOLOGY
This study is systematically and scientifically organized. The validity of any research
depends on the systematic method of data collection and analyzing the same in a logical and
sequential order. It has made an extensive use of both primary and secondary data. It describes
consumers’ buying behavior and satisfaction towards consumer durable goods in Erode District and
hence the study is descriptive in nature.
DATA ANALYSIS AND INTERPRETATION
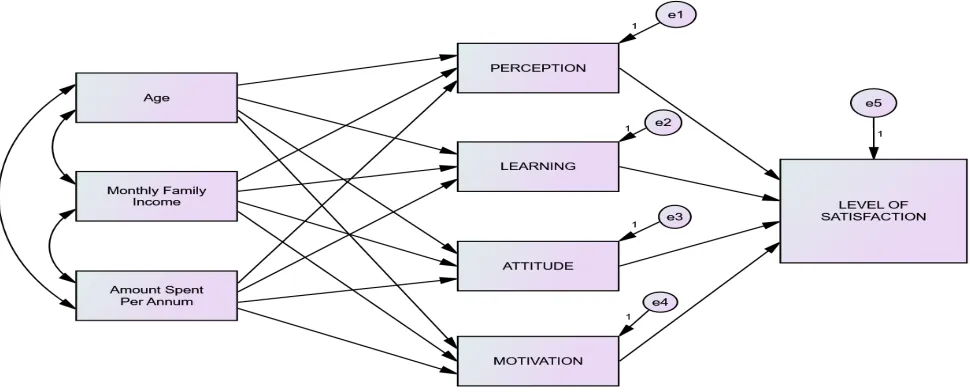
In order to ascertain the relationship between consumer buying behaviour and satisfaction
towards consumer durable products, the researcher has taken the following variables for constructing
the model. For this, demographic variables like ‘age’, ‘family monthly income’, ‘amount spent for
purchasing durable goods per annum’ have been selected, followed by four dimensions of buying
behavior variables like ‘Perception’, ‘Learning’, ‘Attitude’ and ‘Motivation’, and ‘Level of
Satisfaction’ of the consumers towards consumer durable goods. The model is tested based on the
IJSRR, 8(1) Jan. –March, 2019 Page 124
Figure 1. Hypotheses Model for Consumer Buying Behavior and Satisfaction
Testing a measurement model underlies a full structural model. If the fit of the measurement
model is found acceptable, then one should proceed to test the structural model. The structural
equation model is conducted to assess the construct validity by using the maximum likelihood
method. The confirmatory test result showed good fit as shown in the following model fit summary
table.
Table 1 : Model Fit Summary
No. Test Factor Value Criteria* Result
1 Chi-Square 38.383 p>0.05 1% level
2 Chi-Square / df (9) 4.267 2.0–5.0 Good Fit
3 GFI (Goodness-of-fit index) 0.968 >0.90 Good Fit
4 AGFI (Adjusted goodness-of-fit index) 0.917 >0.90 Good Fit
5 CFI (Comparative fit index) 0.933 >0.90 Good Fit
6 NFI (Normed fit index) 0.928 >0.90 Good Fit
7 TLI (Tucker-Lewis index) 0.913 >0.90 Good Fit
8 RMSEA (Root mean square error of approximation) 0.014 <0.07 Good Fit
* Criteria recommended by Schumacker & Lomax 20044, Hu and Bentler 19995 and Hair et al., 19986
The model is said to fulfill the criteria of goodness of fit, if it satisfies certain values which
are given by the table 1. Based on these values, estimated value for the model is 4.267 which is
significant and satisfy the required basic condition. Followed by the values 0.968 for GFI, 0.917 for
AGFI, 0.933 for CFI, 0.928 for NFI, 0.913 for TLI confirms the good model fit for the constructed
IJSRR, 8(1) Jan. –March, 2019 Page 125
the result.
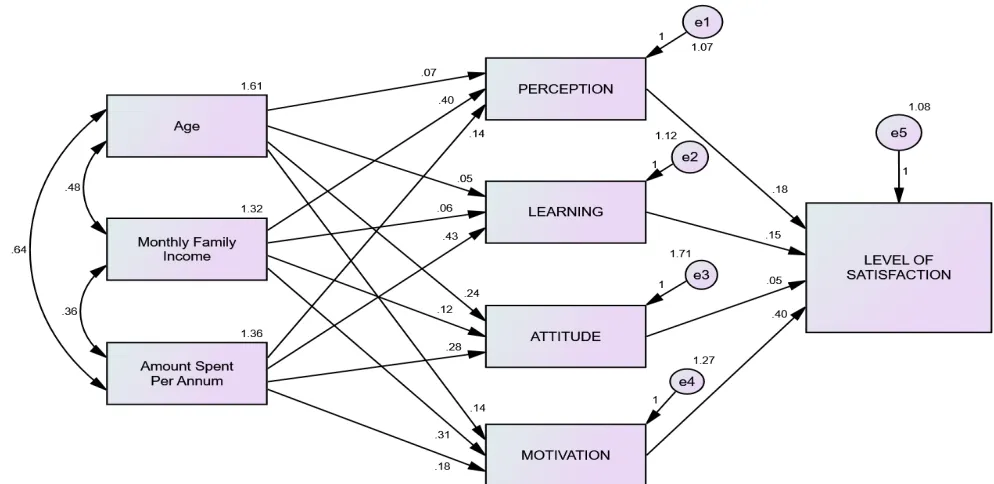
Figure 2. Resulted Hypotheses for Consumer Buying Behaviour and Satisfaction Table 2: Regression Weights
Hypothesis
No. Measured Variable Latent Variable Estimate S.E. C.R. ‘p’ value
H1 Age Perception 0.072 0.034 2.159 0.031**
H2 Family Monthly
Income Perception 0.403 0.035 11.604 0.000*
H3
Amount Spent per
Annum Perception 0.137 0.036 3.822 0.000*
H4 Age Learning 0.049 0.034 1.434 0.152NS
H5
Family Monthly
Income Learning 0.062 0.036 1.740 0.082
NS
H6 Amount Spent per
Annum Learning 0.428 0.037 11.654 0.000*
H7 Age Attitude 0.236 0.042 5.553 0.000*
H8 Family Monthly
Income Attitude 0.124 0.044 2.823 0.005*
H9 Amount Spent per
Annum Attitude 0.279 0.045 6.148 0.000*
H10 Age Motivation 0.143 0.037 3.920 0.000*
H11
Family Monthly
Income Motivation 0.311 0.038 8.209 0.000*
H12
Amount Spent per
Annum Motivation 0.185 0.039 4.730 0.000*
H13 Perception Level of
Satisfaction 0.178 0.033 5.403 0.000*
H14 Learning Level of
Satisfaction 0.147 0.032 4.554 0.000*
H15 Attitude
Level of
Satisfaction 0.055 0.027 2.031 0.042**
H16 Motivation Level of
Satisfaction 0.403 0.031 13.003 0.000*
IJSRR, 8(1) Jan. –March, 2019 Page 126
FINDINGS
It is understood from the above analysis that,
The relationship of Perception with the selected measured variables noticed that the null
hypotheses 1, 2 and 3 are rejected due to significant results. So, it is observed that there is a close
significant association between the selected measured variables namely age, family monthly income,
amount spent per annum and Perception. Further, all the selected relationships have positive
association.
Considering the relationship between the selected three measured variables and Learning, the
null hypothesis 6 is rejected owing to the significant result and remaining two hypotheses 4 and 5 are
accepted due to insignificant results. Hence, there is a significant relationship between the amount
spent per annum and Learning of the respondents. Further, there is no significant relationship
between age, family monthly income and Learning of the respondents.
In the case of relationship between three demographics and Attitude of the consumers, all the
null hypotheses 7, 8 and 9 are rejected due to significant result. So, it is identified that there is a
significant association between the age, family monthly income, amount spent per annum and
Attitude of the consumers. Further, all the selected relationships have positive significant association.
The relationship between three measured variables and the latent variable Motivation, the
null hypotheses 10, 11 and 12 are rejected due to significant results. It is observed that Motivation
has a significant association with the measured variables namely age, family monthly income and
amount spent per annum. Further, all the selected relationships have positive significant association.
Finally, while considering the relationship between four dimensions of buying behavior and
level of satisfaction of the consumers towards consumer durable goods, the null hypotheses 13, 14,
15 and 16 are rejected due to registration of significant results.
It indicates that level of satisfaction towards consumer durable goods has a significant
relationship with the variables Perception, Learning, Attitude and Motivation.
CONCLUSION
The result of structural equation modeling has found that when there is an increase in age and
family monthly income of the consumers, then their perception, attitude and motivation towards
durable products also increases. When the amount spent per annum by the consumer increases, their
perception, learning, attitude and motivation also increases positively. On the other hand, when the
four dimensions of buying behavior like perception, learning, attitude and motivation of the
IJSRR, 8(1) Jan. –March, 2019 Page 127
REFERENCES
1. Priyadharshini, J., & Selladurai, M. A study on Customers Satisfaction towards Sony
Television in Salem City. International Journal in Multidisciplinary and Academic Research,
2009; 2 (2), 1-9.
2. Rajendraprasad, Hanagandi, K. Filipe Roduguese Melo, & Shrinivas Patil, A relative analysis
on customers’ satisfaction of microwave oven: study on select companies. International
Journal of Multidisciplinary Research, 2012; 2 (2), 343-356.
3. Richard Chinomona, Donald Mahlangu, & David Pooe, Brand Service Quality, Satisfaction,
Trust and Preference as Predictors of Consumer Brand Loyalty in the Retailing Industry.
Mediterranean Journal of Social Sciences, 2013; 4 (14), 181-190.
4. Schumacker & Lomax A Beginner's Guide to Structural Equation Modeling, 2nd Edition,
New Jersey : Lawrence Erlbaum Associates, 2004; 61-123
5. Hu, L.T. & Bentler, P.M. Cutoff criteria for fit indexes in covariance structural analysis:
Conventional criteria versus new alternatives. Structural Equation Model, 1999; 6, 1-55.
6. Hair, J. F. Jr, Anderson, R. E., Tatham, R. L. & Black, W. C. (1998). Multivariate Data