doi:10.5194/nhess-11-2453-2011
© Author(s) 2011. CC Attribution 3.0 License.
and Earth
System Sciences
A coastal storms intensity scale for the Catalan sea
(NW Mediterranean)
E. T. Mendoza1,*, J. A. Jimenez1, and J. Mateo2
1Laboratori d’Enginyeria Mar´ıtima, Universitat Polit`ecnica de Catalunya, Barcelona, Spain 2Servei Meteorol`ogic de Catalunya, Barcelona, Spain
*now at: Laboratorio de Ingenieria y Procesos Costeros, Ins. Ing., Sisal, Yucatan, Mexico
Received: 20 June 2010 – Revised: 10 February 2011 – Accepted: 28 June 2011 – Published: 15 September 2011
Abstract. A 5-class intensity scale for wave storms in the Catalan coast is presented. This has been done by analysing a storm data set which comprises 5 buoys during the pe-riod 1988/2008. The obtained classification improves the former proposal of Mendoza and Jim´enez (2008) by better resolving spatial and temporal variability in wave storms in the area. The obtained classification reflects the increase in wave storm properties as the storm category increases. Because the selected classification parameter was the en-ergy content which implicitly containsHs and storm dura-tion, this variable was used to define class limits; class I storms (24–250 m2h), class II storms (251–500 m2h), class III (501–700 m2h), class IV storms (701–1200 m2h) and class V storms (>1200 m2h). The energy content variable was also used as proxy for induced hazards; the observed in-crease in energy content for higher classes reflected a signifi-cant increase in the intensity of the potential hazards. Lastly, the dominant synoptic situation for wave storms along the Catalan coast was the presence of a Mediterranean cyclone although a direct correspondence on cyclone’s intensity over the western Mediterranean with wave energy content was not found.
1 Introduction
A storm can be defined in a simple manner as a violent atmo-spheric perturbation accompanied by strong winds, among other elements. When this happens in the sea, the most im-mediate effects are the increase in wave height and some-times sea level (storm surge). These events drive a series of morphodynamic responses such as beach and dune erosion,
Correspondence to: J .A. Jimenez (jose.jimenez@upc.edu)
overwash and inundation of low-lying areas that have im-portant consequences upon the coastal geomorphology. The magnitude of these processes and responses is proportional to the storm energy content and, in this sense: high-energy storms can significantly accelerate existing rates of shoreline erosion (Morton and Sallenger, 2003).
The practical consequences of these processes include great damage to existing infrastructure, disturbance of coastal ecosystem services, and a negative effect on coastal use in general. The importance of storm events and their induced hazards is explicit in the Protocol on ICZM in the Mediterranean (PAP/RAC, 2007), signed in 2008 by the EU and the Mediterranean countries. This Protocol includes a specific chapter on Natural Hazards (Chapter 22), in which the parties are advised to undertake vulnerability and hazard assessments of coastal zones and take prevention, mitigation and adaptation measures to address the effects of natural dis-asters.
One of the simplest approaches with which to estimate the impact of these events is based on the use of an inten-sity storm scale where each storm is associated to a given class in terms of a variable characterising its hazardous po-tential. Examples of such approaches are the well-known Saffir-Simpson scale for hurricanes (Simpson, 1971; Saffir, 1977) or the scale proposed by Dolan and Davis (1992) for Atlantic storms.
Fig. 1. Study area and location of buoys and wave prediction nodes.
Catalan coast from north to south to cover all possible spatial variations in storm conditions.
Within this context, the main aim of this work is to obtain an intensity scale for wave storms in the Catalan coast (NW Mediterranean) and to identify the main synoptic situations driving such events. This will result in a storm classifica-tion where each class will be characterized in terms of wave height, wave period, duration and energy content.
2 Study area and data
Catalonia is situated in the NE coast of Spain in the Mediter-ranean Sea (Fig. 1). It has a coastline about 600 km long and is characterized by great geodiversity. It can be divided in 7 coastal units (Mendoza, 2008) comprising cliffs and rocky coasts, sandy beaches and wetlands. Approximately 40 % of the coast is formed by sandy beaches of different types and dimensions, from long to pocket beaches.
The Catalan coastal zone concentrates approximately 50 % of the population and it contributes up to 10 % of the Catalan GDP, with tourism being one of the most important economic activities in the area (e.g. Sard´a et al., 2005). It concentrates a large number of infrastructures and, at present, about 70 % of the beaches are subjected to erosion processes and more than 50 % of the coastal municipalities have re-ported some damages in existing infrastructures in beaches (CIIRC, 2009).
The data used in this study to characterize storms are wave records obtained from 5 wave buoys located along the Cata-lan coast which permit us to cover any spatial variability in wave conditions (see location in Fig. 1). The operating pe-riod, type of instrument (omnidirectional-scalar- and direc-tional) and depth of each buoy can be seen in Table 1.
Table 1. Main characteristic of wave buoys (O: omnidirectional
(scalar) buoy D: directional buoy).
Buoy Type Dates Depth (m)
Roses O 1992/97 2000/08 46
Palam´os O 1988/2008 90
Tordera O D 1984/97 2000/07 2007/08 74 Llobregat O D 1984/97 2000/04 2004/08 45
Tortosa D 1990/2008 60
In the area, there is a larger database built up by 44-yr hindcast wave data (1958–2001) obtained within the HIPOCAS project (Guedes Soares, 2008; Ratsimandresy et al., 2008). Although this database is extremely useful to an-alyze long-term trends and large spatial patterns, when the interest is to analyze real values at any location during storm conditions, modelled data may differ from real ones (Bola˜nos et al., 2007; Ponce de Le´on and Guedes Soares, 2008). As an example, Casas-Prat and Sierra (2010) using Hipocas data for the Catalan coast found differences in the wave height up to 1.75 m for the original data and up to 2.83 m for the calibrated data set during storm conditions. Due to this and taking into account that the final objective is to derive a clas-sification for coastal storms based on “real” wave charac-teristics, it was decided to use the recorded values whereas hindcasted values are only used to see the exceptionality of a given storm in the long-term.
The data used to classify synoptic situations of weather conditions over the Catalan coast were fields of sea-level pressure (SLP) and geopotential heights at the 500 hPa level (Z500) during identified storm events. They have been ob-tained from ERA-Interim reanalysis done by European Cen-tre for Medium Weather Forecast (ECMWF).
3 Methodology
To develop a storm classification, three main steps have to be done: (1) storm definition and identification, (2) selection of the parameter to characterize the storms according to a given criteria, and (3) selection and application of a classification method.
inter-event separation of 72 h and a period of Hs<1.5 m shorter than 6 h is considered a single two-peaked storm (Mendoza and Jim´enez, 2006). This was done because some cases where the evolution of meteorological conditions result in the presentation of twin peaks storms were detected.
Because one of the main objectives of the classification is to provide an idea about the potential hazards induced by the storms, the classification variable should reflect their inten-sity. To this end, the storm “energy content”,E, is used and is given by
E=
Z t2
t1
Hs2dt (1)
wheret1 andt2 define the storm duration (Hs> Hs thresh-old). The use of a single wave height value to characterize the storm (e.g. storm-averagedHs or Hs at the peak of the storm) might result in an underestimation or overestimation of the actual wave storm energy.
Once storms were identified and characterized by their en-ergy content for all buoy records, they were integrated into a single storm data set. The practical result of this inte-gration is that one meteorological event can be represented in the dataset by different wave values reflecting the spatial variability of the event. This is clearly illustrated in Fig. 2, where wave records at different locations along the Catalan coast during a storm on December 2008 show very differ-entHs values. With this approach, it was possible to take into account that the same meteorological event is able to produce wave storms of different energy contents along the coast. The objective of this data aggregation is to build up a database comprising all the possible wave characteristics typical of storm conditions at any location along the Cata-lan coast in such a way that the derived classification should cover the possible range of storm conditions. With obvi-ous differences, the idea behind this aggregation is similar to the technique applied in Regional Frequency Analysis where “space is traded for time”, i.e. data from several sites are used to estimate event frequencies at that – spatially integrated – site.
Finally, the classification process was carried out by means of cluster analysis, which permits the reduction of the amount of data by categorizing or grouping them in terms of similarity. In this study the average linkage method was used, and although it tends to produce a great number of small groups, it is generally superior to other clustering methods and has been successfully used in climate studies (see Bunkers et al., 1996).
In order to reduce the tendency to produce a large number of groups, a supervised classification was applied to resulting clusters to produce a 5 category classification considering the obtained dendrogram partition, the cluster consistency and the energy content variation within each group. The selection of a 5 categories scale was made to maintain the analogy with existent storm scales (Simpson, 1971; Saffir, 1977; Dolan and Davis, 1992; Mendoza and Jimenez, 2008). The selected
Fig. 2. Spatial variability along the Catalan coast during a storm in
Fig. 3. Storm classification using cluster analysis (solid lines) and
supervised classification (dashed lines). Numbers in the x-axis are clusters’ identifiers.
scale categorizes the storms into: I – weak, II – moderate, III – significant, IV – severe and V – extreme.
Once recorded storms were classified, the corresponding synoptic situations generating these events were identified. To do this, SLP and Z500 fields recorded every 6 h during the storm development were analyzed and categorized into three main synoptic situations according to the position of the low and high pressure centres over Spain (see Sect. 4.4).
As an example of potential management applications, the magnitude of the two most common storm-induced hazards in beaches was estimated: beach profile erosion and inunda-tion. The representative value for each class has been calcu-lated by averaging all the values calcucalcu-lated for each individ-ual storm belonging to the corresponding class. In order to cover the variations in hazard intensity due to existing differ-ences in beach characteristics along the Catalan coast, two representative beach profiles have been selected following Mendoza and Jim´enez (2009): (i) a reflective profile com-posed by coarse sand, a high berm and a steep slope, which is representative of areas such as Costa Brava (N coast) and Maresme (central coast) and, (ii) a dissipative profile, com-posed by fine sand, a low berm and very mild slopes which is especially frequent from Barcelona to the south. The ero-sion hazard has been characterized by estimating the poten-tial volume of sediment eroded from the beach during the impact of the storm. To characterize the inundation potential of a given storm the wave-induced maximum water level at the shoreline was used, i.e. the wave run-up. Inundation is the result of the excess of water level with respect to land elevation and, to evaluate it, the coastal topography should be required. Since this work is only interested in assessing
Fig. 4. Class-averaged values of wave storm properties in the
Cata-lan coast.
the contribution of the forcing (storm) to such a process, the induced run-up as a proxy of the inundation potential of the considered storm was used. The erosion volume was calcu-lated using the parametric model proposed by Mendoza and Jim´enez (2006) and the run-up was calculated by using the model proposed by Stockdon et al. (2006).
4 Results
4.1 Storm classes
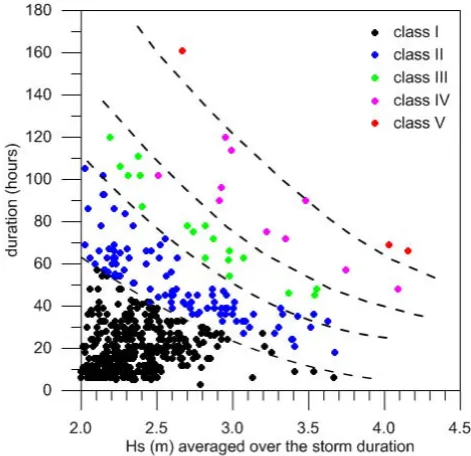
The application of the selectedHsthreshold criteria resulted in a total number of 599 storm records in all the analyzed buoys from 1988 to 2008. It has to be taken into account that this number does not correspond to the number of mete-orological events since, in most of the cases, the same forc-ing event is recorded as a wave storm in different locations (buoys) with different characteristics (e.g. Fig. 2). These 599 storm records along the coast correspond to 286 mete-orological stormy situations that represent an average pre-sentation of 13 events per year during the period 1988/2008. The application of the clustering analysis is shown in Fig. 3 and the resulting class-averaged values ofHs,Tp, du-ration and energy content for each storm type can be seen in Fig. 4 and Table 2. As it can be observed, the increase in storm category is accompanied by an increase in all wave variables at different rates. One of the consequences of hav-ing a classification based on the storm energy content is that to properly classify a given event, it is necessary to take into account the two variables controlling its magnitude (Eq. 1): wave height and duration (Fig. 5).
Table 2. Averaged characteristics of storm classes recorded during
the period 1988–2008.
Storm Hsmax Tpmax Duration Energy
class (m) (s) (h) (m2h)
I 2.8 9.2 19 110 (24–250)
II 3.5 10.8 52 350 (250–500) III 4.4 11.6 77 610 (501–700) IV 5.1 12.1 86 950 (701–1200) V 6.6 12.6 99 1300 (>1200)
1993; Jim´enez et al., 1997). The wave height at the peak of the storm increases about 2.5 times in the full range of cate-gories whereas the duration increases about 5 times. Finally, the largest increase in magnitude was observed for the en-ergy content in such a way that the E of category-V storms is 13 times larger than category-I events. These results indicate that the produced classification clearly reflects the variations in wave storm magnitudes and, in particular, the increase from one category to the upper ones will reflect a significant increase in the storm wave content and, in consequence, in its hazard potential.
In terms of frequency of occurrence, and as expected, the smaller the storm category is, the most frequent the event will be. Thus, from the 599 storm records, 77.8 % fall into class I-weak, 17.03 % are class II-moderate-, 3 % are class III-significant, 1.67 % are class IV-severe and, only the 0.5 % (3 cases) belongs to class V-extreme. This can also be ex-pressed in terms of probability of occurrence (or the equiva-lent return period,TR, obtained after fitting an extreme dis-tribution). Thus, for instance, the estimated return periods of each class at the S part of the Catalan coast are: (I)<1 yr; (II)∼2 yr; (III)∼5 yr; (IV)∼10 yr; (V)∼50 yr. It has to be considered that the probability of occurrence of each storm category varies along the coast. In this sense, the central part of the Catalan coast (Llobregat buoy in Fig. 1) can be classi-fied as the mildest zone in terms of the storms’ energetic con-tent in such a way that, it is the area with the smallest num-ber of recorded storms of highest categories (one category-IV event and none of category-V have been recorded).
4.2 Direction and seasonality
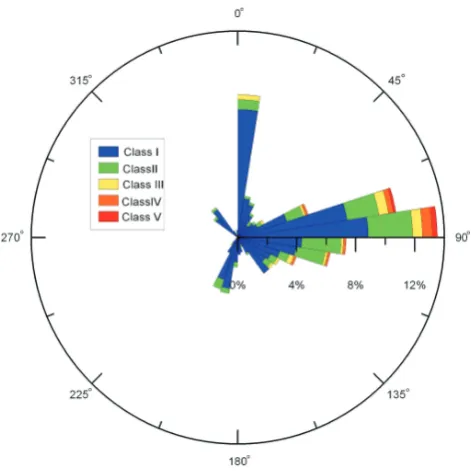
Figure 6 shows the direction distribution of wave storms dur-ing the analyzed period for each category, where three main components are identified: Eastern (E), Northern (N) and Southern (S). From these, the E sector presented the largest number with 57 % of the total number of storms; in addition the most energetic storms registered (belonging to class IV and V) are associated to this directional sector. This result is consistent with previous observations that classified the E storms as the most energetic in the Catalan coast due to the
Fig. 5. Storm-averagedHsand duration for each category for all the recorded events.
associated fetch and wind regime in the area (Garc´ıa et al., 1993; Jim´enez et al., 1997).
The second most represented sector is the N, and it cor-responds to storms occurring at the northernmost part of the Catalan coast which are produced by locally generated very strong winds, the Tramuntana. Its influence in the central and southern coast is negligible.
The S storms are the least frequent in the area, with about a 20 % of occurrence. These storms have usually low energy contents, in such a way that they have only been registered as class-I and class-II events. However this does not mean that their effects should be neglected. Thus, their presence along the Catalan coast in periods of absence of E storms can induce important beach rotation processes in embayed beaches (see e.g. Jim´enez et al., 2003; Ojeda and Guill´en, 2008).
Fig. 6. Directional distribution of storms in the Catalan coast during
the period 1988/2008.
most intense period in cyclogenesis over the basin occurs (Lionello et al., 2006).
4.3 Potential hazards
Figure 8 shows the estimated class-averaged representative volume loss potential and run-up values for the Catalan coast. As expected, the higher the intensity of the storm, the larger the eroded volume will be. Thus, mean eroded volume val-ues range from about 10 m3/m/storm to 100 m3/m/storm for classes I and V, respectively, in reflective beaches and from 7 m3/m/storm to 25 m3/m/storm for dissipative ones. This means that the increase in the magnitude of the erosion po-tential due to the increase of storm category mainly affects reflective beaches. It has to be considered that these amounts represent the erosion capacity of the storm and that they will verify only if such volume is available at a given coastal stretch. In other words, they characterize the contribution of the forcing (storm) to the considered hazard (erosion).
In the case of inundation potential, similar results are found. The runup values range from about 1.75 to 3.75 m for classes I and V, respectively, in reflective beaches and from 0.75 to 1.5 m for dissipative ones. As expected, the higher the intensity of the storm, the larger the run-up mag-nitude. Thus, the run-up is doubled from class-I storms to class-V ones. For the analyzed beaches, the estimated run-up for reflective conditions is about two times larger than the one associated to dissipative ones.
Fig. 7. Seasonal distribution of storms in the Catalan coast during
the period 1988/2008.
4.4 Synoptic situations
After the analysis of synoptic maps observed during the iden-tified storms, three main synoptic situations were found to dominate over the Catalan Sea. They are:
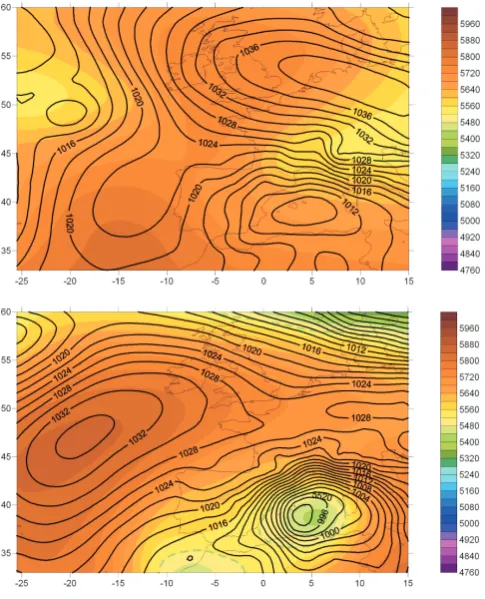
Mediterranean Cyclone (MC). It is characterized by a low pressure centre over the W Mediterranean (Fig. 9). These storms can present mesoscale features and weak intensity or they can cover a wide area with a strong in-tensity (e.g. Radinovic, 1987; Campins et al., 2000). As an example of this variability, Fig. 9 shows two differ-ent patterns of pressure gradidiffer-ents associated to this sit-uation. Cyclogenesis mechanisms in the Mediterranean have been largely analyzed in the literature (see e.g. Trigo et al., 2002).
South Advection (SA). This situation is characterized by the presence of a low pressure centre over the Atlantic. This centre usually generates large pressure gradients at sea level (Fig. 10). The low pressure area is usually large and the Catalan coast can be affected and be sub-jected to the action of southern winds of varying main direction (SE, S, SW).
East Advection (EA). This situation is characterized by the presence of a high pressure centre over North or Central Europe and a low-pressure centre over North Africa. It could also be classified as MA-like. This re-sults in eastern winds blowing along the Catalan coast (Fig. 11).
Fig. 8. Magnitude of storm-induced coastal hazards in representative beaches of the Catalan coast (left: beach profile erosion, right: wave
run-up).
Table 3. Synoptic situations for the most intense storms identified along the Catalan coast during the period 1984–2008.
start date end date duration Hs E storm synoptic (dd/mm/yy) (dd/mm/yy) (hours) (m) (m2h) category situation
09/11/2001 16/11/2001 161 6.0 1370 V MC 26/12/2008 29/12/2008 69 7.5 1300 V MC 14/10/2003 19/10/2003 112 6.3 1230 V MC 29/01/1996 03/02/1996 120 5.7 1150 IV SA 16/12/1997 19/12/1997 75 5.8 880 IV SA 21/12/2000 25/12/2000 90 4.5 820 IV SA 14/12/2001 17/12/2001 72 6.0 700 IV MC 25/02/2003 28/02/2003 81 4.6 670 III SA 28/10/1997 30/10/1997 45 5.2 660 III MC 28/03/2004 03/03/2004 159 4.6 650 III SE 17/02/2003 21/02/2003 102 4.5 640 III SA 05/12/2004 10/12/2004 120 3.5 620 III MC 20/12/2006 24/12/2006 106 3.0 550 III SE 03/01/2008 05/01/2008 46 4.9 550 III SA 16/11/1989 19/11/1989 63 3.8 540 III SA 08/10/1990 11/10/1990 75 4.5 530 III MC 06/05/2002 09/05/2002 62 4.1 420 III SE 28/01/2006 31/01/2006 78 4.3 410 III MC
ones (category V) only being developed under this situa-tion. Category-IV storms verify under MC and SA situations whereas EA only produces category-III events.
If we compare the eight most intense storms identified from cyclone‘s intensity reported by Genov´es et al. (2006) with the classified wave storms presented, only one of them corresponds to a category-V event (November 2001). This was classified in 7th position in the cyclone’s intensity rank-ing whereas in the wave energy rankrank-ing it occupies the first place. The remaining most-intense cyclones occurred out of the buoys operation period and, in consequence, no
instrumental data was available to check wave properties. However, if wave characteristics during those storms are ob-tained from existing hindcast wave data in the area (Guedes-Soares et al., 2002), the estimated wave height and energy were lower than the ones during the November 2001 storm. In other words, a direct correspondence between cyclone’s intensity and induced wave storms was not observed.
Fig. 9. SLP (lines) and Z500 (colours) during an MC situation. Top:
28/10/1997 at 12:00 UTC; bottom: 11/11/2001 at 06:00 UTC, map from ERA-Interim reanalysis done by European Centre for Medium Weather Forecast (ECMWF).
Fig. 10. SLP (lines) and Z500 (colours) during an SA situation.
22/12/2000 at 12:00 UTC from ERA-Interim reanalysis done by Eu-ropean Centre for Medium Weather Forecast (ECMWF).
have a potential for highly destructive effects on Mediter-ranean coast and, although they are relatively unusual, they have identified about 15 cases during a period of 20 yr. but only one of the 4 most intense identified on the western Mediterranean basin (Catalan-Balearic Sea) coincides with a wave storm along the Catalan coast (October 2003).
Fig. 11. SLP (lines) and Z500 (colours) during an EA situation. 07/05/2002 at 12:00 UTC from ERA-Interim reanalysis done by Eu-ropean Centre for Medium Weather Forecast (ECMWF).
5 Summary
In this work a 5-class intensity scale for wave storms in the Catalan coast (NW Mediterranean) is presented. This has been done by using the entire available wave instru-mental data set which comprises 5 buoys during the period 1988/2008 covering the Catalan coast from north to south. In this sense, the obtained classification improves the former proposal of Mendoza and Jim´enez (2008) by better resolving spatial and temporal variability in wave storms in the area.
The classification obtained (Table 1 and Fig. 4) reflects the increase in wave storm properties as storm category in-creases. Moreover, because the selected classification param-eter was the energy content which implicitly containsHsand storm duration, this variable is used to define class limits, therefore class I storms present energy contents between 24 and 250 m2h with average values of 2.8 m of Hs max and 19 h of duration. Class II storms have energy values between 251 and 500 m2h and average values of 3.5 m ofHsmax and 52 h of duration. Class III presents limits ranging from 501 to 700 m2h and mean values of 4.4 m forHs max and 77 h of duration. Class IV storms can range from 701 to 1200 (m2h) with average values of 5.1 m ofHs max and 86 h of duration. The most intense storm class (V) presents energy values higher than 1200 m2h and these presentHsmax mean values higher than 6 m and 99 h of duration.
The dominant synoptic situation for wave storms along the Catalan coast was MC since they exert a large influence on the weather and climate, with local winds and rain distribu-tion being in many cases related to them (e.g. Radinovic, 1987). However, we did not find a direct correspondence on cyclone’s intensity over the western Mediterranean with wave energy content. This should indicate that other storm parameters have to be considered in the analysis. At present, an analysis of the position of the low pressure centre and the track of the storm with respect to the Catalan coast is tak-ing place. A possible consequence of this should be to use a more detailed classification for synoptic situations. Thus, the MC is a very broad class that, if used to “forecast” wave storm energy along the Catalan coast, probably has to be dis-criminated in a better way. A possible approach is to apply more detailed classifications such as the one developed by Campins et al. (2010), where different types of cyclones are identified.
Acknowledgements. This work has been developed in the frame-work of the VuCoMa research project funded by the Spanish ministry of Research and Innovation (CTM2008-05597/MAR). The first author would like to thank Conacyt. The authors wish to extend thanks to the Department of Public Works of the Generalitat de Catalunya and Puertos del Estado of the Spanish Ministry of Public Works for supplying wave data used in this study, and to the European Centre for Medium Weather Forecast (ECMWF) for synoptic maps from ERA analysis.
Edited by: J. Salat
Reviewed by: two anonymous referees
References
Bola˜nos, R., S´anchez-Arcilla, A., and Cateura, J.: Evaluation of two atmospheric models for wind–wave modelling in the NW Mediterranean, J. Mar. Sys., 65, 336–353, 2007.
Bunkers, M., Miller, J., and Degaetand, A.: Definition of climate regions in the Northern Plains using an objective cluster modifi-cation technique, J. Climate, 9, 130–146, 1996.
Campins, J., Genov´es, A., Jans`a, A., Guijarroa, J. A., and Ramis, C.: A catalogue and a classification of surface ciclones for the Western Mediterranean, Int. J. Climatol., 20, 969–984, 2000. Campins, J., Genov´es, A., Picornell, M. A., and Jans`a, A.:
Clima-tology of Mediterranean cyclones using the ERA-40 dataset, Int. J. Climatol., doi:10.1002/joc.2183, 2011.
Casas-Prat, M. and Sierra, J. P.: Trend analysis of wave stormi-ness: wave direction and its impact on harbour agitation, Nat. Hazards Earth Syst. Sci., 10, 2327–2340, doi:10.5194/nhess-10-2327-2010, 2010.
Cateura, J., S´anchez-Arcilla, A., Bola˜nos-S´anchez, R., and Sairouni, A.: Atmospheric conditions during severe wave storms in the North-Western Mediterranean. Generation, evolution, de-cay and implications, 37th CIESM Congress, Barcelona, Spain, 90 pp., 2004.
CIIRC: Estat de la Zona Costera a Catalunya, International Cen-tre for Coastal resources Research, Generalitat de Catalunya, Barcelona, 2009.
Dolan, R. and Davis, R.: An intensity scale for Atlantic coast north-east storms, J. Coast. Res., 8(4), 840–853, 1992.
Fita, L., Romero, R., Luque, A., Emanuel, K., and Ramis, C.: Analysis of the environments of seven Mediterranean tropical-like storms using an axisymmetric, nonhydrostatic, cloud re-solving model, Nat. Hazards Earth Syst. Sci., 7, 41–56, doi:10.5194/nhess-7-41-2007, 2007.
Garc´ıa, M. A., S´anchez-Arcilla, A., Sierra, J. P., Sospedra, J., and G´omez, J.: Wind waves of the Ebro delta, NW Mediterranean, J. Mar. Syst., 4(2/3), 235–262, 1993.
Genov´es, A., Campins, J., and Jans`a, A.: Intense storms in the Mediterranean: a first description from the ERA-40 perspective, Adv. Geosci., 7, 163–168, doi:10.5194/adgeo-7-163-2006, 2006. Guedes Soares, C.: Hindcast of Dynamic Processes of the Ocean and Coastal Areas of Europe, Coast. Eng., 55, 825–826, 2008. Guedes-Soares, C., Weisse, R., Carretero, J. C., and Alvarez, E.:
A 40 years hindcast of wind, sea level and waves in European waters, Proc. 21st Int. Conf. on Offshore Mechanics and Arctic Engineering, ASME, Paper OMAE2002-28604, 2002.
Jim´enez, J. A., S´anchez-Arcilla, A., Valdemoro, H. I., Gracia, V., and Nieto, F.: Processes Reshaping the Ebro Delta, Mar. Geol., 144, 59–79, 1997.
Jim´enez, J. A., Valdemoro, H. I., and S´anchez-Arcilla, A.: Bayed beaches behaviour under storms. Effects of storm direction, in-tensity, duration and water level on beach erosion, Proceedings of the Int. Conf. Coastal Sediments 2003. CD-ROM Published by World Scientific Publishing Corp. & East Meets West Pro-ductions, Corpus Christi, Texas, 2003.
Lionello, P., Bhend, J., Buzzi, A., Della-Marta, P. M., Krichak, S. O., Jans`a, A., Maheras, P., Sanna, A., Trigo, I. F., and Trigo, R.: Cyclones in the Mediterranean Region: Climatology and Effects on the Environment, in: Developments in Earth and Environ-mental Sciences, IV: Mediterranean Climate Variability, edited by: Lionello, P., Malanotte-Rizzoli, P., Boscolo, R., 325–372, 2006.
Mendoza, E. T.: Coastal vulnerability to storms in the Catalan coast, PhD thesis, Universitat Politecnica de Catalunya, 2008. Mendoza, E. T. and Jim´enez, J. A.: Storm-Induced Beach Erosion
Potential on the Catalonian Coast, J. Coast. Res., SI ,48, 81–88, 2006.
Mendoza, E. T. and Jimenez, J. A.: Clasificaci´on de tormentas costeras para el litoral Catal´an (Mediterr´aneo NO), Ing. Hidraul. Mex., XXIII, 2, 21–32, 2008.
Mendoza, E. T. and Jim´enez, J. A.: Regional geomorphic vulnera-bility analysis to storms for Catalan beaches, P. I. Civil Eng-Mar. En., 162(3), 127–135, 2009.
Morton, R. R. and Sallenger A. H.: Morphological Impacts of Ex-treme Storms on Sandy Beaches and Barriers, J. Coast. Res, 19(3), 560–573, 2003.
Ojeda, E. and Gulli´en, J.: Shoreline dynamics and beach rotation of artificial embayed beaches, Mar. Geol., 253, 51–62, 2008. PAP/RAC.ICZM: Protocol in the Mediterranean,
avail-able at: http://www.pap-thecoastcentre.org/razno/ PROTOCOLENGFINALFORMAT.pdf (last access: June 2011), 2007.
Ponce de Le´on, S. and Guedes Soares, C. Sensitivity of a Wave Model Predictions to Wind Fields in the Western Mediterranean Sea, Coas. Eng., 55, 920–929, 2008.
Weather And Climate, PSMP Report Series number 24, WMO, 1987.
Ratsimandresy, A. W., Sotillo, M. G., Carretero Albiach, J. C., ´
Alvarez Fanjul, E., and Hajji, H.: A 44-year high-resolution ocean and atmospheric hindcast for the Mediterranean Basin de-veloped within the HIPOCAS Project, Coast. Eng., 55, 827–842, 2008.
Saffir, H.: Design and construction requirements for hurricane resis-tant construction, Am. Soc. Civil Eng., ASCE Preprint No. 2830, American Society of Civil Engineers, New York, 20 pp., 1977.
Sard´a, R., Avila, C., and Mora, J.: A methodological approach to be used in integrated coastal zone management process: the case of the Catalan Coast (Catalonia, Spain), Estuar. Coast. Shelf Sci., 62, 427–439, 2005.
Simpson, R. A.: Proposed scale for ranking hurricanes by inten-sity, Minutes of the Eighth NOAA, NWS Hurricane Conference, Miami, 1971.
Stockdon, H. F., Holman, R. A., Howd, P. A., and Sallenger, A. H.: Empirical parameterization of setup, swash, and runup, Coast. Eng., 53(7), 573–588, 2006.