Soil liquefaction potential in Eskis¸ehir, NW Turkey
H. Tosun1, E. Seyrek2, A. Orhan3, H. Savas¸4, and M. T ¨urk¨oz4 1Eskis¸ehir Osmangazi University, Agricultural Faculty, Eskis¸ehir, Turkey 2Dumlupınar University, Civil Engineering Department, K¨utahya, Turkey
3Eskis¸ehir Osmangazi University, Geological Engineering Department, Eskis¸ehir, Turkey 4Eskis¸ehir Osmangazi University, Civil Engineering Department, Eskis¸ehir, Turkey
Received: 26 September 2010 – Revised: 30 December 2010 – Accepted: 9 February 2011 – Published: 7 April 2011
Abstract. Liquefaction is one of the critical problems in geotechnical engineering. High ground water levels and al-luvial soils have a high potential risk for damage due to liq-uefaction, especially in seismically active regions. Eskis¸ehir urban area, studied in this article, is situated within the sec-ond degree earthquake region on the seismic hazard zona-tion map of Turkey and is surrounded by Eskis¸ehir, North Anatolian, K¨utahya and Simav Fault Zones. Geotechnical investigations are carried out in two stages: field and labo-ratory. In the first stage, 232 boreholes in different locations were drilled and Standard Penetration Test (SPT) was per-formed. Test pits at 106 different locations were also exca-vated to support geotechnical data obtained from field tests. In the second stage, experimental studies were performed to determine the Atterberg limits and physical properties of soils. Liquefaction potential was investigated by a simpli-fied method based on SPT. A scenario earthquake of magni-tudeM=6.4, produced by Eskis¸ehir Fault Zone, was used in the calculations. Analyses were carried out for PGA lev-els at 0.19, 0.30 and 0.47 g. The results of the analyses indi-cate that presence of high ground water level and alluvial soil increase the liquefaction potential with the seismic features of the region. Following the analyses, liquefaction potential maps were produced for different depth intervals and can be used effectively for development plans and risk management practices in Eskis¸ehir.
1 Introduction
The liquefaction characteristic of a soil depends on several factors, such as ground acceleration, grain size distribution, soil density, thickness of the deposit and especially the posi-tion of the ground-water table. Liquefacposi-tion and ground
fail-Correspondence to: A. Orhan
(aorhan@ogu.edu.tr)
ures are commonly associated with large earthquakes. Over the past few decades many urban areas have experienced severe damage due to liquefaction-induced soil movements (Seed and Idriss, 1967; Bardet et al., 1995; Holzer, 1998; Ansal et al., 1999; Yuan et al., 2003). Damage to structure in liquefied sediments can occur as a result of the bearing capacity failure of a foundation, lateral spreading or slope failure and differential settlement.
There are two basic approaches available to predict the liquefaction potential of soil: (1) cyclic laboratory testing on soil samples and (2) use of in-situ tests and empirical methods. The most widely used empirical method based on in-situ tests is the SPT. The framework for SPT-based assessments of liquefaction potential was first proposed by Seed and Idriss (1971). This approach evolved over the time (Seed, 1979; Seed and Idriss, 1982; Seed et al., 1985; NCEER, 1997; Youd et al., 2001; Cetin et al., 2004; Idriss and Boulanger, 2006). In the literature, liquefaction assess-ments of different regions are available (e.g., Chu et al., 2004; Seyrek, 2003; Ansal and T¨on¨uk, 2007; Novikova et al., 2007; Mhaske and Choudhury, 2010).
Within the scope of this paper, liquefaction potential of foundation soils in the Eskis¸ehir settlement area has been investigated based on a simplified approach by Youd et al. (2001). The investigation comprises two stages: field work and laboratory testing. Geological and groundwater depth maps were produced and the Standard Penetration Test (SPT) was conducted. For the three peak ground accelera-tions (0.19, 0.37 and 0.47 g), with an earthquake magnitude ofM=6.4, the liquefaction potential maps in the study area have been estimated and results of the analyses are discussed. 2 Geology of the study area
Fig. 1. Location map of the study area.
4.401.053–4.406.600N (UTM Zone 36, ED50) covers an area about 60 km2. The Porsuk River flows through the city from west to east and is the main stream in the region.
The area under investigation is surrounded by highlands in the South and the North; it presents a flat topography with very low angle slopes ranging between 0–10% in its northern and central parts. However, the southern slopes are between 10–40%, indicating moderate slopes (Orhan, 2005). The el-evation of the region varies between 790 and 1010 m.
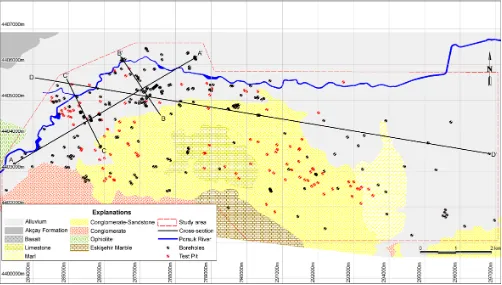
The geological formations are not complex in the province of Eskis¸ehir. Metamorphic, volcanic and sedimentary rocks from the Triassic to Quaternary ages are the main geological units in the region. The generalized geological map of the city and its surroundings is shown in Fig. 2. The oldest units in the North of the study area are grouped into tectonic units consisting of Triassic-aged Eskiehir Metamorphics, Karkın Formation and ophiolitic rocks. A Lower Eocene-aged Ma-muca Formation is overlying these units unconformably in the southern part. The Upper Miocene-aged Porsuk Forma-tion overlies the Mamuca FormaForma-tion with an angular discon-formity. A Pliocene-aged Ilıca Formation overlies the older
units conformably. The recent formations in the study area could be separated into two units: Pleistocene aged Akc¸ay Formations and Quaternary Alluvium (G¨ozler et al., 1996).
In the study area the main drainage system is dominated by the Porsuk River. The Porsuk River comes from a southwest direction, flows through the city from west to east and flow-ing eastwards, to where it leaves the city border. Sarısu Creek flows in an east west direction through K¨utahya and it joins the Porsuk River northwest of the city center. The Porsuk River is used for irrigation purposes in the Eskiehir Basin. Its average altitude in the study area is 790–800 m a.s.l. and from the river, water is conducted through canals to different regions in the city.
Fig. 2. Generalized geological map of Eskisehir and its vicinity (Orhan, 2005).
From the records of the boreholes, it is evident that the groundwater table is generally shallow. The groundwater level is closely associated with the amount of precipitation and may be quite high when monthly precipitation is high. In the highest precipitated season (i.e. April–May), the ground water level varies between 0.5–7.5 m, even at some locations its depth varies between 20–30 m. In the season with the lowest precipitation (i.e. July–August), the groundwater level changes between 2 and 13 m. The Pleistocene aged Akc¸ay Formation which lies in the northeastern part of the study area, has secondary importance as an aquifer and its ground-water level is deeper than that of the Quaternary Alluvium. The groundwater level variation in the basin is between 0.1 and 1.5 m; especially in the city center the variation is even smaller and is between 0.1 and 0.5 m. Figure 3 illustrates the static ground water table variation in the basin. As illustrated in Fig. 3, the ground water depth changes between 2 and 4 m. In the rock units in the South of the study area, no ground-water is observed. The direction of the groundground-water flow through the aquifer is mostly towards the north in Eskiehir city. High ground water levels and alluvial soils have a high potential risk for damage due to liquefaction, especially in seismically active settlement areas.
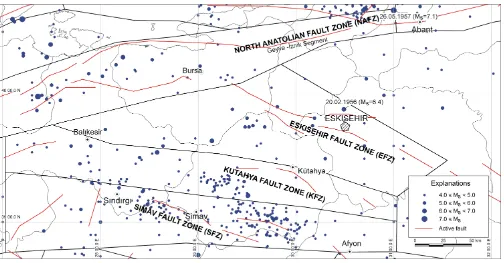
3 Seismotectonics of the study area
Eskis¸ehir is situated within the second degree earthquake re-gion on the seismic hazard zonation map of Turkey published by the Ministry of Reconstruction and Settlement (1996). The seismotectonics of the study area were reevaluated using earthquake records collected by the National Disaster Orga-nization, and the map of active faults of Turkey constructed by S¸aro˘glu et al. (1992).
As a result of the detailed seismological survey, four seis-mic sources were delineated. These are the North Anato-lian Fault Zone (NAFZ), the Eskis¸ehir Fault Zone (EFZ), the K¨utahya Fault Zone (KFZ) and the Simav Fault Zone (SFZ) (Fig. 4).
Fig. 3. Groundwater level contour and depth zonation map of the study area.
Fig. 4. Seismic sources and earthquakes that occurred during the last 100 years.
The WNW-ESE-orientated Eskis¸ehir Fault Zone which separates the Aegean-western Anatolian block from the cen-tral Anatolian block is a right lateral strike-slip fault zone with a normal component. The fault zone is
Fig. 5. A general overview of the field work.
1956 earthquake and field observations indicate that the EFZ is a trantensional fault zone and plays an important role in the development of Eskiehir and ˙In¨on¨u plains (Altunel and Barka, 1998).
The K¨utahya Fault Zone is situated in the Southwest of Eskis¸ehir. It is composed of three main segments. One of the most important earthquakes recorded around this fault was the 1970 C¸ avdarhisar earthquake with a magnitude of 5.9 and a focal depth of 18 km (Genc¸, 2004).
Simav is one of the graben systems of Western Anatolia, which is mainly controlled by the extensional neotectonic regime of the Aegean Region of Turkey. Simav fault trends nearly WNW-ESE for 100 km, along the Simav River from Sindirgi at the West to Muratdagi at the East. The fault is not a single fracture; instead it consists of several step faults parallel to the main fracture (Oyg¨ur, 1997).
4 Field investigations
Geotechnical investigations on alluvium were performed in two stages: field and laboratory. In the field stage, 232 boreholes in different locations with a total length of 2509.2 m were drilled to obtain disturbed and undisturbed soil samples and determine the ground water level. The depths of the boreholes ranged between 4.5 and 22.0 m. Most of the data is on average to a depth of 10 m b.g.l. Test pits at
106 different locations were also excavated to complement the geotechnical data obtained from the boreholes. The loca-tions of the boreholes, test pits and cross-secloca-tions are illus-trated in Fig. 5.
During the field investigations, 1328 SPT tests were performed according to ASTM D-1586 test specifications (American Society for Testing and Materials, 2000). SPT was performed at 1.5-m intervals in the boreholes by using a donut-type hammer with the rope.
Fig. 6. Distribution of SPT-N blow counts for different cross-sections.
5 Laboratory investigations
Following the field investigation, laboratory testing was per-formed to determine Atterberg limits and physical properties of disturbed and undisturbed soil samples. The major part of the study area consists of alluvium with fine grained soils in the upper levels and coarse grained soils in the lower lev-els. Figure 7 shows the grain-size distribution curves in con-nection to the upper and lower bound curves for liquefaction susceptibility by Iwasaki (1986). In this figure, the upper and lower bounds of the grain size distribution curves are used for efficient presentation. As seen in this figure, it is clear those soils are prone to liquefaction. The grain size distribution analyses shows that all samples are composed, on average, of 4.1% gravel, 30.9% sand and 65.0% fines (silt-clay). The statistical evaluation of the coarse and fine grained soils is given in Table 1.
The fine grained soils in the study are composed, on aver-age, of 1.5% gravel, 26.7% sand and 71.8% fines (silt-clay). The Atterberg limits of these samples in the study area are quite variable. The liquid limit values vary between 30.0 and
92.0% and the average is 54.9%. The plasticity index of the same samples also varies in a wide range (3–53), whereas the average value is obtained as 26.2%. The fine grained soils in the northern and northeastern part of the study area are es-pecially in low plastic character, their sand content is high. According to the Unified Soil Classification System (USCS), these soils can be classified as sandy-clayey silt and low plas-tic clay-silt (CL-ML). The fine grained soils in the southern and southwestern parts are high plasticity soils and can be classified as high plastic clay-silt (CH-MH).
Fine
Grained
Soils
Grain size distribution
<0.075 mm (%) 390 50.0 98.0 71.8 9.0
<4.75 mm (%) 390 78.0 100.0 98.5 3.3
Atterberg limits
Liquid limit (%) 386 30.0 92.0 54.9 12.2
Plastic limit (%) 385 18.0 51.0 28.7 4.6
Plasticity index (%) 385 3.0 53.0 26.2 10.3
Water content (%) 388 4.8 53.3 31.9 9.7
Natural density (Mg m−3) 304 1.49 2.20 1.81 0.11
Coarse
Grained
Soils
Grain size distribution
<0.075 mm (%) 85 6.0 49.0 33.9 11.7
<4.75 mm (%) 85 35.0 100.0 84.1 16.1
Atterberg limits
Liquid limit (%) 67 27.0 93.0 46.8 15.6
Plastic limit (%) 66 19.0 58.0 27.7 6.8
Plasticity index (%) 66 3.0 45.0 19.3 11.8
Water content (%) 75 3.1 48.8 23.0 10.7
Natural density (Mg m−3) 35 1.68 2.10 1.90 0.11
6 Determination of seismic hazard parameters
An important step in liquefaction potential assessment is the quantitative estimation of the level of ground shaking that is likely to be experienced in the area under investigation, i.e. the site-specific seismic hazard analysis (Beroya and Aydın, 2008). Deterministic Seismic Hazard Analysis (DSHA) and Probabilistic Seismic Hazard Analysis (PSHA) are widely used for describing earthquake ground motions in geotech-nical engineering.
The data on historical and instrumentally recorded earth-quakes for Turkey and its surrounding vicinity, collected from the Earthquake Research Center (ERD) of the General Directorate of Disaster Affairs of Turkey, are considered as a basis of seismic hazard calculations. Earthquakes of mag-nitudes greater than 4.0 are included in the analyses reported herein. Four seismic sources have been selected to assess the seismic hazard of Eskiehir. These are NAFZ, EFZ, KFZ, SFZ as illustrated in Fig. 4.
In this study, PSHA methodology based on Cornell (1968) has been applied to Eskis¸ehir city. For each source, the maximum earthquake magnitude was determined using the empirical relationships proposed by Wells and Copper-smith (1994). Once the maximum earthquake magnitude was determined, a linear regression was performed to estimate the coefficients of the Gutenberg-Richter (1944) relationship, us-ing the computer program DAMHA which was developed at the Earthquake Research Center, Eskis¸ehir Osmangazi Uni-versity as given in Table 2.
Peak ground accelerations (PGA) at rock sites were deter-mined using the attenuation relationships proposed by Camp-bell (1981), Boore et al. (1993, 1997), CampCamp-bell and Bozorg-nia (1994), G¨ulkan and Kalkan (2002). Linear-areal seis-mic source models are used for seisseis-mic hazard calculations. As a result of analyses, mean PGA value for the city center of Eskis¸ehir is about 0.19, 0.30 and 0.47 g for 144, 475 and 2475 years return period, respectively (Fig. 8). For liquefac-tion potential assessment, however, the specific magnitude of the design ground motion is required. As seen in Fig. 6, the hazard is mainly dominated by Eskis¸ehir fault zone for the province of Eskis¸ehir. Therefore, the scenario earthquake of
M=6.4 was chosen for liquefaction analyses. 7 Assessment of liquefaction potential
Prediction of liquefaction potential of soil is based on cyclic laboratory testing on soil samples and the use of in-situ test and empirical methods. However, the use of laboratory test-ing is complicated due to difficulties associated with sample disturbance during both sampling and reconsolidation. Thus, empirical approaches based on the in-situ penetration test re-sults have gained popularity in engineering practice as well as in engineering codes (Ansal and T¨on¨uk, 2007).
Table 2. Seismic hazard parameters used in this study.
Source zone Fault type∗ Largest observed a b Mmin Mmax∗∗ earthquake magnitude
(from 1907 to present)
North Anatolia Fault Zone (NAFZ) SS 7.1 4.28 0.63 4.0 7.6
Eskis¸ehir Fault Zone (EFZ) RLSS + N 6.4 4.22 0.63 4.0 6.4
Simav Fault Zone (SFZ) N 5.9 6.82 1.00 4.0 6.5
K¨utahya Fault Zone (KFZ) N 6.1 4.57 0.76 4.0 6.3
∗SS: Strike Slip fault, RLSS: Right Lateral Strike Slip fault, N: Normal fault,∗∗from Wells and Coppersmith (1994).
Fig. 7. Grain size distribution range of the soil samples.
is compared to the liquefaction resistance represented in terms of the cyclic resistance ratio (CRR). The CSR is calcu-lated by the Eq. (1) as follows:
CSR=τav
σ0
vo
=0.65(amax/g) σvo/σvo0
rd (1)
whereamaxis maximum ground surface acceleration in g,g is acceleration of gravity (9.81 m s−2), σvo andσvo0 are to-tal and effective vertical stress,rd is a stress reduction fac-tor. This factor is calculated from Eqs. (2) and (3). Liao and Whitman (1986) proposed these equations forz≤9.15 m and 9.15 m< z≤23 m, respectively.
rd=1−0.00765z (2)
rd=1.174−0.0267z (3)
The more comprehensive alternative is to calculate the av-erage shear stress with depth using site response analyses depending on the soil stratification and stiffness of the soil layers (Ansal and T¨on¨uk, 2007).
CRR expresses the capacity of the soil to resist liquefac-tion. This term is determined from the curves which show the correlation between corrected SPT blow-countN1(60)and the
Fig. 8. Mean seismic hazard curves for the study area.
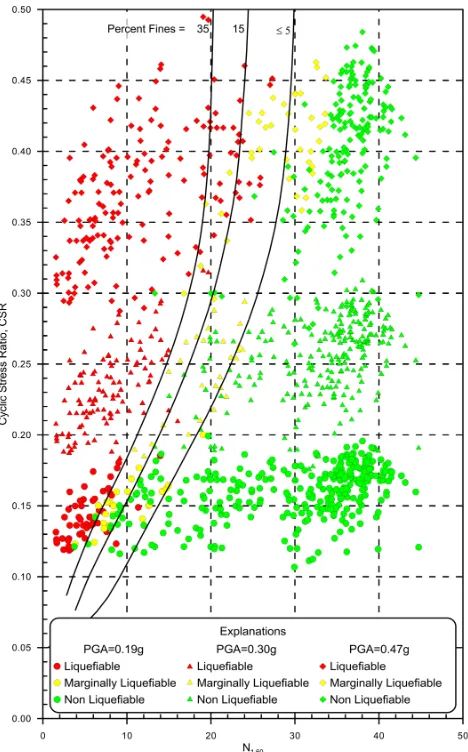
Cyclic Stress Ratio. These curves are developed for granu-lar soils with the fines contents of 5% or less, 15% and 35% (Youd et al., 2001).
The corrected blow countN1(60)is determined as follows:
N1(60)=NmCNCECBCRCS (4)
In Eq. (7),Nmis a uncorrected SPT blow-count;CN,CE,CB,
CR andCS are correction factors for effective overburden stress, hammer energy ratio, borehole diameter, rod length and samplers with or without liners, respectively. In this study, SPT is performed by using a donut-type hammer with the rope. For this equipment, rod-energy ratio of 45% is ac-cepted (Seed and De Alba, 1986).CNis calculated from the Eq. (5) developed by Liao and Whitman (1986).
CN=
s Pa
σ0
vo
FS=
CSR MSF (6)
CRR curves represent the liquefaction susceptibility for a magnitude of 7.5. Therefore, the factor of safety is multi-plied with a magnitude scaling factor (MSF). Various values of MSF have been proposed based on empirical data (Youd et al., 2001). For this study, the MSF suggested by Seed and Idriss (1982) is used for analyses.
It should be noted that liquefaction analyses are performed for three different peak ground acceleration levels as 0.19, 0.30 and 0.47 g with a scenario earthquake ofM=6.4. The liquefaction assessments are carried out with 402 SPT blow counts in the investigation area. the liquefaction potential of the silty and clayey soils was studied according to the pro-cedure of Seed et al. (2003). It should be noted that the lay-ers withN1(60)values greater than 30 or above ground water level have been classified as non-liquefiable.
In this study, three definitions of the factor of safety for liquefaction potential are proposed: liquefiable (FS≤1.0), marginally liquefiable (1<FS≤1.2) and non-liquefiable (FS>1.2).
The results of the analyses are presented with a two differ-ent point of view (Figs. 9 and 10).
In Fig. 9, data marked as liquefiable are composed of silt with low plasticity, silty sand and mixture of gravel and sand. It should be noted that samples falling to the left of the curve (FC = 35%) and classified as non-liquefiable soils are above the ground water level. 90.5% of the samples are non-liquefiable, 6.9% of the samples are liquefiable and 2.6% is marginally liquefiable (for 0.19 g). When peak ground ac-celeration is equal to 0.30 g, 28.4% of the samples are liq-uefiable and 6.7% of the samples are marginally liqliq-uefiable. Obviously stronger liquefaction effects (40%) are observed under an acceleration of 0.47 g.
The variation of the factor of safety with depth against liq-uefaction is given in Fig. 10. It is expressed in the previous sections that the major part of the study area consists of al-luvium with fine grained soils in the upper level (1–4 m) and coarse grained soils below this level. It is clear that most of the liquefiable and marginally liquefiable samples are in the range of 4–10 m depth below the ground surface. All the liq-uefiable zones correspond to layers of silt, silty sand and a mixture of gravel and sand. However, liquefaction is not ex-pected in sandy layers and layers of sand-gravel mixtures at a greater depths (>10.0 m) due to their higher relative den-sities. According to this figure, the liquefaction potential is very low for depths less than 4.0 m. This situation can be ex-plained by the ground water level position. As illustrated in Fig. 3, the ground water depth changes between 2 and 4 m.
Fig. 9. Cyclic stress ratio and SPTN1,60 plot based on Youd et al. (2001).
Fig. 10. Variation of safety factor versus liquefaction depth (a)
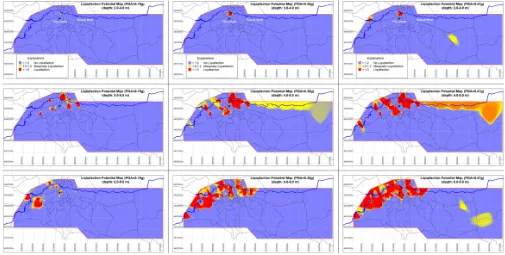
Fig. 11. Liquefaction potential map of the study area.
7.1 Liquefaction potential mapping
Liquefaction hazard maps are useful tools for identifying ar-eas with a high likelihood of liquefaction-induced ground de-formation. Information about areas with a high likelihood of ground deformation can be used for effective regional earth-quake hazard planning and mitigation (Heidari and Andrus, 2010).
In the last decade, with the advances in computer technolo-gies, geographic information systems (GIS) are frequently used to produce hazard maps. For the study area, liquefaction potential maps are created by means of GIS software. For this purpose, factors of safety calculated at different depth intervals (i.e. 2–4, 4–6 and 6–8 m below the surface) are spa-tially evaluated. For this process, it should be noted that the geological setting and ground water level are also considered. Different liquefaction potential maps are established by re-peating the same procedure for each acceleration level (i.e. 0.19, 0.30 and 0.47 g). These maps are illustrated in Fig. 11. Three factors of safety definitions, described in previous sec-tion, are used in the stage of the creation of liquefaction po-tential maps.
8 Discussion and results
As seen in Fig. 11, when peak ground acceleration is equal to 0.19 g, high liquefaction potentially areas are not observed in 2–4–m depth interval. However, in the city center, two different restricted areas have a high liquefaction potential
at a high acceleration level. The main reason for the low liquefaction potential for this level is that these soil deposits mainly consist of fine grained soils.
The liquefaction potential maps created for the second level (i.e. 4–6-m interval below the surface) differ from the previously created one. On the map prepared for a condi-tion in which peak ground acceleracondi-tion is 0.30 g, the lique-fiable regions spread and they cover a significant part of the city center. For an acceleration of 0.47 g, a higher liquefac-tion potential is observed in an extended region. Besides, at the eastern part of the liquefiable region, probable liquefi-able regions have appeared. The soil deposits in this level are mainly composed of loose sand-silt material; therefore they increase the liquefaction possibility.
The liquefaction potential map prepared for the 6–8-m in-terval shows similarity with the previously developed one. A relatively small area is illustrated as liquefiable soil for 0.19 g, while a larger area is liquefiable for 0.30 g. Much larger areas are illustrated as liquefiable for 0.47 g. It is clear that potential liquefiable regions are transformed into lique-fiable ones. Potential liquelique-fiable regions also appear in some regions outside the city center for this hazard level. In a re-gion at the northeastern part of the study area at high ac-celeration level, liquefiable and potential liquefiable regions appear.
for liquefaction assessments, especially when combined with cyclic triaxial test results.
Acknowledgements. This study was supported by ESOGU Re-search Foundation Grant No: 200315048.
Edited by: M. E. Contadakis
Reviewed by: two anonymous referees
References
Altunel, E. and Barka, A.: Neotectonic activity of Eskis¸ehir Fault Zone between In¨on¨u and Sultandere, Geological Bulletin of Turkey, 41(2), 41–52, 1998 (in Turkish).
Ambraseys, N. N.: Engineering seismology, Earthq. Eng. Struct. D., 17, 1–105, 1988.
American Society for Testing and Materials: Standard Method for Penetration test and split barrel sampling of soils, Annual Book of ASTM Standards, Soil and Rock (1), Standard No. D 1586– 99, 04.08, West Conshohocken, PA, 139–143, 2000.
Ansal, A. and T¨on¨uk, G.: Source and site effects for microzonation, Earthquake Geotechnical Engineering, 4th International Confer-ence on Earthquake Geotechnical Engineering-Invited Lectures, Book Series Title: Geotechnical Geological and Earthquake En-gineering, edited bY: Pitilakis, K., Geotechnical Geological and Earthquake Engineering, Chapter 4, 73–92, 2007.
Ansal, J., Bardet, P., Bray, J., Cetin, K. O., Durgunoglu, T., Erdik, M., Kaya, A., Ural, D., Yilmaz, T., and Youd, T. L.: Ini-tial Geotechnical Observations of the August 17, 1999 Izmit Earthquake, Earthquake Engineering Research Center, Septem-ber 1999.
Bardet, J. P., Oka, F., Sugito, M., and Yashima, A.: The Great Han-shin Earthquake disaster. Preliminary Investigation Rep., Dept. of Civil Engineering, Univ. of Southern California, Los Angeles, USA, 1995.
Beroya, M. A. A. and Aydin, A.: Seismic hazard analysis of Laoag City, Northern Philippines for liquefaction potential assessment, Eng. Geol., 96, 28–42, doi:10.1016/j.enggeo.2007.08.007, 2008. Boore, D. M., Joyner, W. B., and Fumal, T. E.: Estimation of re-sponse spectra and peak accelerations from western North Amer-ican earthquakes: An interim report, US Geol. Surv. Open-File Rep. 93-509, 72 pp., 1993.
Boore, D. M., Joyner, W. B., and Fumal, T. E.: Equations for esti-mating horizontal response spectra and peak acceleration from Western North American earthquakes: A summary of recent work, Seismol. Res. Lett., 68, 128–153, 1997.
Campbell, K. W.: Near-source attenuation of peak horizontal accel-eration, B. Seismol. Soc. Am., 71(6), 2039–2070, 1981. Campbell, K. W. and Bozorgnia, Y.: Near-source attenuation
of peak horizontal acceleration from worldwide accelerograms recorded from 1957 to 1993, Proc. Fifth U.S. National Confer-ence on Earthquake Engineering 3, Chicago, Illinois, July 10–14, 1994, 283–292, 1994.
139, doi:10.1016/S0013-7952(03)00129-7, 2004.
Cornell, C. A.: Engineering seismic risk analysis, B. Seismol. Soc. Am., 58, 1583–1606, 1968.
DS˙I (General Directorate of State Hydraulic Works): Eskis¸ehir OdunpazarıMunicipality Geophysical Resistivity Report, Gen-eral Directorate of State Hydraulic Works, 3rd District, Eskis¸ehir, unpublished, 6 pp., 2001a (in Turkish).
DS˙I (General Directorate of State Hydraulic Works): Eskis¸ehir Te-pebaıMunicipality Geophysical Resistivity Report, General Di-rectorate of State Hydraulic Works, 3rd District, Eskis¸ehir, un-published, 6 pp., 2001b (in Turkish).
Genc¸, G.: Probabilistic seismic hazard assessment for Eskis¸ehir, METU, Graduate School of Natural and Applied Sciences, Mas-ter thesis, 154 pp., 2004.
G¨ozler, Z., Cevher, F., Ergul, E., and Asutay, H. J.: The geology of middle Sakarya and its south, General Directorate of Mineral Research and Exploration Rep: 9973, 87 pp., 1996 (in Turkish). Gutenberg, B. and Richter, C. F.: Frequency of earhquakes in
Cali-fornia, B. Seismol. Soc. Am., 34, 185–188, 1944.
Gulkan, P. and Kalkan, E.: Attenuation modeling of re-cent earthquakes in Turkey, J. Seismol., 6(3), 397–409, doi:10.1023/A:1020087426440, 2002.
Heidari, T. and Andrus, R. D.: Mapping liquefaction potential of aged soil deposits in Mount Pleasant, South Carolina, Eng. Geol., 112, 1–12, doi:10.1016/j.enggeo.2010.02.001, 2010.
Holzer, T. L. (Ed.): The Loma Prieta, California, Earthquake of Oc-tober 17, 1989 – Liquefaction, USGS Professional Paper 1551-B, 314 pp., 1998.
Idriss, I. M. and Boulanger, R. W.: Semi-empirical proce-dures for evaluating liquefaction potential during earth-quakes, Soil Dyn. Earthq. Eng., 26(2–4), 115–130, doi:10.1016/j.soildyn.2004.11.023, 2006.
Iwasaki, T.: Soil liquefaction studies in Japan, State-of-Art, Soil Dyn. Earthq. Eng., 5(1), 2–68, doi:10.1016/0267-7261(86)90024-2, 1986.
Liao, S. and Whitman, R. V.: Overburden correction factors for SPT in sand, J. Geotech. Eng.-ASCE, 112(3), 373–377, doi:10.1061/(ASCE)0733-9410(1986)112:3(373), 1986. Mhaske, S. Y. and Choudhury, D.: GIS-based soil liquefaction
sus-ceptibility map of Mumbai city for earthquake events, J. Appl. Geophys., 70(3), 216–225, doi:10.1016/j.jappgeo.2010.01.001, 2010.
Ministry of Reconstruction and Settlement: Seismic Hazard Map of Turkey, 1996.
NCEER (National Center for Earthquake Engineering Research): Proceedings of the NCEER workshop on evaluation of liquefac-tion resistance of soils, Technical Rep. No. NCEER-97-0022, edited by: Youd, T. L. and Idriss, I. M., SUNY, Buffalo, NY, USA, 1997.
(Greece), Nat. Hazards, 40(3), 537–552, doi:10.1007/s11069-006-9018-9, 2007.
Orhan, A.: The geo-engineering properties of foundation soils in southern part of Eskis¸ehir city center and applying of geographic information system, Eskis¸ehir Osmangazi Univertsity, Graduate School of Natural and Applied Sciences, Ph.D. thesis, 125 pp., 2005 (in Turkish).
Oyg¨ur, V.: Metallogeny of the Simav Graben (Inner-Western Ana-tolia, Turkey), METU, Graduate School of Natural and Applied Sciences, Ph.D. thesis, 144 pp., 1997.
S¸aro˘glu, F., Emre, O., and Kus¸cu, ˙I.: Active Fault Map of Turkey, General Directorate of Mineral Research and Explo-ration, Ankara, 1992.
Seed, H. B.: Soil liquefaction and cyclic mobility evaluation for level ground during earthquakes, J. Geotech. Eng.-ASCE, 105(2), 201–255, 1979.
Seed, H. B. and De Alba, P.: Use of SPT and CPT Tests for Evalu-ating the Liquefaction Resistance of Sands, Use of In-situ tests in Geotechnical Engineering, ASCE-Geotech. Spec. Publ., 6, 281– 302, 1986.
Seed, H. B. and Idriss, I. M.: Analysis of soil liquefaction: Niigata earthquake, J. Soil Mech. and Foundation Div., Proc. ASCE, SM3, 83–108, 1967.
Seed, H. B. and Idriss, I. M.: Simplified procedure for evaluating soil liquefaction potential, J. Geotech. Eng.-ASCE, 97(9), 1249– 1273, 1971.
Seed, H. B. and Idriss, I. M.: Ground motion and soil liquefaction during earthquakes, Earthquake Engineering Research Institute Monograph Series, Oakland, CA, USA, 134 pp., 1982.
Seed, H. B., Tokimatsu, K., Harder, L. F., and Chung, R. M.: The influence of SPT procedures in soil liquefaction resis-tance evaluations, J. Geotech. Eng.-ASCE, 111(12), 1425–1445, doi:10.1061/(ASCE)0733-9410(1985)111:12(1425), 1985.
Seed, R. B., Cetin, K. O., Moss, R. E. S., Kammerer, A., Wu, J., Pestana, J. M., Riemer, M. F., Sancio, R. B., Bray, J. D., Kayen, R. E., and Faris, A.: Recent advances in soil liquefaction engi-neering: a unified and consistent framework, Keyynote Address, 26th Annual ASCE Los Angeles Geotechnical Spring Seminar, Keynote Presentation, H.M.S. Queen Mary, Long Beach, Cali-fornia, 30 April 2003.
Seyrek, E.: Liquefaction problem in foundation soil of earthfill dam and a case study, Msc thesis, Graduate School of Natural and Ap-plied Sciences, Eskisehir Osmangazi University, Eskisehir, 2003. Wells, D. L. and Coppersmith, K. J.: New empirical relationships among magnitude, rupture length, rupture width, rupture area, and surface displacement, B. Seismol. Soc. Am., 84(4), 974– 1002, 1994.
Youd, T. L., Idriss, I. M., Andrus, R. D., Arango, I., Castro, G., Chrstian, J. T., Dobry, R., Finn, W. D. L., Harder Jr., L. F., Hynes, M. E., Ishihara, K., Koester, J. P., Liao, S. S., Marcuson, W. F., Martin, G. R., Mitchell, J. K., Moriwaki, Y., Power, M. S., Robertson, P. K., Seed, R. B., and Stokoe, K. H.: Liquefaction resistance of soils, Summary report from the 1996 NCEER and 1998, NCEER/NSF workshop on evaluation of liquefaction re-sistance of soils, J. Geotech. Geoenviron. Eng.-ASCE 127(10), 817–833, 2001.