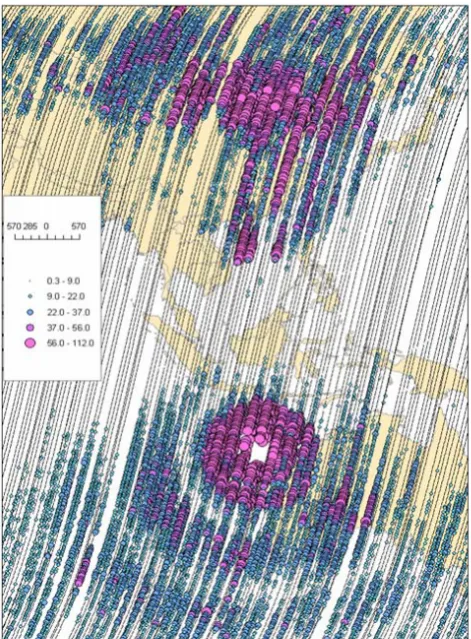
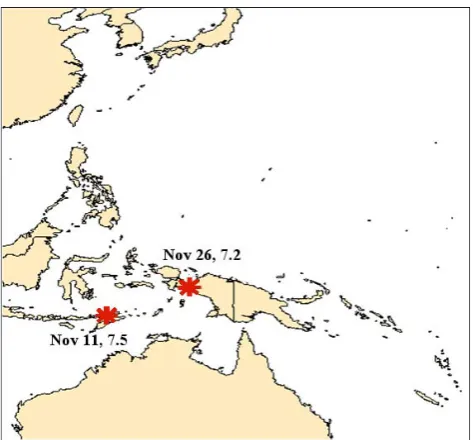
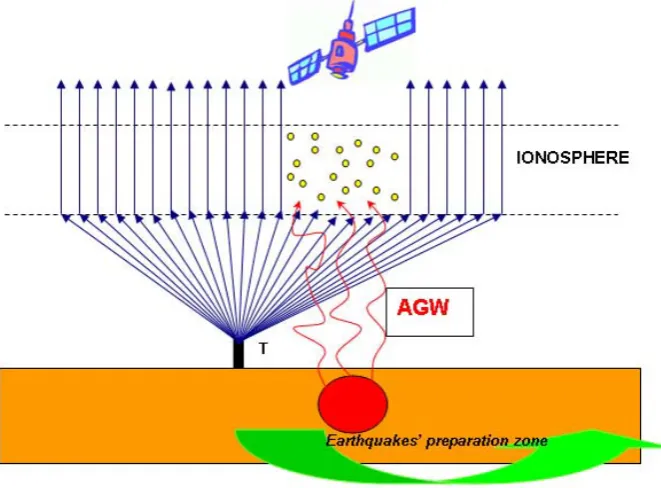
Global diagnostics of the ionospheric perturbations related to the seismic activity using the VLF radio signals collected on the DEMETER satellite
Full text
Figure


Related documents
Background: Councils of Chiropractic Education (CCE) indirectly influence patient care and safety through their role of ensuring the standards of training delivered by
It was decided that with the presence of such significant red flag signs that she should undergo advanced imaging, in this case an MRI, that revealed an underlying malignancy, which
The use of sodium polyacrylate in concrete as a super absorbent polymer has promising potential to increase numerous concrete properties, including concrete
The paper assessed the challenges facing the successful operations of Public Procurement Act 2007 and the result showed that the size and complexity of public procurement,
Wraz ze wzrostem sub−MICs, bez względu na rodzaj leku, zmniejszała się liczba bakterii wiązanych na ko− mórkach nabłonkowych.. Przyczyną tego zjawiska były zmiany w
Field experiments were conducted at Ebonyi State University Research Farm during 2009 and 2010 farming seasons to evaluate the effect of intercropping maize with
UBM and Artemis-2 VHFUS was significantly different; this demonstrates that these instruments cannot be used Figure 1 Bland – Altman plot of agreement showing the mean differences


