© 2018 IJSRST | Volume 4 | Issue 2 | Print ISSN: 2395-6011 | Online ISSN: 2395-602X Themed Section: Science and Technology
Detection and Estimation of Adulteration in Oil Sample Using
Digital Image Processing
Neha S. Dhande1, Rupesh D. Sushir2
1M. E. Scholar, Department of Electronics & Telecommunication Engineering, P. R. Pote College of Engineering and Management, Amravati, Maharashtra, India
2Assistant Professor, Department of Electronics & Telecommunication Engineering, P. R. Pote College of Engineering and Management, Amravati, Maharashtra, India
ABSTRACT
Now-a-days adulteration can cause several health and safety problem. Many techniques such as chromatographic and spectroscopic method have recently been employed to check the purity of oil. For most vegetable oil adulteration detection research methods, it remains difficult to popularize due to the fact that the application of experimental facility needs professional to operate; and it is usually expensive. Hence to solve this problem method is proposed. This project describes the development of an image processing algorithm, which can estimate the amount of adulteration oil sample from a captured photo. The algorithm is implemented into an application for modern smart phone where the user can measure the quality of a sample of oil only by taking photo of the sample. Then any other mixture of oil can be identified using the derived model and the methodology, which is based on color model based segmentation.
Keywords : Oil sample, adulteration, image processing, color model segmentation.
I.
INTRODUCTION
Health hazard to consumer can be caused due to the adulteration of food product by substituting premium quality ingredient with lower grade or inexpensive substitutes. In 1980s oil adulteration get much more attention because 400 people in Spain causing the death and after using up of adulterated oils 20,000 victims. Daily consumption of adulterated olive oil can cause cancer, cardiovascular diseases and certain type of chronic diseases. Recently, a heath claim for the relationship of its polar phenol content and resistance to human lipid oxidation reinstates this natural fruit juice to the forefront of consumer preference for healthy, fats. Olive oil is the most valuable and heath promoting oil and it is also most
expensive compare to other oils. Some other oil is mixed with olive oil hence quality of oil reduces. This process is called as adulteration. We need easy way for finding the adulteration or quality of the olive oil. To make fast, reliable and cost effective approach is a real challenge. For recognition of oil adulteration there are many methods available such as the colorimetric reaction based method as well as viscosity density refractive index measurement computer vision method. There are various techniques also available for finding of adulteration such as liquid chromatography gas chromatography and also infrared spectrometry.
characteristics and processing. These systems are normally used in production line where human activity is repetitive, product are manufactured very rapidly, and fast, accurate measurement are necessary for decision making during the process. Different from the problems present in visual inspection performing by people, this kind of system offer accuracy and repeatability in the measurement without contact, especially due to the elimination of aspect such as subjectivity, tiredness, slowness and cost associated with human inspection. The use of automat zed inspection in agriculture and oil industry has increasingly become an interesting solution for the final analysis of product quality. For answering problem related to diet and nutrition smart phone technique and image recognition analysis are already present in market. Recently, however, it was shown that variable extracted with the aid of chemometrics (SPA-LDA, PLS-DA) from the digital images captured with an HD resolution webcam of virgin olive oil sample, with or without the addition of soybean oil, could successfully used for discrimination [11]. Obviously the idea relied on the fact that virgin olive oil is a green oil whereas soybean a yellow one, although there is a natural variability in the tonality of both oils. Considering these results as promising, worked further on the detection and quantification of economical motivated adulteration of virgin olive oil with soybean oil, using a common smart phone and a less sophisticated set-up and various kind of recognition analyses aiming in the future to develop a suitable application that can be used by all the above-mention parties.
In this project we can develop algorithm that can calculate or recognize the amount of adulteration of olive oil and soybean oil by taking photos of sample using smart phone. The key idea is to evaluate the color difference of two regions in the captured image. In the basic setup of this method, we can take a sample in petri dish and capture photo using smart phone. Then covert that image from JPEG format to
sRGB. After that images are transferred into a pc for preparation and processing.
II.
LITERATURE REVIEW
In day to day life adulteration plays very important role, it is necessary to avoid adulteration. To avoid adulteration research is going on throughout the world. Even if researchers came out with some conclusion there are some disadvantages. Some of the solution and drawback are discussed here. Information about few research papers or previously implemented projects that we have used as a reference for making our project is mentioned below:
Anna Dankowska presented a technique for quantifying seed oil adulteration in extra virgin olive oil by multiple linear regression analysis of fatty acid profile. They have been presented a lesson for evaluation of effectiveness of chromatographic fatty acid profile recognition for finding adulteration of olive oil with soybean, sunflower and rapeseed oil. For finding content of foreign oil in olive oil multiple linear regression models are developed. The use of fatty acid profile was built in first model and the basic of calculated addition of fatty acid group and the relation between them is shown in second model. Calculation ability of model was complete using the root mean square errors of calculation (RMSEC) and root mean square of cross validation (RMSECV). In that multiple linear regression models gives efficient prediction ability for model B with RMSEC and RMSECV value at 1.6 and 1.8.
image are image acquisition, processing and segmentation. For recognition of faulty fruits such as apple, olives, and cherries as well as for checking ripening stages of banana tomato CVC system is used. The use of computer is enhance competence with less manpower, reduces dependence on skilled specialist which is costly and time consuming. Computer vision technology provides a high level of flexibility and repeatability at comparative low price.
Consuelo Lopez-Diez , Giorgio Bianchi and Royston Goodacre presented a technique Raman spectroscopy and chemometrics for Rapid quantitative assessment of the adulteration of virgin olive oil with hazelnut oil in. In this technique Raman spectroscopy along with multivariate and evolutionary computation based methods has been used to recognize adulterated oil sample. Partial least squares and genetic programming are useful for differentiating between adulterated olive oil with hazelnut. Raman spectroscopy with appropriate chemometric analyses to differentiate between closely related cultivars of olive oil and hazelnut.
Abdelkhalek Oussama, Fatitha Elabadi Stefan Platikanov, Fouzia Kzaiber and Roma Tauler presented a FT-IR spectroscopy and PLS with variable importance of projection scores technique for detection of olive oil adulteration. This study was focused on recognition and quantification of extra virgin olive oil adulteration with soybean or sunflower oil using FT-IR spectroscopy along with PLS modeling and VIP scores. In PLS model we can make use of orthogonal signal correction and mean centering data pretreatment. VIP scores variable reselection was capable to find out concentration sunflower oil adulterants in ratio 1-24 % weight ratio with relative prediction errors lower than 3%. If we use FT-IR technique then large amount of effort and price will be save. To perform the quantitative analysis of binary oil mixture based on the use and analysis of the variable importance in projection or
VIP scores from the regression model, PLS method is superior method.
Peng He, Xiaoqing Wan, Chenglin Wang and Yingpu Jiao proposed a technique of standard chemical method coupling with image texture analysis technology for determination of animal oil added in vegetable oil. This project shows that for most vegetable oil detection research method, it remain difficult to popularize due to the fact that the application of experimental facilities need professional to operate; moreover, the used experimental facilities are expensive hence to overcome this problem standard chemical method coupled with image texture analysis technology was developed. Analysis of correlation and establish the mathematical model between texture characteristics parameters and cholesterol content by least square method.
N. Karagiorgos, N. Nenadis, D. Trypidis, K. Siozios, S. Siskos and S. Nikolaidis, M.Z. Tsimidou “
An
approach for estimating adulteration of virgin olive oil with soybean oil using image analysis” 2017 6th International Conference on Modern Circuits and Systems Technologies (MOCAST).
This paper describes the development of an image processing algorithm, which can estimate the amount of adulteration of olive oil with soybean oil from a captured photo. This algorithm is intended to be implemented into an application for modern smart phones, where the user can measure the quality
of a
sample of olive oil, only by taking photos from the sample. The determination of the adulteration percentage is done by separating the captured image into two regions: one that contains
only the oil
In this paper an evaluation of using image processing in detection the percentage adulteration between two oil typeswas studied. A number of photos of different mixed oil samples, taken by a mobile phone, have used as the base for the development of a model. The model makes use the CIELab space colour and produces predictions for adulteration. An average absolute error of 3% with a maximum of 5% in the model predictions has observed. Moreover, the algorithm does not use sophisticated formulas, or time computationally intensive routines, so the translation fromMatlab code to a smartphone application can be done easily. The above results define the promising potentials of the proposed approach in determining adulteration in oils.
Hazem Jabeur1 & Akram Zribi1 & Mohamed Bouaziz “Extra-Virgin Olive Oil and Cheap
Vegetable
Oils: Distinction and Detection of Adulteration as Determined by GC and Chemometrics” July 2015Springer Science
Business Media New York 2015. Refined oils including corn, sunflower, soybean, and palm oils as well as low-quality olive oil such as refinedlamp ante
and pomace olive oils are commonly used forextra virgin
olive oil (EVOO) adulteration. Indeed, K270 could be used as a parameter for the detection of EVOO fraud for each type of the studied refined oils, 10 % olive, 4 % pomace olive, 10 % palm, 5 % corn, and 2 % soybean oils. Moreover, theadulteration could also be detected by the increase of the transfattyacid contents with
10 % pomace
olive, 3 % soybean, 3 %sunflower, 2 % corn, and 10 %palm oils. Actually, stigmasta
3,5-diene content is one of the most effective means of detecting refinedoils in EVOO at low levels: 2 %
olive, 0.4 % pomace olive, 1 % palm, 0.2 % soybean, 0.5 % sunflower, and 0.1 % corn oils. Finally, the application of linear discriminant analysis could represent an alternative and innovative tool for faster and cheaper evaluation of EVOO adulteration.
The present study aims to explain and compare analytical methods (conjugated dienes, conjugated trienes, TFAs, and stigmasta-3,5-diene) used to detect and quantify the possible adulterations of EVOO by refined vegetable oils. In fact, K270 and ΔK are complementary parameters that indicate the presence of some of the adulteration types up to relatively high threshold. A GC analysis for TFA composition permits the detection of a wider range of adulteration with a lower range of thresholds (from 2 to 10 % except for refined olive oil). However, the stigmasta-3.5- diene determination remains the best way to detect and quantify all types of adulterations with a threshold as low as 0.1 % in the case of RCoO. Although this technique is the most effective, it is the longest and most expensive compared to those mentioned above. To the best of our knowledge, these techniques are the most used in fraud detections. Therefore, this study has the advantage that many industrials operating in the field of olive oil could use them in order to avoid adulteration and protect thequality and purity of EVOO.
Karla Danielle Tavares de Melo Milanez and Marcio Jos ´ e Coelho Pontes “Classification of extra virgin olive oil and verification of adulteration using digital images anddiscriminate analysis” September 2015 The Royal Society of Chemistry 2015
.
to brand, a correct classification rate of 100% was achieved for both models (LDA and PLS-DA) when applied to the prediction set. The study involving the detection of adulteration with soybean oil in EVOO samples was carried out separately for each brand. For the A EVOO samples, a CCR of 88% and 94% was obtained by SPA-LDA and PLS-DA models for the prediction set
, respectively. For the B and C
EVOO samples, however, all prediction samples were correctly classified by both models. These results demonstrate the ability of the proposed method and present a promising alternative for the classificationof extra virgin olive oil (EVOO) samples with respect to brand and verification of adulteration simply and quickly. Additionally, the method does not use reagents to carry out the analysis and laborious procedures for chemical characterization of the samples are not required.Xiao-Bo Jina,∗, Qiang Lub, Feng Wanga, Quan-gong Huo “Qualitative detection of oil adulteration with machine learning approaches” Journal of Food Engineering May 15, 2013
The study focused on the machine learning analysis approaches to identify the adulteration of 9 kinds of edible oil qualitatively and answered the following three questions: Is the oil sample adulterant? How does it constitute? What is the main ingredient of the adulteration oil? After extracting the high performance liquid chromatography (HPLC) data on triglyceride from 370 oil samples, we applied the adaptive boosting with multi-class Hamming loss (AdaBoost.MH) to distinguish the oil adulteration in contrast with the support vector machine (SVM). Further, we regarded the adulterant oil and the pure oil samples as ones with multiple labels and with only one label, respectively. Then multi-label AdaBoost.MH and multi-label learning vector quantization (ML-LVQ) model were built to determine the ingredients and their relative ratio in the adulteration oil. The experimental results on six
measures show that ML-LVQ achieves better performance than multi-labelAdaBoost.MH.
HPLC data of the edible oil with their mixture was investigated to answer the following questions: Is the oil sample adulterant? How does it constitute? What is the main ingredient of the adulteration oil? In our study, we applied the handy AdaBoost.MH to detect the oil sample is adulterant
or not to achieve a
higher
accuracy than the state of art SVM. In addition, AdaBoost.MH with PCA does not show the better performance than one without any preprocessing since PCA can not guarantee the class separation on the features. Finally, we used multi-label AdaBoost.MH and ML-LVQ to recognize the ingredient and their relative ratio when taking the adulterant oil and the pure oil as the examples with multiple labels and one labels, respectively. The comparisons between multi-label AdaBoost.MH and MLLVQ on multiple measures show that ML-LVQ is more promising than AdaBoost.MH in solving above three questions. We also note that our method can only detect the oil adulteration qualitatively unlike the least squares support vector machine (LS-SVM) Wu et al. (2008) which can measure the ingredients quantitatively. Finally, these data analysis approaches are also suitable for following other chromatographic and spectroscopic methods such as NIR or MR instead of HPLC.Jéssica Kehrig Fernandes1, Tiemi Umebara1, Marcelo Kaminski Lenzi2* and Ediely Teixeira da Silva Alves “Image analysis for composition monitoring. Commercial blends of olive and soybean oil” Acta Scientiarum. Technology Maringá, v. 35, n. 2, p. 317-324, Apr.-June, 2013.
Olive oil represents an important component of a healthy and balanced dietary. Due to
commercial
1%,
but may present long delays, too many purification steps or use expensive equipment. Image analysis represents an important characterization technique for food science and technology. By coupling image and UV-VIS spectroscopy analysis, models with linear dependence on parameters were developed and couldsuccessfully describe the mixture concentration in the range of 0-100% in mass of olive oil content. A validation sample, containing 25% in mass of olive oil, not used for parameter estimation, was also used for testing the proposed procedure, leading to a prediction of 24.8 ± 0.6. Due to image analysis results, 3-parameter-based models considering only R and G components were developed for olive oil contentprediction in mixtures with up to 70% in mass of olive oil, the same test sample was used and itsconcentration was predicted as 24.5 ± 1.2. These results show that image analysis represents a promising technique for on-line/in-line monitoring of blending process of olive soybean oil for
commercial
mixtures. A simple and low cost technique was proposed for olive and soybean oil mixture composition prediction. By coupling image and UV-VISspectroscopy analysis, models with linear dependence on parameters were developed and could successfully describe the mixture concentration in the range of 0-100% in mass of olive oil content. More specifically, models with 2,3, 4,
5, 6 and 7 parameters were used. A validation sample, containing 25% in mass of olive oil was alsoused for testing the proposed procedure. All models could predict the olive oil content in the sample, however, according to the results, the model with 3parameters provided the best performance and prediction error. Due to image analysis results, 3- parameters-based models considering only R and Gcomponents were developed for olive oil contentprediction in mixtures with up to 70% in mass ofolive oil. The test sample was also used forvalidation
purposes, leading to good predictions. These results show that image analysis represents a promising technique for on-line/in-line monitoringofblending process of olive soybean oil for commercial mixtures.
III.
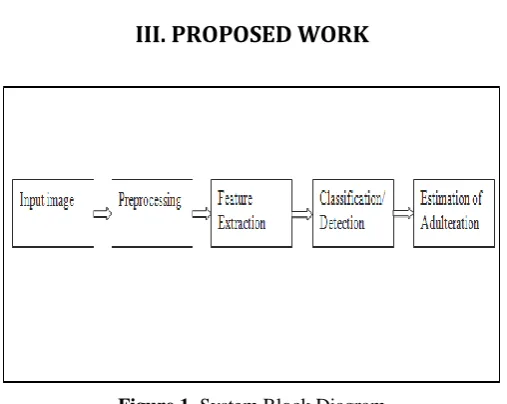
PROPOSED WORK
Figure 1. System Block Diagram
1] Input Image - We can take input images from experimental setup once. After that we used capture image for demonstration.
2] Pre-processing- Here CIE-LAB are adopted for pre-processing. This space was introduced by CIE (Commission International de I’ Eclairage) for colourimetric purpose and it is definitely more convenient to use than any other color space that linearly relates to RGB. We use here CIE-LAB because the color description is device independent. It also allow user to evaluate how much difference present in two colors. The transform from RGB or sRGB to CIE-LAB, takes into consideration the illuminating condition of the image, or the so called illuminant. So it offers some desensitization, from the light source of setup.
3] Feature Extraction- According to diverse information stored in pixels, image feature obtained can be categorized into four type- color, size, shape and texture. i) Color- color is the intensity of pixels.
iii) Texture- Texture is normally the dependency between pixels and their neighboring pixels or the variation of intensity of pixels.
iv) Image histogram analysis- An image histogram is a chart that shows the distribution of intensities in an indexed or gray scale image. It also shows the no of pixels in an image at each different intensity value found in that image.
4] Classification/ Detection- In machine learning, support vector machine (SVMs, also) support vector networks are supervised learning models with associated learning algorithms that analyse data used for classification and regression analysis. In this algorithm, we plot each data item as a point in n-dimensional space (where n is number of feature you have) with the value of each feature being the value of particular coordinate. Then we perform classification by finding the hyper-plane that differentiates the two classes very well. Support vector is simply the co-ordinates of individual observation. In addition to performing linear classification, SVMs can efficiently perform a non-linear classification using what is called the kernel trick, implicitly mapping their inputs into high dimensional feature spaces.
5] Estimation of Adulteration – Using color based segmentation we can do evaluation of adulteration. This method overcomes the problems encountered while segmenting an object in a complex scene background by using color of the image. After pre-processing, the image is transformed from the RGB color to L*a*b* space. Then, the three channels of L*a*b* color space are separated and a single channel is selected depending upon the color under consideration. Image segmentation is process of assigning a label to every pixels in an image such that pixel with a same label share certain visual characteristics.
IV.CONCLUSION
In this project an evaluation using image processing for recognize the percentage adulteration between oil samples was studied. Any other oil mixture can be identified by using this technique. This method reduces the dependence on trained expert which is costly and time consuming, hence it is unique. The above method was introducing a powerful tool for monitoring the
purity of oil and performing qualitative and quantitative determination of adulterant.
V.
REFERENCES
[1] Anna Dankowska, Quantifying seed oil adulteration
in extra virgin olive oil by multiple linear regression analysis of fatty acid profile ,143-149.
[2] Aasima Rafiq, Hital A Makroo, Poonam Sachdeva
and Savita Sharma, Application of computer vision system in food processing,1197-1205
[3] Consuelo Lopez-Diez, Giorgio Bianchi Rapid
quantitative assessment of the adulteration of virgin olive oil with hazelnut oil using Raman spectroscopy and chemometrics Consuelo Lopez-Diez,6145-615.
[4] Abdelkhalek Oussama, Fatitha Elabadi, Stefan
Platikanov Detection of olive oil adulteration using FT-IR spectroscopy and PLS with variable importance of projection scores, 1807-1812.
[5] Peng He, Xiaoqing Wan, Chenglin Wang and Yingpu
Jiao Determination of animal oil added in vegetable oil by standard chemical method coupled with image texture analysis technology,67-80
[6] Van Dalen, G., Determination of the size distribution
and percentage of broken kernels of rice using flatbed scanning and image analysis, Food Res. Int. 37 51–58.
[7] Angerosa, F., Campestre, C., Giansante, L. Analysis and authentication. In Olive oil: Chemistry and technology (D.Boskou.ed.) AOCS Press, pp. 113-172
[8] S. Westland, C. Ripamonti, and V. Cheung,
Computational Colour Science Using MATLAB. John Wiley & Sons.
[9] Maggio, R.M., L. Cerretani, E. Chiavaro, T. S.
Kaufman and A. Bendin, „Anovel chemometric strategy for the estimation of extra virgin olive oil adulteration with edible oils‟, pp. 890–895.
[10] Blanch, G. P.; Caja, M. D.; del Castillo, M. L. R.; Herraiz, M.Comparison of different methods for the evaluation of the authenticity of olive oil and hazelnut oil. J. Agric. Food Chem., 3153-3157.
[11] de Melo Milanez, D.K.T. and Coelho Pontes, M.J.
Classification of extra virgin olive oil and verification of adulteration using digital images and discriminates analysis, Anal. Methods 8839-8846.
[12] R. Lukac and K. N. Plataniotis, Color Image
Processing: Methods and Applications. CRC Press.
[13] R. W. G. Hunt and M. R. Pointer, Measuring Color.
John Wiley & Sons.
[14] S. Westland, C. Ripamonti, and V. Cheung,