IJSRR, 8(1) Jan. – Mar., 2019 Page 1383
Research article Available online www.ijsrr.org
ISSN: 2279–0543
International Journal of Scientific Research and Reviews
Evaluation of Technical Efficiency in respect of production of Oilseeds
in India – DEA approach
G.R.Kanmani
*1and V. Prakash
2Department of Statistics, Presidency College, Chepauk, Chennai -05, Tamil Nadu, India. Email:Kkanmani96@Yahoo.Com
Head-Department of Statistics, Presidency College, Chepauk, Chennai -05,Tamil Nadu, India. Email:Venu.Prakas@Gmail.Com
ABSTRACT
This study estimates the Technical efficiency of total production of Oil seeds among few states in India during the year 2015-2016. To evaluate the Technical efficiency CRS and VRS models are attempted. The analysis of the study reflects that two states are efficient under CRS, and six states are efficient under VRS model. DEA provides input and an output target for the inefficient DMU’S to improve its efficiency.
KEYWORDS
-Data Envelopment Analysis(DEA),Technical efficiency(TE),Constant returns toscale(CRS),Variable returns to scale(VRS).
*Corresponding author
G.R.Kanmani
Department of Statistics, Presidency College,
IJSRR, 8(1) Jan. – Mar., 2019 Page 1384
I INTRODUCTION
Oilseeds are raised mostly under rainfed conditions and important for the livelihood of small and marginal farmers in arid and semiarid areas of the country. The production of the oilseeds in 2015-2016 is 25.30 million tonnes. The yield of oilseeds in 2015-16 is 968 kg per hectare (as per 4th advance estimates). During 2014-15 and 2015-16 major oilseeds producing states experienced late monsoon at the time of sowing,insufficient rain during crop growing phase, untimely rain, yellow mosaic virus in soybean.There are totally Nine oil seeds which includes Groundnut, Castorseed, Sesamum, Nigerseed, Rapeseed and mustard, Linseed, Safflower, Sunflower, Soyabean.
The author of this study is interested in evaluating the efficiency among the states in India which all produces the oilseeds. So the author has considered 21 states with one input and two outputs. Each state is considered as a decision making unit and the study is based on secondary data collected from Annual report of agricultural data from the Department of agriculture, co operation and farmers Welfare, Government of India, Krishi Bhawan, New Delhi. Data envelopment analysis is used to calculate Technical efficiency among the states in India.
The structure of the paper is organized as follows; the Review of relevant literature is described in IV. The methodology, used for analysis is discussed in detail in section V. Empirical investigation based on total production of oil seeds among 21 states data structure, is carried out in section VI. Finally the paper ends with discussion and conclusion on empirical investigation.
II DATA ENVELOPMENT ANALYSIS
Data Envelopment Analysis is a Linear programming based technique for measuring the relative performance of organizational units with multiple inputs and outputs which makes comparisons difficult. This paper shows how relative efficiencies can be determined and targets for inefficient units set.
The present study measures the technical efficiency and scale efficiency. However the Technical efficiency is major criteria for measuring efficiency in agriculture because technically efficient farmer is one who produces maximum output for a given amount of input, conditionally on the production technology available.
There is an increasing concern with measuring and comparing the efficiency of organizational units such as local authority departments, schools, hospitals, shops, bank branches and similar instances where there is a relatively homogeneous set of units.
IJSRR, 8(1) Jan. – Mar., 2019 Page 1385
III DECISION MAKING UNITS
The Decision Making Units (DMU) is a collection or team of individuals who participate in a buyer decision process. Generally, DMU relates to business or organizational buying decisions.In engineering, DMUs may take such forms as airplanes or their componentssuch as jet engines. For the purpose of securing relative comparisons, a group ofDMUs is used to evaluate each other with each DMU having a certain degree ofmanagerial freedom in decision making.
IV REVIEW OF LITERATURE
Charnes et al (1978)1 proposed DEA to assess the relative efficiency of a set of homogenous decision making units (DMUs) with multiple inputs and multiple outputs. DEA has been dramatically developed in the last three decades and is known as a popular non-parametric technique which only requires a simple set of inputs and outputs values. According to (coelli, Rao & Battese, 1998)2, the constant returns to scale (CRS) DEA model is only appropriate when the Area is operating at an optimal scale. Some factors such as financial constraints, etc., may not allow an Area to operate optimally. To capture this possibility (Banker, Charnes & Cooper 1984)3 introduced the (VRS) Variable returns to scale DEA model. This version is scale DEA model. This version is popularly known as BCC model. A description on DEA’s literature can be seen in Ray (2004)4.
Dungana R.B., Nuthali P.L., Nartea.,G.V.,(2004).5,In this the author found the inefficiency of Nepalese rice farms under Data Envelopment Analysis based on the empirical findings in development strategies and policy implication. Dastgir et al (2012)6 analyzed the financial statements of 100 firms accepted in Tehran stock exchange by using window DEA model based on output oriented BCC model during the period between 2005 and 2010. The results showed that from among the companies involved in the sample, none of them was able to preserve 100% of their efficiency during the time period mentioned.
Y.C.Linetal (2013)6 evaluates the Decision making unit to assess economical and environmental factors with multiple inputs and multiple outputs under Data Envelopment Analysis. EtichE. Bett .E NyanwaroS. Kizito .K.(2014)7 analyzed to identify factors to find the influence in technical efficiency of Sorgham production among small holder farmers in lower eastern Kenya.
VMODEL SPECIFICATION
General input minimization CCR DEA model and BCC DEA model is presented here.
Let there be ‘n’; DMUs and each DMU consumes i=1 2 …p inputs and produces r=1 2 ..q outputs.
IJSRR, 8(1) Jan. – Mar., 2019 Page 1386 Min θ
Subject to constraints:
∑Xikλk≤ ,i=1,2,….p ∑Yrkλk≥ Yr0,r=1,2,…q
λk≥0, = 1,2 …
where θ represents the efficiency score of input p, λ’s represent the dual variables that identify the
benchmarks for inefficient units.
The corresponding Output oriented CCR model is, Max
Subject to constraints:
∑Xikλi≤ , i=1,2,….p ∑Yrkλk≥ yr0, r=1,2,…q
λk≥0, = 1,2 …
The efficiency which results is equal to one, always given by the CCR model and the DMUs with the lowest input or with highest output levels are related efficient. BCC model allows for variable returns to scale unlike the CCR model. BCC model measures technical efficiency as the convexity constraint ensures that the composite units are of similar scale size as the unit being measured.
Here, We employed output oriented DEA(Data envelopment Analysis model)to evaluate the production of oilseeds. The scale assumption is Variable returns to scale and the slacks calculated using multi-stage method. The version involving Φ is referred to as an output oriented envelopment
DEA program as it aims to maximize output production, subject to the given resource level.
B=min
Subject to: ∑Xikλk≤ , i=1,2,….p
∑Yrkλk≥ Yr0, r=1,2,…q
∑λk= 1 λk≥0, = 1,2 …
The corresponding BCC Output oriented model is,
Max Φ
Subject to constraints:
∑Xikλk≤ Xi0
∑Yrkλk≥ ΦYr0
IJSRR, 8(1) Jan. – Mar., 2019 Page 1387
Here this data is based on efficiency based output oriented model.
VIEMPIRICAL INVESTIGATION
Table 1: Input and Output data
S.NO STATES PRODUCTION('000 Tonnes) YIELD(Kgs/Hect)
AREA('000 Hectares)
1 ANDHRAPRADESH 873 955 914
2 ASSAM 185 605 306
3 BIHAR 128.2 1076 119.2
4 CHHATTISGARH 149.6 501 298.9
5 GUJARAT 4101.8 1603 2558.6
6 HARYANA 849.2 1608 528.2
7 HIMACHAL PRADESH 8.6 738 11.7
8 JAMMU AND
KASHMIR 40.5 677 59.7
9 JHARKHAND 176.9 681 259.6
10 KARNATAKA 867 651 1331
11 KERALA 0.6 1175 0.5
12 MADHYA PRADESH 6243.5 851 7336
13 MAHARASHTRA 2375 566 4193
14 ODISHA 114.5 642 178.3
15 PUNJAB 61.3 1318 46.5
16 RAJASTHAN 5710.6 1181 4834.8
17 TAMIL NADU 919.1 2230 412.2
18 TELUNGANA 496 1105 449
19 UTTAR PRADESH 863.5 668 1292
20 UTTARAKHAND 36 1091 33
21 WEST BENGAL 937.4 1181 793
To strengthen any study the calculationof basic descriptive statistics is essential. Here the author carried out the Descriptive analysis and it is presented below:
Table 2:Descriptive statistics
MEAN 1197.014286 1004.904762 1235.9615
MAXIMUM 6243.5 2230 7336
MINIMUM 0.6 501 0.5
STANDARD DEVIATION 1857.985584 431.3091588 1937.7708
N 21 21 21
Here the Mean, Standard deviation, Maximum and Minimum value have been found out for those 21 DMU’S. The average value for the 21 DMU’S for the output 1 is 1197.014286, output 2 is 1004.904762 and for the input the average value is 1235.9615. The standard deviation for the output 1 is 1857.985584, 431.3091588 for the output 2 and 1937.7708 for the input.
IJSRR, 8(1) Jan. – Mar., 2019 Page 1388
Table 3: CCR Efficiency Scores
DMU’S Φ STATUS
1 2.3364 Inefficient
2 3.6900 Inefficient
3 2.0661 Inefficient
4 4.444 Inefficient
5 1.3908 Inefficient
6 1.3870 Inefficient
7 2.924 Inefficient
8 3.2679 Inefficient
9 3.2679 Inefficient
10 3.4246 Inefficient
11 1 Efficient
12 2.6178 Inefficient
13 3.9370 Inefficient
14 3.4722 Inefficient
15 1.6778 Inefficient
16 1.8868 Inefficient
17 1 Efficient
18 2.020 Inefficient
19 3.3333 Inefficient
20 2.0202 Inefficient
21 1.8867 Inefficient
In this the states Andhra Pradesh, Assam, Bihar, Chattisgarh, Gujarat, Haryana, Himachal Pradesh, Jammu & Kashmir, Jharkhand, Karnataka, MadhyaPradesh, Maharashtra, Odisha, Punjab, Rajasthan, Telungana, Uttar Pradesh, Uttarkhand, and West Bengal are Inefficient states.
These DMU’s could attain its efficiency through slack and Radial movement i.e., these states could not give maximum output for the given level of input.
The following table provides reference set (peers) to the inefficient DMU. The inefficient DMU could improve its efficiency through their peers.
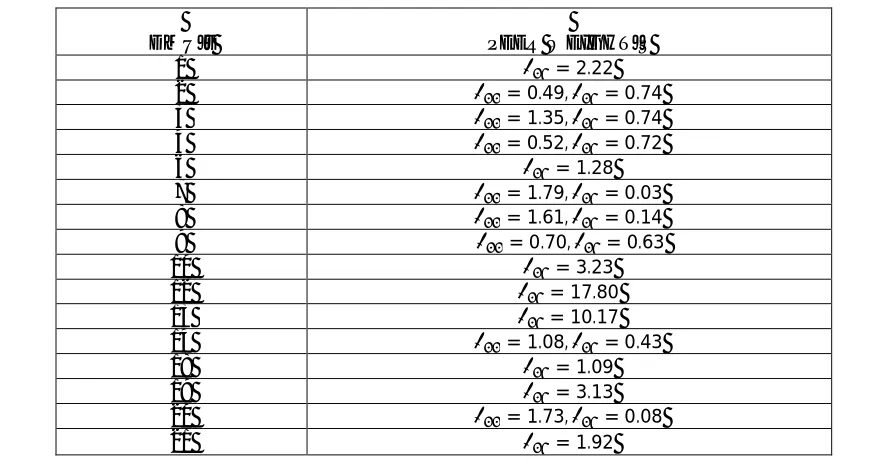
Table 4: Peer weights (CRS)
DMU’s PEER WEIGHT’S
1 = 2.22
2 = 0.49, = 0.74
3 = 1.35, = 0.74
4 = 0.52, = 0.72
6 = 1.28
7 = 1.79, = 0.03
8 = 1.61, = 0.14
9 = 0.70, = 0.63
10 = 3.23
12 = 17.80
13 = 10.17
14 = 1.08, = 0.43
18 = 1.09
19 = 3.13
20 = 1.73, = 0.08
IJSRR, 8(1) Jan. – Mar., 2019 Page 1389
Here for the states Andhra Pradesh, Assam, Bihar, Chattisgarh, Haryana, Himachal Pradesh, Jammu & Kashmir, Jharkhand, Karnataka, Madhya Pradesh, Maharashtra, Odisha, Telungana, Uttar Pradesh, Uttarkhand, West Bengal Peer weights are given. For example, the inefficient DMU Uttarkhand could improve its efficiency by comparing its input and output with DMU 11 and DMU 17 i.e.,Kerala and Tamil Nadu.
Ranking of efficient DMUs based on peer count summary is presented in the following table.
Table 5: Ranking of DMUs
DMU’s PEER COUNT RANK
11 9 2
17 18 1
Here Tamilnadu is in first Rank and Kerala is in Second position.
BCC output oriented model provides the following results and it is presented in Table 6.
Table 6: BCC Efficiency Scores
DMU’S Φ STATUS
1 1.9048 Inefficient
2 3.2468 Inefficient
3 1.3928 Inefficient
4 3.8911 Inefficient
5 1 Efficient
6 1.2853 Inefficient
7 1.6393 Inefficient
8 1.9960 Inefficient
9 2.7173 Inefficient
10 2.6315 Inefficient
11 1 Efficient
12 1 efficient
13 2.2123 Inefficient
14 2.5641 Inefficient
15 1 efficient
16 1 efficient
17 1 efficient
18 1.9646 Inefficient
19 2.5773 Inefficient
20 1.1695 Inefficient
IJSRR, 8(1) Jan. – Mar., 2019 Page 1390
Here the states Andhra Pradesh, Assam, Bihar, Chattisgarh, Haryana, Himachal Pradesh, Jammu & Kashmir, Jharkhand, Karnataka, Maharashtra, Odisha, Telungana, UttarPradesh, Uttarkhand, West Bengal are Inefficient DMU’s these States could not give maximum output for the given level of input. i.e., in CCR only 2 states are efficient and in BCC 6 states are efficient DMUs. This is due to the fact that BCC model has convexity constraint which admits Variable Returns to Scale assumption.
Peer weights for Variable Returns to Scale is given below in Table 7.
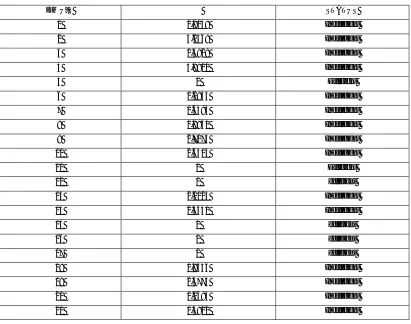
Table 7: Peers weights of VRS
For example the inefficient DMU Andhra Pradesh could improve its efficiencyby comparing its output with Gujarat and Tamil Nadu.
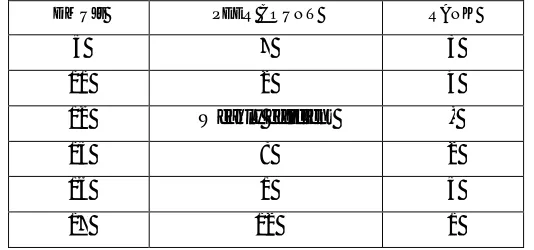
Ranking of efficient DMUs based on peer count summary is presented in the following table:
Table 8: Ranking of DMUs
DMU’s PEER WEIGHTS(INEFFICIENCY)
1 = 0.234, = 0.76
2 = 0.710, = 0.290
3 = 0.199, = 0.801
4 = 0.690, = 0.310
6 = 0.054, = 0.946
7 = 0.243, = 0.757
8 = 0.036, = 0.964
9 = 0.583, = 0.417
10 = 0.428, = 0.572
13 = 0.718, = 0.282
14 = 0.360, = 0.640,
18 = 0.017, = 0.983
19 = 0.410, = 0.590
20 = 0.707, = 0.293
21 = 0.823, = 0.177
DMU’s PEER COUNT RANK
5 7 3
11 2 4
12 Weakly efficient -
15 8 2
16 1 5
IJSRR, 8(1) Jan. – Mar., 2019 Page 1391
Here also Tamil Nadu is in First Rank, Punjab is in Second Position,Gujarat is in third Place, Kerala Fourth and Rajasthan is in fifth position. Here Madhya Pradesh is weakly efficient which doesn’t includes any lambda values.
Projection analysis for some DMUs has been given below
Results for firm: 1
Technical efficiency = 0.525 Scale efficiency = 0.816 (drs)
Projection summary variable
original value
radial movement
slack movement
projected value
output1 873.000 790.173 0.000 1663.173 output2 955.000 864.393 264.022 2083.416 input 1 914.000 0.000 0.000 914.000
Listing of peers:
peer lambda weight
5 0.234
17 0.766
Results for firm: 2
Technical efficiency = 0.308
Scale efficiency = 0.881 (drs)
Projection summary variable Original
Value
Radial Movement
slack movement
projected value
output1 185.000 415.915 69.079 669.993
output2 605.000 1360.153 0.000 1965.153
input 1 306.000 0.000 0.000 306.000
Listing of peers Peer lambda weight
17 0.710
15 0.290
VII CONCLUSION
IJSRR, 8(1) Jan. – Mar., 2019 Page 1392
methods. Thus it can be concluded that there is some difference in efficiency identification of DMU’s in output oriented DEA models. For each DMUs Peer weights and Rank values are found out separately for CRS and VRS models. Finally, we suggest that necessary steps should be taken to improve or strengthen the production and yield of oilseeds in India in upcoming years.
REFERENCES
1. Azadeh, A., Ghaderi, S.F., Mirjalili, M. and Moghaddam, M. ‘Integration ofanalytichierarchy process and data envelopment analysis for assessment and optimization of personnel productivity in a large industrial bank’, Expert Systems with Applications, 2011; 38(5): 5212–5225.
2. Banker RD, Charnes A, Cooper WW Some models for estimating technical and Scale efficiencies in data envelopment analysis. ManagSci1984; 30:1078–1092
3. A. Charnes, W.W. Cooper and E. Rhodes, "Short Communication; Measuring the Efficiency of Decision Making Units," European Journal of Operational Research1979; 3: 339.
4. A. Charnes, W.W. Cooper and E. Rhodes "Evaluating Program and Managerial Efficiency: An Application of Data Envelopment Analysis to Program Follow Through," Management Science 1981; 27: 668-697.
5. A. Charnes and W.W. Cooper, "Preface to Topics in Data Envelopment Analysis," Annals of Operations Research 1985; 2: 59-94.
6. A. Charnes, W.W. Cooper, E. Rhodes, Measuring the efficiency of DMUs, European Journal of Operational Research 1978; 2: 429–444.
7. Charnes A, CooperWW, Golany B, Seiford L, Stutz J Foundations of data envelopment analysis for Pareto-Koopmans efficient empirical production functions, Econom1985; 30:91– 107
8. Cooper WW, Park KS, Pastor JT RAM: a range adjusted measure of inefficient for use with additive models, and relations to other models and measures in DEA. J product Anal 1999; 11:5–24
9. Färe R, Lovell CAK Measuring the technical efficiency of production. J Econ Theory 1978; 19:150–162
10.Dhungana R.B., NuthaliP.L.Nartea G.V.,’Meaauring the Economic inefficiency of Nepalese Rice farms.Using Data Envelopment Analysis. The Australian Journal of Agriculture and Resource Economics 2004; 48(2):347-69.
IJSRR, 8(1) Jan. – Mar., 2019 Page 1393