O R I G I N A L P A P E R
Open Access
Port selection based on customer
questionnaire: a case study of German port
selection
Yisong Lin
*and Xuefeng Wang
Abstract
A new research idea regarding port selection concerns customer-oriented, rather than product-oriented, thinking. Through investigation and interviews with over 280 active customers in the global shipping industry, port selection criteria were proposed, and an evaluation scheme based on the responses to a questionnaire survey is compared with a scheme based on the weight calculation of the analytic hierarchy process. The results indicate that due to different priorities between customers and container carriers, port selection is sometimes inconsistent. Against the background of deployment of large-scale vessels, over-capacity has become normal in the industry; this study has great practical value for the whole industry.
Keywords:Customer questionnaire, Port selection, Customer orientation, Product orientation, Analytic hierarchy process
1 Introduction
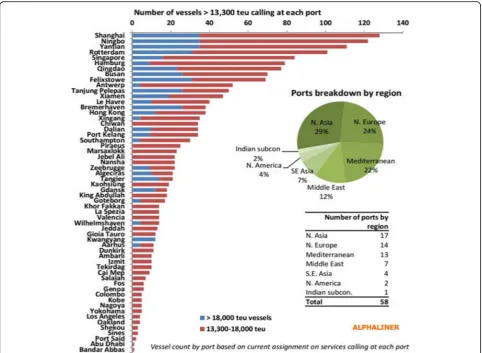
An obvious change in the container shipping industry is the upsizing of container vessels due to large-scale vessel deployment. According to industry consultant Alphali-ner, the average size of global container fleet increased from 2606 TEU (twenty-foot equivalent unit) in 2000 to 4074 TEU by the end of 2018, with container vessels over 10,000 TEU accounting for 32% of the fleet, re-spectively. The proportion of large-scale vessels will further increase following new orders and deployment of even larger vessels of over 20,000 TEU. The potential available calling ports are relatively limited in number, due to limitations of channel and berth draft, berth length, terminal facilities, and market capacity. Taking vessels over 13,300 TEU as an example, only 53 ports worldwide can accommodate this type of vessel, with 17 ports located in Northeast Asia, 27 in Europe and the Mediterranean region, 7 in the Middle East, and 2 in North America (Fig.1).
The upsizing of container vessels has significantly changed the port selection of container carriers. The limitation of potential available calling ports leads to
homogeneity in the products and services of container carriers. As low-cost ports gain traction, whether to transfer service routes to emerging, low-cost ports remains a hot topic. In terms of German port selection, Hamburg remains the most popular calling port among the four German ports of Hamburg, Wilhelmshaven, Bremen, and Bremerhaven. However, the natural
condi-tion of Hamburg port is not ideal, as the seaport’s
entrance draft is only 14.5 m and its export draft is only 13.3 m. Large ships (over 18,000 TEU) generally require drafts of more than 16 m; full-load vessels are required to wait for the tide to pass through. Wilhelmshaven appears to be a good alternative, as the water depth reaches 18 m and it is located close to the open sea and an international waterway. A question then arises re-garding customers’ actual choices, as well as the deter-minants thereof.
In this research, a questionnaire was distributed to 315 various active shipping customers, yielding 287 useable responses, Respondents included cargo owners, and freight-forwarding companies. The indicators and rea-sons behind their selection of a German port were examined in detail. The evaluation scheme based on the indicators and corresponding weight from the question-naire survey was compared with an Analytic Hierarchy
© The Author(s). 2019Open AccessThis article is distributed under the terms of the Creative Commons Attribution 4.0 International License (http://creativecommons.org/licenses/by/4.0/), which permits unrestricted use, distribution, and reproduction in any medium, provided you give appropriate credit to the original author(s) and the source, provide a link to the Creative Commons license, and indicate if changes were made.
* Correspondence:[email protected];[email protected]
Process (AHP) solution to provide a solution regarding port selection based on customer-oriented thinking.
1.1 Literature review
Product-oriented thinking is very common in the indus-try; therefore, the existing literature on port selection mainly focuses on the position of container liners and seeks to optimize costs and other criteria such as port efficiency, location, service, and physical infrastructure. Taih-Cherng et al. (2003) evaluated the importance of various criteria in transshipment port selection from a container carrier’s perspective and revealed that port
competitiveness mainly depends on carriers’ costs and
efficiency in loading and discharging [1]. Guy and Urli (2006) examined how the combined importance of qual-ity of infrastructure, cost, service, and geographical loca-tion affect shipping lines’ port choice [2]. Chang et al. (2008) examined the different factors affecting shipping
lines’ port selections. They collected data through a
survey of shipping companies and analyzed it from the varying perspectives of trunk liners and feeder service providers [3]. Nguyen (2011) constructed a model for
port selection by minimizing total cost and two sensitiv-ity analyses were used to evaluate different service pat-terns, and the efficiency of large vessels in the scope context of a logistics network [4]. Kadaifci et al. (2019) used a multi-criteria decision-making approach to exam-ine the effects of transportation cost, geographical loca-tion, infrastructure, and technical conditions on port selection [5]. Nazemzadeh and Vanelslander (2015) ana-lyzed port selection criteria through questionnaire sur-veys of three different industry groups [6]. It can be concluded that a common characteristic of these studies is the concern for cost saving. Decision-making was based on cost optimization and container carrier’s con-cerns regarding improving efficiency, service and geo-graphical location convenience, and so on.
Other studies examine indicators such as hinterland connection, feeder connectivity, scale economies, cargo balance, and environmental issues. Bart et al. (2008) inves-tigated how hinterland connections, port tariffs, feeder connectivity, and environmental issues affect deep-sea container operators’port selections [7]. Tand et al. (2011) investigated the quality characteristics of port selection.
Findings revealed that port efficiency and scale economies are the important dimensions influencing container car-riers’ selection [8]. Based on a case study of the Spanish container trade, Veldman et al. (2013) introduced new variables such as coastline and inland transport cargo bal-ance to expand upon earlier research [9]. Some studies established the criteria and sub-criteria system for con-tainer carrier’s port selection. Onut et al. (2011) examined the criteria and sub-criteria for port selection through a case study of port selection in the Marmara region of Turkey [10] .Chou (2010) examined the criteria and sub-criteria from shipping lines’perspectives [11]. Button et al. (2015) investigated how incorporating subjective elements affects port selection [12]. In addition, a few papers have examined port selection from the viewpoint of container liners in specific environments. Yeo et al. (2014) analyzed port selection in uncertain environments [13]. Notteboom et al. (2017) investigated the complex link between port selection by shipping alliance members and changing organizational routines [14].
Based on the above mentioned literature review, it can be concluded that the related indicators were well reflected in port selection from the viewpoint of container liners. However, it remains a question as to whether cus-tomers match the container carriers’choices and if their concerns are different. It is necessary to examine port se-lection from the viewpoint of customers especially under the current trend of container vessels’upsizing.
There are very few papers that examine the effects of customers’port selection choices. Tongzon (2009) exam-ined the major aspects influencing port choice from the perspective of Southeast Asian freight forwarders [15]. Kashiha et al. (2016) investigated how geography and transportation costs influence shippers’decisions regard-ing port selection [16]. Balci et al. (2018) studied ter-minal competition and selection criteria in the dry bulk market via a case study of Izmir, Turkey [17]. A com-mon research approach for above mentioned literature was to rate the pre-selected indicators by sampling cus-tomers; indicator weight was calculated in a different manner. However, as all indicators were included in the pre-selection, the effects of subdividing indicators on
customers’ port selections were not studied.
Further-more, the indicators’weights (calculated by the mathem-atical model) were not verified, which is precisely what this paper intends to contribute to the literature.
2 3. Results and discussion 2.1 3.1 Survey participants
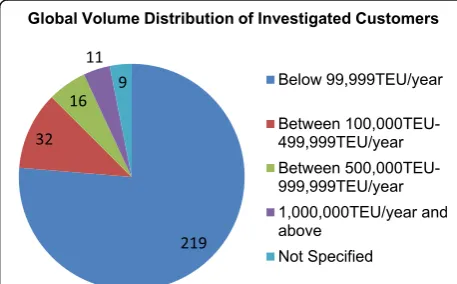
A total of 315 questionnaires were issued, and 287 valid questionnaires were recovered. Among the 287 valid re-sponses, 219 (76%) participants (shipping industry cus-tomers) had a global volume of less than 99,999 TEU/ year; 32 (11%) had a global volume of 100,000 to 499,
999 TEU/year; 16 (6%) had a global volume of 500,000 to 999,999 TEU/year; 11 (4%) had a global volume of 1, 000,000 TEU/year, while volume size is not specified for 9 (3%) participants.
In terms of participants’ volume on the Asia–Europe route, 204 (71%) have a volume of 9999 TEU or less; 45 (16%) have a volume of 10,000 TEU to 49,999 TEU/year; 17 (6%) have a volume of 50,000 to 99,999 TEU/year; 13 (5%) have a volume of 100,000 TEU/year and above; the annual volume size was not specified by 8 (2%) participants.
In terms of the cargo volume distribution in Germany, there are 217 (76%) participants with German shipments of 4999 TEU/year or less; 24 (8%) with shipments be-tween 5000 and 9999 TEU/year; 26 (9%) with shipments between 10,000 and 49,999 TEU/year; seven (2%) with shipments of 50,000 TEU/year and above; the volume of
German shipments on the Asia–Europe route was not
specified by 13 (5%) participants.
While the questionnaire covers customers of various sizes in the market, it mainly includes small- and medium-sized entities. This is consistent with the pro-portional distribution of various customers. Customers selected for the survey questionnaire have a wide range of representation in port selection (Fig.2).
2.2 3.2 Survey indicators setting
Traditionally, under the guidance of “product-oriented” thinking, container carriers believe that as long as the call-ing ports can contribute to reduccall-ing the network cost, im-prove delivery time, and maintain uniqueness, selection of such ports makes good business sense. However, through the questionnaire survey, a totally different concern was found regarding port selection. The level indicators pro-posed by participants in the questionnaire survey include freight competitiveness, service capability, cooperation and relationship, and “others” (which includes aspects such as
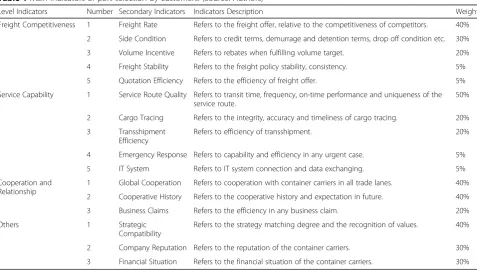
container liners’strategic compatibility, reputation, and fi-nancial situation). A number of subdivided indicators com-prise the elements for evaluation of the level indicators. Correspondingly, these levels were also named as secondary indicators. Both types of indicators are key elements in customers’port selection. Therefore, this is the evaluation indicator for assessing customer-oriented thinking. The composition and weights of the level indicators and second-ary indicators are shown in Table1.
In the questionnaire survey regarding port selection indicators, multiple choices were designed so as to
examine customers’ concern on different indicators.
Therefore, the sum of all options was used to calculate the weights of indicators. Among the participants, 259 (41.5%) selected “Freight Competitiveness” 223 (35.7%) selected “Service Capability” 122 (19.6%) selected “
Co-operation and Relationship” while 20(3.2%) selected
“Others”respectively.
In addition, 120 (42%) participants indicated that they would generally not change the core carrier; 75 would change their core carrier at any time, accounting for 26%; 52 would change their core carrier every year, accounting for 18%; 40 (14%) do not have fixed core carriers; The 120 participants who selected“basically
un-changed” cover all global NVOCCs (non-vessel
operat-ing common carriers) with cargo volumes above 50,000 TEU/year in Germany, which indicates that global NVOCCs appear to be more stable than small- and medium-sized freight-forwarding companies.
2.3 3.3 Survey results and discussion
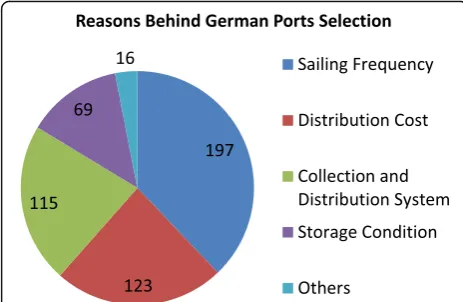
The main ports available in Germany are the ports of Hamburg, Bremen, Bremerhaven, and Wilhelmshaven. Ac-cording to the results of our survey, the port of Hamburg is still the preferred calling port for most customers. A total of 276 (79%) participants selected Hamburg; 37 (11%) se-lected Bremen; 30 (9%) sese-lected Bremerhaven; only four (1%) selected Wilhelmshaven as their preferred calling port. The reasons for selection were analyzed through the questionnaire survey. A total of 197 (38%) participants attributed the aforementioned choices to “Sailing Fre-quency,” while 123 (24%) participants attributed the rea-son to“Distribution Cost”Interviews revealed that many distribution centers are located near the port of Hamburg and its surrounding areas and switching to Wilhelms-haven and BremerWilhelms-haven will significantly increase the cost of logistics and distribution. A total of 115 participants (22%) attributed their selection to the“Collection and Dis-tribution System”. (Fig.3).
Further research on potential change of ports showed that 30 participants (11%) are willing to change to the port of Wilhelmshaven, but 98 (34%) participants clearly stated that they will not accept Wilhelmshaven; 159 (55%) partic-ipants indicated that a switch was “uncertain” or that it would happen“depending on the service”.
The survey revealed that when evaluating a potential change, customers pay the highest attention to “Better Freight Rate.” A total of 234 (43%) participants selected “Better Freight Rate,” 110 (20%) selected “Efficient
Table 1Main indicators of port selection by customers. (Source: Authors)
Level Indicators Number Secondary Indicators Indicators Description Weight
Freight Competitiveness 1 Freight Rate Refers to the freight offer, relative to the competitiveness of competitors. 40%
2 Side Condition Refers to credit terms, demurrage and detention terms, drop off condition etc. 30%
3 Volume Incentive Refers to rebates when fulfilling volume target. 20%
4 Freight Stability Refers to the freight policy stability, consistency. 5%
5 Quotation Efficiency Refers to the efficiency of freight offer. 5%
Service Capability 1 Service Route Quality Refers to transit time, frequency, on-time performance and uniqueness of the service route.
50%
2 Cargo Tracing Refers to the integrity, accuracy and timeliness of cargo tracing. 20%
3 Transshipment
Efficiency
Refers to efficiency of transshipment. 20%
4 Emergency Response Refers to capability and efficiency in any urgent case. 5%
5 IT System Refers to IT system connection and data exchanging. 5%
Cooperation and Relationship
1 Global Cooperation Refers to cooperation with container carriers in all trade lanes. 40%
2 Cooperative History Refers to the cooperative history and expectation in future. 40%
3 Business Claims Refers to the efficiency in any business claim. 20%
Others 1 Strategic
Compatibility
Refers to the strategy matching degree and the recognition of values. 40%
2 Company Reputation Refers to the reputation of the container carriers. 30%
Delivery and Transit,”107 (20%) selected“Additional De-tention and Demurrage,” 90 (16%) selected “Extra Free Storage Condition,”and seven (1%) selected“others”.
It seems that container carriers depend heavily on low-cost calling ports to achieve cost savings but have been forced to offer discounted freight rates and add-itional free detention, demurrage, and storage condi-tions, which does not create cost savings. Therefore, it is necessary to improve the traditional evaluation system based on the cost optimization of container liners and establish a new evaluation system of port selection based on customers.
3 4. Methods
Our scheme evaluation was based on indicator weights set by responses to our questionnaire survey. These weights were determined to be the most relevant factors, thus allowing internal linkages to be studied. Discussion
and communication facilitated by the surveys was useful for understanding the concrete decision-making process. Likewise, the responses elucidated customers’ concerns in port selection. Acquisition of this first-hand informa-tion is conducive to understanding selecinforma-tion and evalu-ation criteria based on customers’ thinking. For these reasons, this method was chosen.
Additionally, there are hierarchical relationships among the various indicators in the questionnaire survey. The level indicators involved in customers’ decision-making processes are composed of various subdivided indicators. These secondary indicators are the core elements of cus-tomers’evaluation and selection. The AHP method is ef-fective in analyzing hierarchical and internal relationships between different indicators. Thus, it was selected as our evaluation procedure. The results were compared with and analyzed according to the questionnaire survey.
The level indicators and secondary indicators both ori-ginate from customers’ questionnaire results regarding the aforementioned methods. The difference lies in that the weights of level indicators were set directly
accord-ing to customers’ voting proportion. Meanwhile, the
weights of secondary indicators were derived from the expert survey results. However, both weights (level indi-cators and secondary indiindi-cators) are calculated using the AHP method. The evaluation system for port selection is shown in Fig.4.
The raw data of the ports of Wilhelmshaven, Hamburg,
Bremen, and Bremerhaven are presented in Table 2
below.
According to the questionnaire survey, 259 (41.5%) par-ticipants selected “Freight Competitiveness,” 223 (35.7%) selected“Service Capability.”Moreover, 122 (19.6%) and 20 (3.2%) participants selected“Cooperation and Relationship”
Fig. 3Reasons behind german ports selection. (Source: Authors)
and“Others,”respectively. The choices made by the partici-pants can be used as the weight of different indicators. Therefore, the weight of“Freight Competitiveness”is set as 41.5%, the weight of“Service Capability”is set as 35.7%, the weight of“Cooperation and Relationship” is set as 19.6%, and that of“Others”is set to 3.2%. The scheme evaluation based on the indicator weights set by the questionnaire sur-vey is then compared with that under the AHP method.
3.1 4.1 Scheme evaluation based on Indicator weights set by questionnaire survey
As the raw data of the indicators were calculated using different dimensions and units, they need to be stan-dardized for comparison. When the indicator is positive, its standardized formula is:
x0 ij¼
xij−xmin
j
xmax
j −xminj ð
1Þ
When the indicator is negative, its standardized for-mula is:
x0ij¼
xmax
j −xij
xmax
j −xminj ð
2Þ
According to the above formulas, the processing of the raw data for Wilhelmshaven, Hamburg, Bremen, and
Bremerhaven are presented in Table3.
According to the questionnaire survey, the secondary indicators that constitute “Freight Competitiveness” are
“Freight Rate”(40%),“Side Condition”(30%),“Volume In-centive”(20%),“Freight Stability”(5%), and“Quotation Effi-ciency”(5%), as set during the interviews and the fact that customers pay significant attention to the actual rate offer and related conditions, such as the credit terms, demurrage and detention terms, drop-off condition, and volume in-centive when achieving the volume target of container car-riers. Therefore, the weight of secondary indicators can be calculated as 16.6% for “Freight Rate,” 12.45% for “Side Condition,” 8.3% for “Volume Incentive,” and 2.075% for both“Freight Stability”and“Quotation Efficiency.”
Secondary indicators that constitute“Service Capability” are “Service Route Quality” (50%), “Cargo Tracing” (20%), “Transshipment Efficiency” (20%), and 5% for both“ Emer-gency Response”and“IT System.”This is based on the in-terviews and the fact that customers choose different services provided by container liners mainly through the evaluation of transit time, frequency, on-time performance, and uniqueness of the service route. Cargo tracing, trans-shipment efficiency, emergency response in urgent cases, and the possibility and convenience of IT system connec-tion and data exchange are also major consideraconnec-tions. Therefore, the weight of secondary indicators can be calcu-lated as 17.85% for“Service Route Quality,”7.14% for both “Cargo Tracing” and “Transshipment Efficiency,” and 1.785% for both“Emergency Response”and“IT System.”
Secondary indicators that constitute “Cooperation and Relationship”are“Global Cooperation”(40%),“Cooperative History”(40%), and“Business Claims”(20%). This is based on the interviews and the fact that customers pay almost
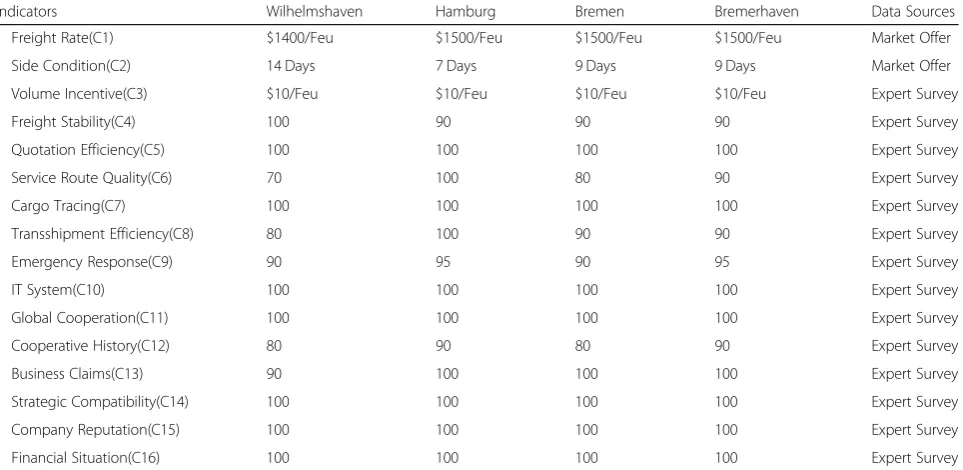
Table 2Raw data of the indicators of four German ports (Source: Authors)
Indicators Wilhelmshaven Hamburg Bremen Bremerhaven Data Sources
Freight Rate(C1) $1400/Feu $1500/Feu $1500/Feu $1500/Feu Market Offer
Side Condition(C2) 14 Days 7 Days 9 Days 9 Days Market Offer
Volume Incentive(C3) $10/Feu $10/Feu $10/Feu $10/Feu Expert Survey
Freight Stability(C4) 100 90 90 90 Expert Survey
Quotation Efficiency(C5) 100 100 100 100 Expert Survey
Service Route Quality(C6) 70 100 80 90 Expert Survey
Cargo Tracing(C7) 100 100 100 100 Expert Survey
Transshipment Efficiency(C8) 80 100 90 90 Expert Survey
Emergency Response(C9) 90 95 90 95 Expert Survey
IT System(C10) 100 100 100 100 Expert Survey
Global Cooperation(C11) 100 100 100 100 Expert Survey
Cooperative History(C12) 80 90 80 90 Expert Survey
Business Claims(C13) 90 100 100 100 Expert Survey
Strategic Compatibility(C14) 100 100 100 100 Expert Survey
Company Reputation(C15) 100 100 100 100 Expert Survey
Financial Situation(C16) 100 100 100 100 Expert Survey
equal attention to global cooperation rather than being re-stricted to specific routes and the assessment of historical cooperation and future expectations. The efficiency of busi-ness claims also has an impact on customer choice. There-fore, the weight of secondary indicators can be calculated as 7.87% for both“Global Cooperation” and” Cooperative History,”and 3.92% for“Business Claims.”
Other indicators include“Strategic Compatibility”(40%)
and “Company Reputation” and “Financial Situation”
(both 30%). This is also based on the interviews and the fact that customers pay much more attention to strategic consistency, value recognition, and the evaluation of the container liners’reputation and financial situation. There-fore, the weight of secondary indicators can be calculated as 1.28% for“Strategic Compatibility” and 0.96% for both “Company Reputation”and“Financial Situation.”
According to the standardized data in Table3and the calculation formula
Zi¼ Xp
j¼1
ωjx0ij ð3Þ
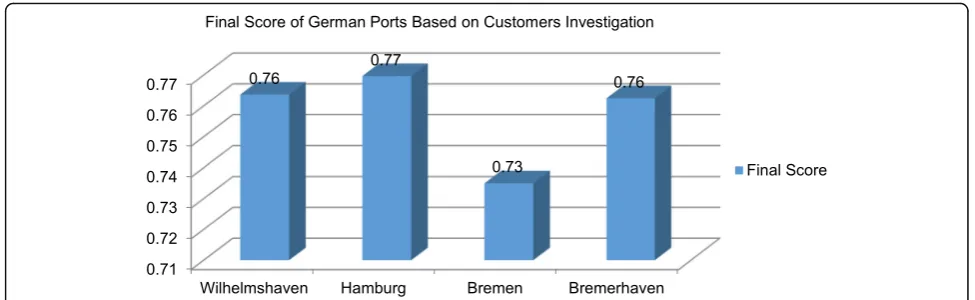
The final scores of the four alternative calling ports are presented in Table4.
Based on the aforementioned evaluations, the order of preference for the German ports is as follows: Hamburg, Wilhelmshaven, Bremerhaven, and Bremen (Fig.5, presents the order of preference).
3.2 4.2 Scheme evaluation by AHP method
The AHP is a decision analysis method proposed by American operations researcher T.L. Satty in the 1970s. It
combines qualitative and quantitative analysis to solve complex multi-objective problems, and is widely applied in the scheme evaluation of port selection. Taih-Cherng et al. (2003) conducted a field survey of container carriers to analyze transshipment port selection from their per-spective. Subsequently, Button et al. (2015) applied the AHP method to reveal the liners’ seaport choice assess-ments. The advantages of AHP lie in its capacity to deal with a wide range of qualitative and quantitative variables. Its disadvantages originate from untrustworthy responses, or divergent and contrary answers (Nazemzadeh and Vanelsander, 2015). There have been many other applica-tions of AHP to transport problems, proving it to be a valid approach to the current analysis. Therefore, the AHP method was chosen to evaluate port selection criteria in this paper. The calculation steps are as follows:
(1) Identify goals and indicators.
Evaluation indicators number P,u= {u1,u2,⋯⋯,up}.
(2) Construction of judgment matrix.
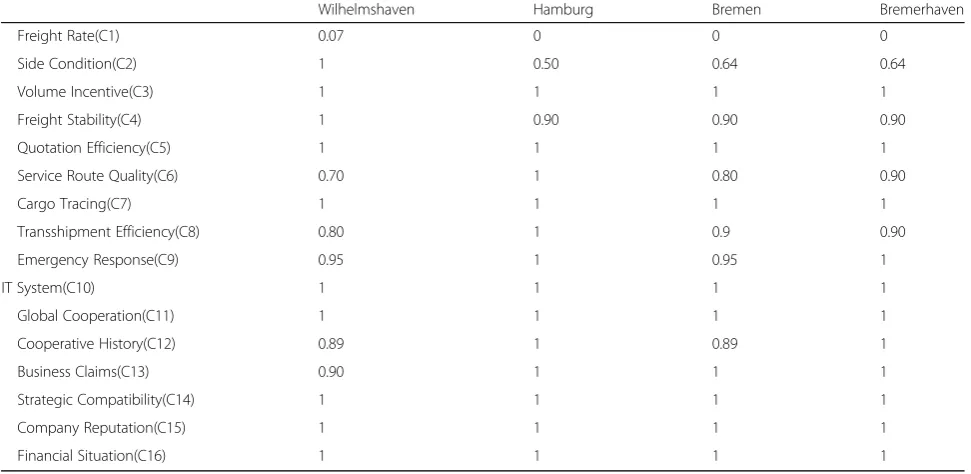
Table 3Standardization of evaluation indicators data in German ports. (Source: Authors)
Wilhelmshaven Hamburg Bremen Bremerhaven
Freight Rate(C1) 0.07 0 0 0
Side Condition(C2) 1 0.50 0.64 0.64
Volume Incentive(C3) 1 1 1 1
Freight Stability(C4) 1 0.90 0.90 0.90
Quotation Efficiency(C5) 1 1 1 1
Service Route Quality(C6) 0.70 1 0.80 0.90
Cargo Tracing(C7) 1 1 1 1
Transshipment Efficiency(C8) 0.80 1 0.9 0.90
Emergency Response(C9) 0.95 1 0.95 1
IT System(C10) 1 1 1 1
Global Cooperation(C11) 1 1 1 1
Cooperative History(C12) 0.89 1 0.89 1
Business Claims(C13) 0.90 1 1 1
Strategic Compatibility(C14) 1 1 1 1
Company Reputation(C15) 1 1 1 1
Financial Situation(C16) 1 1 1 1
Table 4Final score of German ports based on customers investigation weight. (Source: Authors)
German Ports Final Score
Wilhelmshaven 0.76
Hamburg 0.77
Bremen 0.73
Judging the value of the elements of the matrix reflects people’s understanding of the relative importance of each element, generally using a scale from 1 to 9 and its recip-rocal method. However, when the importance of the mutual comparison factor can be explained through a meaningful ratio, the value of the corresponding element of the judgment matrix is taken as the ratio. That is, the judgment matrix is obtained byS= (uij)p×pTable5.
(3) Calculating the Judgment Matrix.
The maximum eigenvalueλmaxof the judgment matrix
S and its corresponding eigenvector A are calculated
using MATLAB software. This eigenvector is the order of importance of each evaluation factor, that is, the distribution of weight coefficients.
(4) Consistency Test.
To perform the consistency test of the judgment matrix, it is necessary to calculate the consistency indicator.
CI¼λmaxn−−n
1 ð4Þ
The average random consistency indicator RI
ran-domly constructs 500 sample matrices. The constructor
randomly fills the upper triangles of the sample matrix with scales and their reciprocals. The values of the main diagonal are always 1, and the reciprocal of the random number corresponding to the above position is used for the corresponding transposed position. Then, the consistency indicator values are calculated for each random sample matrix, and the average random consistency indicator value is obtained by averaging these values. When the random consistency ratio is, the results of the hierarchical analysis ranking are considered to be satisfactory, that is, the distribution of the weight coefficients is reasonable; otherwise, the value of the elements of the judgment matrix is adjusted, and the value of the weight coefficient is re-allocated.
Table6presents the results of consistency indicatorRI.
(5) Judgment Matrix Construction and Solution of Weights.
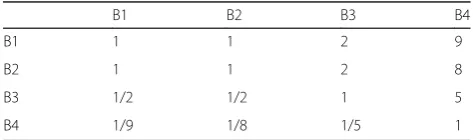
According to the indicator system, through the afore-mentioned scale method and the expert consultation method, eight experts in the field were selected and the degree of importance of the indicators was scored separ-ately. The results were then further discussed and sum-marized internally, and the following 2 × 2 judgment matrix was obtained Table7.
Table 5Scale of relative importance of elements. (Source: Authors)
Scale Meaning
1 Two elements are equally important
3 Compared with the two elements, the former is slightly more important than the latter.
5 Compared with the two elements, the former is more important than the latter.
7 Compared with the two elements, the former is obviously more important than the latter.
9 Compared with the two elements, the former is absolutely more important than the latter.
2,4,6,8 Intermediate value of the above adjacent judgment
Reciprocal If element i is aijcompared to element j, element j is 1/ aijcompared to element i.
The maximum eigenvalue of the judgment matrix is cal-culated using MATLAB software. To check the consistency of the judgment matrix, the consistency indicator needs to be calculated:
CI¼λmaxn−−n 1 ¼
4:0047−4
4−1 ¼0:0016
The average random consistency indicator RI= 0.9.
The random consistency ratio is
CR¼CIRI ¼0:0016
0:9 ¼0:0017<0:10
Therefore, the results of the hierarchical analysis rank-ing are considered to have satisfactory consistency, that is, the distribution of the weight coefficients is reason-able Treason-able8.
We use the analytic hierarchy method to find the index weight for each of the secondary indicators under the level indicators“Freight Competitiveness (B1),” “
Ser-vice Capability (B2),” “Cooperation and Relationship
(B3),”and“Other Indicators (B4).”
Under the level indicator “Freight Competitiveness
(B1),” a judgment matrix S= (uij)p×p is constructed for each sub-indicator. The results are shown in Table9.
The maximum eigenvalue λmax= 5.0133 of judgment
matrix S is calculated using MATLAB software. To
check the consistency of the judgment matrix, the consistency index needs to be calculated:
CI¼λmaxn−−n 1 ¼
5:0133−5
5−1 ¼0:0033
The average random consistency index is RI= 1.12.
The random consistency ratio is
CR¼CIRI ¼0:0033
1:12 ¼0:0030<0:10
The results of the hierarchical analysis ranking are considered to have satisfactory consistency, that is, the
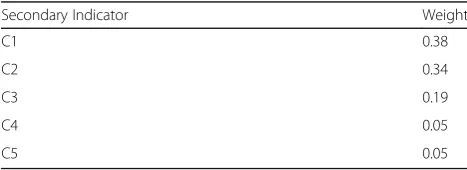
distribution of the weight coefficients is very reasonable. The weights of the sub-indicators “Freight Rate (C1),” “Side Condition (C2),” “Volume Incentive (C3),” “Freight Stability (C4),” and “Quotation Efficiency (C5)” under the level indicator “Freight Competitiveness (B1)” are
shown in Table10.
Under the level indicator “Service Capability,” a judg-ment matrix S= (uij)p×p is constructed for each sub-indicator, as shown in Table11.
The maximum eigenvalue λmax= 5.0022 of judgment
matrixSis calculated using MATLAB software. To check
the consistency of the judgment matrix, the consistency indicator needs to be calculated:
CI¼λmaxn−−n 1 ¼
5:0022−5
5−1 ¼5:5506e−04
The average random consistency indicator isRI= 1.12. The random consistency ratio is CR¼CIRI ¼5:5506e−04
1:12 ¼4
:9559e−04<0:10.
Therefore, the results of the hierarchical analysis rank-ing are considered to have satisfactory consistency, that is, the distribution of the weight coefficients is very reason-able. The weights of the secondary indicators “Service Route Quality (C6),”“Cargo Tracing (C7),” “ Transship-ment Efficiency (C8),” “Emergency Response (C9),” and “IT System (C10)” under the first-level indicator“Service Capability (B2)”are shown in Table12.
Under the level indicator “Cooperation and Relation-ship,” judgment matrix S= (uij)p×p is constructed for each sub-indicator. The results are shown in Table13.
The maximum eigenvalue λmax= 3.0000 of the
judg-ment matrix S is calculated using MATLAB software.
To check the consistency of the judgment matrix, the consistency indicator needs to be calculated:
CI¼λmax−n
n−1 ¼3:00003−1−3¼0 The average random
consistency indicator is RI= 0.58. The random
consistency ratio is
Table 7The judgement matrix of the first-level indicators. (Source: Authors)
B1 B2 B3 B4
B1 1 1 2 9
B2 1 1 2 8
B3 1/2 1/2 1 5
B4 1/9 1/8 1/5 1
Table 8Weight of level indicators. (Source: Authors)
Indicator level Weight
B1 0.39
B2 0.37
B3 0.20
B4 0.04
Table 6Average random consistency indicator. (Source: Authors)
n 1 2 3 4 5 6 7 8 9 10 11 12 13 14 15
CR¼CIRI ¼ 0
0:58¼0<0:10
The results of the hierarchical analysis ranking are considered to have satisfactory consistency, that is, the distribution of the weight coefficients is very reasonable.
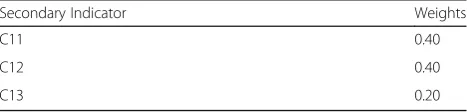
The weights of the sub-indicators “Global Cooperation
(C11),”“Cooperative History (C12),” and “Business
Claims (C13)” under the first-level indicator “ Cooper-ation and RelCooper-ationship (B3)”are shown in Table14.
Under the first-level indicator “Other Indicators(B4),” judgment matrixS= (uij)p×pis constructed for each sub-indicator. The results are shown in Table15.
The maximum eigenvalue λmax= 5.0133 of judgment
matrix S is calculated using MATLAB software. To
check the consistency of the judgment matrix, the consistency indicator needs to be calculated:
CI¼λmaxn−−n 1 ¼
3:0000−3 3−1 ¼0
The average random consistency indicator isRI= 1.12. The random consistency ratio is
CR¼CIRI ¼ 0
0:58¼0<0:10
Therefore, the results of the hierarchical analysis rank-ing are considered to have satisfactory consistency, that is, the distribution of the weight coefficients is very
rea-sonable. The weights of the sub-indicators “Strategic
Compatibility(C14)”,” Company Reputation(C15)”and
“Financial Situation(C16)” under the first-level indicator “Others”are shown in Table16.
Therefore, under the AHP, the weights and compre-hensive weights of the level indicators and secondary
indicators of port selection by customers are calculated
and shown as Table17.
The dimensions and units of each indicator are differ-ent and cannot be directly compared and calculated, so they need to be standardized before evaluation.
When the indicator is positive, its standardized for-mula is:
x0ij¼
xij−xmin
j
xmax
j −xminj ð
5Þ
When the indicator is negative, its standardized for-mula is:
x0ij¼
xmax
j −xij
xmax
j −xminj ð
6Þ
According to the above formula, the raw data of the port of Wilhelmshaven, Hamburg, Bremen, and Bremer-haven are processed, and the standardized data forms are shown in Table18.
According to the calculation formula Zi¼P j¼1
p
ωjx0ij, the
scores of the ports of Wilhelmshaven, Hamburg, Bremen, and Bremerhaven are calculated and shown as Table19.
The aforementioned AHP evaluation system reveals the priority of four alternative calling ports in Germany: Hamburg, Wilhelmshaven, Bremerhaven, and Bremen.
3.3 Results and discussion
According to evaluation based on indicator weights (as set by questionnaire results), there was no difference in priority among the four alternative calling ports. The same results were found using the AHP evaluation
Table 9The judgment matrix under“Freight Competitiveness”. (Source: Authors)
C1 C2 C3 C4 C5
C1 1 1 2 8 8
C2 1 1 2 6 6
C3 1/2 1/2 1 4 4
C4 1/8 1/6 1/4 1 1
C5 1/8 1/6 1/4 1 1
Table 10Weight of secondary indicators under“Freight Competitiveness”. (Source: Authors)
Secondary Indicator Weight
C1 0.38
C2 0.34
C3 0.19
C4 0.05
C5 0.05
Table 11The judgement matrix under“Service Capability”. (Source: Authors)
C6 C7 C8 C9 C10
C6 1 2 2 9 9
C7 1/2 1 1 4 4
C8 1/2 1 1 4 4
C9 1/9 1/4 1/4 1 1
C10 1/9 1/4 1/4 1 1
Table 12Weight of secondary indicators under“Service Capability”. (Source: Authors)
Secondary Indicator Weights
C6 0.46
C7 0.22
C8 0.22
C9 0.05
system. However, under this same customer- oriented thinking, slightly different concerns are evident.
The indicator of“freight competitiveness”has a signifi-cantly higher weight than other indicators, as evidenced in the survey results. This reflects customers’high atten-tion of freight offer in the quesatten-tionnaire survey. As dominant factors, freight rate, side condition, volume incentive, freight stability, and quotation efficiency attracted more attention in customers’ port selection. Weights of“Freight Competitiveness” and “Service Cap-ability”are roughly equal under the AHP evaluation sys-tem, showing similar levels of concern for freight offer and customer service. Through further analysis of the secondary indicators, it was found that the main
differ-ences come from “Cargo Tracing” and “Transshipment
Efficiency.” The implicit indicators affecting port selec-tion may be overlooked by customers in the quesselec-tion- question-naire survey, but were well considered under the AHP evaluation system. AHP results were both supplementary and confirmatory to the questionnaire conclusions.
Additionally, there is consistency in the main second-ary indicators under both evaluation systems. Service route quality, freight rate, and side condition are the key
subdividing indicators of customers’ port selection.
These effects can also be verified in practice, as cus-tomers focus on transit time, frequency, on-time per-formance, and uniqueness in making port selections. Such choices were made while also considering the freight offer and its side conditions.
4 Conclusions
The difference between customer-oriented thinking and product-oriented thinking in port selection rests upon differing priorities in the decision-making process. Under customer-oriented thinking, key aspects were fo-cused on customers’ wishes. Analysis of port selection
indicators in customers’ decision-making processes re-vealed that highly desired ports accorded with
cus-tomers’ requirements. Therefore, the rationality of
decision-making can be improved. In this research, scheme evaluation was based on indicator weights set by questionnaire responses, as well as the AHP method. “Freight Competitiveness” and “Service Capability” of container carriers were found to be key indicators. Em-phasis can be placed on “Service route quality,” “Freight rate”and“Side condition”as key secondary indicators.
Product-oriented thinking has been very common in the industry; however, changes are necessary. Given the trend of upsizing large-scale container vessels, the rela-tionship between supply and demand has reversed, and the situation of excess capacity, or partial excess, will continue in the future. The traditional evaluation system depends on customers’ acceptance. Notably, due to dif-fering priorities between customers and container car-riers, port selection is sometimes inconsistent.
Perspectives differ between customer-oriented and product-oriented evaluation systems. Yet, this does not mean that the two methods should be completely sepa-rated. On the contrary, a comparative analysis should be implemented using both evaluation systems. Doing so could greatly improve the rationality of port selection.
5 Contribution
This paper proposes a new research idea regarding port selection, that is, replacing “product-oriented” thinking with “customer-oriented” thinking. It also examines the relevant indicator system and the underlying logic, be-yond that of customer port selection, changing the pos-sible deviation caused by traditional optimization.
Based on the questionnaire survey and interviews with active customers of container carriers, the paper covers
Table 13The judgment matrix under“Cooperation and Relationship”. (Source: Authors)
C11 C12 C13
C11 1 1 2
C12 1 1 2
C13 1/2 1/2 1
Table 14Weight of secondary indicator under“Cooperation and Relationship”. (Source: Authors)
Secondary Indicator Weights
C11 0.40
C12 0.40
C13 0.20
Table 15The judgment matrix under“Others”. (Source: Authors)
C14 C15 C16
C14 1 2 2
C15 1/2 1 1
C16 1/2 1 1
Table 16Weights of secondary indicators under“Others”. (Source: Authors)
Secondary Indicator Weights
C14 0.50
C15 0.25
the main customer categories, including large-scale cargo owners, small- and medium-sized cargo owners, a global NVOCC, small- and medium-sized freight-forwarding companies, and so on, providing a new way of thinking and direction for further research on port selection so as to better meet customers’service requirements.
Acknowledgements
I would like to thank the reviewers for their constructive comments and editorial suggestions.
Corresponding author details
Yisong Lin, PhD of Shanghai Maritime University, over 16 years of working experience in COSCO group including over 10 years of management experience in Asia-Pacific Trade Division, Transpacific Division, Europe Trade Division. Research covers service route design and management, yield management, vendor management, pricing and allocation management etc. Three Main Publications:
(1) Yisong Lin(2019) The Practice of Container Liner Transportation and Management. China: China Customs Press.
(2) Yisong Lin(2008) The Practice of International Container Liner transportation. China: China Customs Press.
(3) Yisong Lin(2013) The Baltic Feeder line Layout Planning and Decision Making Research of C Company. Shanghai Jiaotong University, Shanghai, China.
Authors’contributions
XF Wang analyzed and interpreted the data. YS Lin conceived and designed the analytic framework, and was a major contributor in writing the manuscript. All authors read and approved the final manuscript.
Funding
Funding information is not applicable.
Availability of data and materials
The datasets used during the current study are available from the corresponding author on reasonable request.
Competing interests
The authors declare that they have no competing interests.
Received: 1 April 2019 Accepted: 28 October 2019
References
1. Taih-Cherng, L., Helen, T., & Anthony, B. (2003). Transhipment port selection and decision-making behavior: Analysing the Taiwanese case.International Journal of Logistics Research and Applications, 6, 229–244.https://doi.org/10. 1080/13675560310001626990.
2. Guy, E., & Urli, B. (2006). Port selection and multicriteria analysis: An application to the Montreal-New York alternative.Marit Econ Logistics, 8, 169–186.https://doi.org/10.1057/palgrave.mel.9100152.
3. Chang, Y. T., Lee, S. Y., & Tongzon, J. L. (2008). Port selection factors by shipping lines: Different perspectives between trunk liners and feeder service providers.Marine Policy, 32, 877–885.https://doi.org/10.1016/j. marpol.2008.01.003.
4. Nguyen, K. T. (2011). Studying port selection on liner routes: An approach from logistics perspective.Research in Transportation Economics, 32, 39–53. Table 17Weights of level indicators and secondary indicators
by AHP. (Source: Authors)
Level Indicators Weights Secondary Indicators Weights Comprehensive weight
B1 0.385 C1 0.38 0.14
C2 0.34 0.13
C3 0.19 0.07
C4 0.05 0.02
C5 0.05 0.02
B2 0.3742 C6 0.46 0.17
C7 0.22 0.08
C8 0.21 0.08
C9 0.05 0.02
C10 0.05 0.02
B3 0.1978 C11 0.40 0.08
C12 0.40 0.08
C13 0.20 0.04
B4 0.043 C14 0.50 0.02
C15 0.25 0.01
C16 0.25 0.01
Table 18Standardized data for ports of Wilhelmshaven, Hamburg, Bremen, and Bremerhaven. (Source: Authors)
Wilhelmshaven Hamburg Bremen Bremerhaven
Freight Rate(C1) 0.07 0 0 0
Side Condition(C2) 1 0.50 0.64 0.64
Volume Incentive(C3)
1 1 1 1
Freight Stability(C4) 1 0.90 0.90 0.90
Quotation Efficiency(C5)
1 1 1 1
Service Route Quality(C6)
0.70 1 0.80 0.90
Cargo Tracing(C7) 1 1 1 1
Transshipment Efficiency(C8)
0.80 1 0.90 0.90
Emergency Response(C9)
0.95 1 0.95 1
IT System(C10) 1 1 1 1
Global
Cooperation(C11)
1 1 1 1
Cooperative History (C12)
0.89 1 0.89 1
Business Claims(C13)
0.90 1 1 1
Strategic Compatibility(C14)
1 1 1 1
Company Reputation(C15)
1 1 1 1
Financial Situation(C16)
1 1 1 1
Table 19Final score for ports of Wilhelmshaven, Hamburg, Bremen, and Bremerhaven under AHP. (Source: Authors)
Comprehensive scores
Wilhelmshaven 0.78
Hamburg 0.79
Bremen 0.75
5. Kadaifci, C ,Asan, U ,Serdarasan, S , Arican, U . (2019). A new rule-based integrated decision making approach to container transshipment terminal selection. Maritime Policy & Management,(46)2:237–256.DOI:https://doi.org/ 10.1080/03088839.2018.1489149.
6. Nazemzadeh, M., & Vanelslander, T. (2015). The container transport system: Selection criteria and business attractiveness for north-European ports.
Maritime Economics & Logistics, 17, 221.https://doi.org/10.1057/mel.2015.1. 7. Bart, W. W., Anthony Van Der, H., & Theo, E. N. (2008). Port and terminal
selection by deep-sea container operators.Maritime Policy & Management, 35, 517–534.https://doi.org/10.1080/03088830802469329.
8. Tand, L. C., Low, J. M. W., & Lam, S. W. (2011). Understanding port choice behavior-a network perspective.Networks Spatial Economics, 11, 65–82.
https://doi.org/10.1007/s11067-008-9081-8.
9. Veldman, S, Garcia-Alonso, L, Vallejo-Pinto, JA. (2013). A port choice model with logit models: A case study for the Spanish container trade. International Journal of Shipping and Transport Logistics,(5):373–389.DOI:
https://doi.org/10.1504/IJSTL.2013.055277.
10. Onut, S., Tuzkaya, U. R., & Tourn, E. (2011). Selecting container port via a fuzzy ANP-based approach: A case study in the Marmara region, Turkey.
Transport Policy, 18, 181–193.https://doi.org/10.1016/j.tranpol.2010.08.001. 11. Chou, C. C. (2010). AHP model for the container port choice in the
multiple-ports region.Journal of Marine Science and Technology, 18, 221–232. 12. Button, K., Chin, A., & Kramberger, T. (2015). Incorporating subjective
elements into liners' seaport choice assessments.Transport Policy, 44, 125– 133.https://doi.org/10.1016/j.tranpol.2015.07.006.
13. Yeo, G. T., Ng, A. K. Y., Lee, P. T. W., & Yang, Z. L. (2014). Modelling port choice in an uncertain environment.Maritime Policy & Management, 41, 251–267.https://doi.org/10.1080/03088839.2013.839515.
14. Notteboom, T. E., Parola, F., Satta, G., & Pallis, A. A. (2017). The relationship between port choice and terminal involvement of alliance members in container shipping.Journal of Transport Geography, 64, 158–173.https://doi. org/10.1016/j.jtrangeo.2017.09.002.
15. Tongzon, JL. (2009). Port choice and freight forwarders. Transportation Research Part E-Logistics and Transportation Review,(45):186–195.DOI:
https://doi.org/10.1016/j.tre.2008.02.004.
16. Kashiha, M, Thill, JC, Depken, C A. (2016). Shipping route choice across geographies: Coastal vs. landlocked countries. Transportation Research Part E,(91):1–14.DOI:https://doi.org/10.1016/j.tre.2016.03.012
17. Balci, G., Cetin, I. B., & Esmer, S. (2018). An evaluation of competition and selection criteria between dry bulk terminals in Izmir.Journal of Transport Geography, 69, 294–304.https://doi.org/10.1016/j.jtrangeo.2018.05.011.
Publisher’s Note