O R I G I N A L A R T I C L E
Open Access
The role of workplace accommodations in
the employment of people with disabilities
Priyanka Anand
1*and Purvi Sevak
2* Correspondence:
[email protected] 1Department of Health
Administration and Policy, George Mason University, 4400 University Drive, MS1J3, Fairfax, VA 22030, USA Full list of author information is available at the end of the article
Abstract
We explore the role of workplace accommodations in reducing employment barriers and improving the employment of people with disabilities. We do so using data from the 2015 Survey of Disability and Employment on people with disabilities who applied for vocational rehabilitation services in three states. The results show that at least one third of nonworking people with disabilities reported employment barriers that could be addressed by workplace accommodations, such as lack of transportation and an inaccessible workplace. We also find that receiving certain types of workplace accommodations, such as help with transportation, flexible work schedules, or a personal care attendant, is positively correlated with being employed at the time of the survey. Finally, people who are in poor health or have physical disabilities were more likely to perceive workplace inaccessibility as a barrier but less likely to have received accommodations in their current or most recent job. This suggests that people with these characteristics may be good candidates to target for greater access to workplace accommodations.
Keywords:Employment, Disability, Labor force participation, Workplace accommodations
JEL Classification:I1, J2, J32
1 Introduction
Workplace accommodations, such as flexible work schedules or modified job duties, have the potential to play a major role in the ability of many people with disabilities to participate in the workforce. The Americans with Disabilities Act (ADA) mandates that employers provide reasonable accommodations to people with disabilities, yet only slightly more than one quarter of newly disabled older workers report receiving an employer accommodation that would help them stay at work after the onset of their disability (Hill et al. 2016). In this paper, we use data from a recent survey of vocational rehabilitation (VR) agency applicants (2015 Survey of Disability and Employment or SDE) to (1) establish that people with disabilities who are not working often report employment barriers that could be addressed by accommodations, such as lack of transportation and an inaccessible workplace, (2) explore the role of workplace accom-modations in helping increase employment for people with disabilities, and (3) better understand the characteristics of those who may benefit from greater availability of ac-commodations. The SDE provides a unique opportunity to examine these relationships
© The Author(s). 2017Open AccessThis article is distributed under the terms of the Creative Commons Attribution 4.0 International
because the data include detailed information on employment barriers faced by people with disabilities, the availability of workplace accommodations in the current or most recent job, and extensive individual characteristics about the survey respondents.
Our analysis involves three main components. First, we provide descriptive evidence that nonworking people with disabilities who have applied for VR services often report employ-ment barriers that can be addressed by workplace accommodations, such as lack of trans-portation or an inaccessible workplace. Next, we use a regression analysis to examine the relationship between workplace accommodations in the current or most recent job and the current employment status of people with disabilities in order to show that the provision of workplace accommodations may help increase employment. Finally, we use descriptive statistics to examine the individual characteristics of people with disabilities who do not receive workplace accommodations and of those who face barriers that could be addressed by workplace accommodations in order to shed light on the population of people who may benefit from making workplace accommodations more widely available.
The results of our analyses show that at least one third of nonworking people with disabilities report employment barriers that could be addressed by workplace accom-modations, such as an inaccessible workplace and lack of transportation. The receipt of workplace accommodations, such as help with transportation, a flexible work schedule, or a personal care attendant, at the current or most recent job is positively correlated with being employed at the time of the survey, which suggests that providing these ac-commodations may be effective in helping people with disabilities work. Finally, those who are in poor health or have a physical disability only are overrepresented among those who do not receive workplace accommodations in their current or most recent job; furthermore, those who are in poor health, have lower levels of educational attain-ment, or have physical disabilities are more likely to perceive lack of accessibility as a barrier. These findings suggest that individuals with these characteristics may be good candidates to target for expanding the availability of workplace accommodations.
Because the SDE sample consists of people with disabilities who applied for VR services in only three states, these findings cannot be generalized to people with disabilities nation-ally; nonetheless, this sample provides valuable insight into a group of people who have demonstrated an interest and ability to work by applying for VR. This is a particularly valuable group to examine because they are more likely to work if the employment bar-riers they report are identified and addressed. Understanding the characteristics of people with disabilities who do not currently have access to workplace accommodations may help VR agencies identify those who could potentially benefit from this type of assistance.
2 Background
employment differences across demographic groups mirror well-documented disparities in the general population, which may, in turn, reflect long-term trends in social norms, educational and economic opportunities, and discrimination (Sevak et al. 2015).
The relationship between health, disability, and employment is not just a function of individual characteristics but also a function of features of the workplace and physical environment. In particular, growing evidence suggests that workplace factors affect em-ployment outcomes for people with disabilities (Kristman et al. 2016). Research has shown that receipt of workplace accommodations is associated with better employment outcomes (Burkhauser et al. 1995; Chow 2012; Cook et al. 2015). Among VR applicants with psychiatric disabilities, accommodations such as flexible schedules and modified work duties were positively correlated with continued employment (Sevak and Khan 2017). Among workers nearing retirement age with a new onset of disability, receipt of accommodations is associated with delayed labor force exit over a 2-year period, though not over a longer period (Hill et al. 2016).
Nonetheless, receipt of accommodations is not consistent among people with disabil-ities (Allaire et al. 2003; Balser 2007; Burkhauser and Daly 1996; Campolieti 2004) despite the mandates of the ADA. Among people with disabilities nearing retirement age, slightly more than one-quarter report receiving employer-provided accommoda-tions that helped them stay at work, and the most predictive factors of receiving work-place accommodations appear to be such employee characteristics as education, race, and having assertive personality traits (Hill et al. 2016). Recent work by Clay and Alston (2016) finds racial differences in the receipt of assistive technology, which could be a factor in employment differences among people with disabilities.
In order to better understand why some people who could benefit from workplace accommodations do not receive them, it is useful to consider the process by which workplace accommodations are provided to employees. One path is that an employer observes that a worker has a disability and offers accommodations; workers who would benefit from the accommodations would accept while those who would not benefit from the accommodations would decline. In this framework, workers with unobserv-able disabilities who need accommodations or those whose employers do not offer accommodations would not receive them and likely leave their job due to an inaccess-ible workplace. A second path of receiving accommodations is that the worker asks the employer for accommodations and the employer complies. In this case, only workers who need accommodations in order to stay in the workplace would request them and those that do not need accommodations will not. However, in this framework, workers who need but do not ask for accommodations or those whose employers do not com-ply with their request will not receive accommodations and likely leave their job due to the workplace no being accessible. In both of these scenarios, increasing workplace ac-commodations (either by encouraging workers to ask for acac-commodations, encouraging employers provide accommodations, or providing accommodations directly to workers through programs such as VR) would increase employment for people with disabilities.
that range from allowing a flexible schedule to providing a personal attendant or transpor-tation assistance. Third, we use a sample that spans working-age individuals with a range of disabilities who have demonstrated a particular interest in employment by applying for VR services. VR agencies, which are funded by a match of state and federal funds from the Rehabilitation Services Administration in the US Department of Education, are re-sponsible for helping people with significant disabilities achieve their employment goals. Application to VR is voluntary, and even though the services that VR agencies can provide are dictated by the Rehabilitation Act of 1973 and its amendments, each VR client and his or her counselor develop an individualized plan for employment that spells out the ser-vices needed for that client to meet his or her employment goal.
The SDE sample of people with disabilities who have demonstrated an interest in work-ing is a particularly valuable group to examine because they are more likely to become employed if the barriers they report are addressed. Our finding that many nonworking people with disabilities report employment barriers that can be addressed by workplace accommodations suggests that expanding the availability of accommodations may be a promising method of increasing the employment of people with disabilities. Understand-ing the characteristics of the individuals who report barriers that could be overcome through accommodations and those who do not currently receive them may help VR agencies identify those who could most benefit from receiving accommodations.
3 Data
We base the analyses in this paper on data from the SDE, which contains information on the employment history and workplace and social supports for people who applied for VR services between August 15, 2014, and December 15, 2014. The survey was administered by computer-assisted telephone interviews between November 2014 and May 2015 to working-age VR applicants (25 to 60 years old) in three states (Mississippi, New Jersey, and Ohio). Because participation in the survey was voluntary, estimates from the survey could be biased if responding sample members differ from the state’s VR population as a whole. The survey’s response rate of 60% meets the 60% minimum standard of many jour-nals,1 and a nonresponse bias analysis conducted by survey staff illustrated that the weighted final sample did not differ from the VR applicant population along key covari-ates. We limited our analyses to individuals with nonmissing data for all the variables in the regression analyses (including questions about workplace accommodations, which are asked only of those ever employed), for a final sample size of 2282.2We adjusted all ana-lyses in the paper using sampling weights that account for differential nonresponse by characteristics such as age, gender, race, and type of disability.
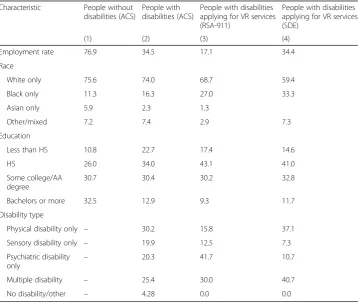
In Table 1, we compare the descriptive statistics of the weighted SDE sample to the national population of individuals who exit from VR agencies (as measured by the 2014 Re-habilitation Services Administration case service reports known as the RSA-911) and the national population of individuals with and without disabilities in the ACS. We find that the sample of people with disabilities in the SDE is similar in some respects to the national population of people with disabilities and the national VR population, but there are also some differences. For example, the employment rate is 34% among SDE respondents and the national population of people with disabilities, but only 17% for the national VR popu-lation. In contrast, the share of people with less than a high school degree is similar for SDE respondents and the national VR population (15 and 17%, respectively), but much lar-ger in the national population of people with disabilities (23%). The SDE has a larlar-ger share of individuals with multiple disabilities and smaller shares of individuals with sensory or psychiatric disabilities alone than the national population of people with disabilities or the VR population; however, this may primarily reflect differences in how this information was collected across sources. The SDE asked respondents an open-ended question about their health condition or disability and placed no limits on how many conditions were recorded. The RSA-911 reports up to two impairments (the primary and secondary impairments as coded by the VR counselor who screened the applicant), and the ACS has a series of six disability questions that a number of studies have found to underreport disability. In light of these differences, it is difficult to generalize the findings for the SDE sample to the na-tional population of people with disabilities or people who apply for VR services.
Table 1Individual characteristics of people with and without disabilities
Characteristic People without disabilities (ACS)
People with disabilities (ACS)
People with disabilities applying for VR services (RSA-911)
People with disabilities applying for VR services (SDE)
(1) (2) (3) (4)
Employment rate 76.9 34.5 17.1 34.4
Race
White only 75.6 74.0 68.7 59.4
Black only 11.3 16.3 27.0 33.3
Asian only 5.9 2.3 1.3
Other/mixed 7.2 7.4 2.9 7.3
Education
Less than HS 10.8 22.7 17.4 14.6
HS 26.0 34.0 43.1 41.0
Some college/AA degree
30.7 30.4 30.2 32.8
Bachelors or more 32.5 12.9 9.3 11.7
Disability type
Physical disability only – 30.2 15.8 37.1
Sensory disability only – 19.9 12.5 7.3
Psychiatric disability
only –
20.3 41.7 10.7
Multiple disability – 25.4 30.0 40.7
No disability/other – 4.28 0.0 0.0
Nonetheless, the SDE sample provides useful insight into a large group of people with dis-abilities who live in three large states who have a demonstrated an interest in employment.
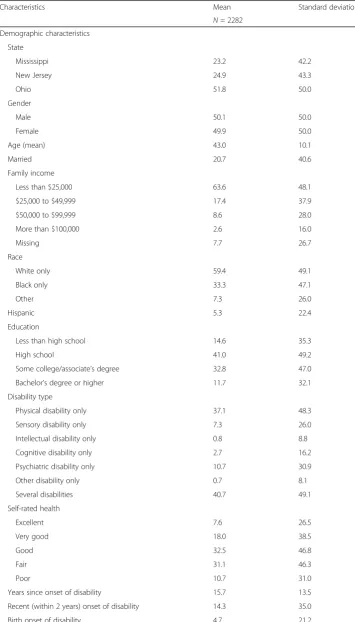
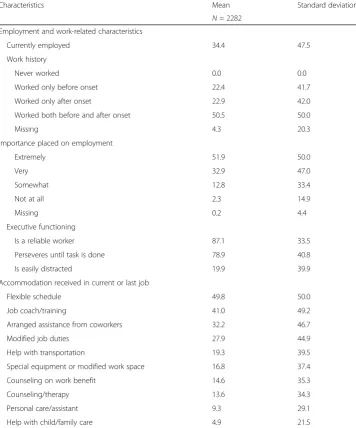
In Table 2, we provide additional characteristics of the SDE sample in terms of demographic characteristics, employment history and characteristics, and the work-place accommodations received in a current or most recent job.
3.1 Demographic characteristics
About half of the survey sample individuals reside in Ohio; the other half are almost equally distributed between Mississippi and New Jersey. The sample is evenly split by gender; the average age of respondents is 43, and 64% are low income, with an annual family income below $25,000. Approximately one third of the sample are black, 7% are in the “other” category (which includes Asians, Pacific Islanders, Native Americans, and multiple-race categories), and the remainder are white. Fifteen percent of the sam-ple individuals have less than a high school education, 41% have a high school diploma only, 33% have some college, and 12% have a bachelor’s degree or higher. We conduct some of our analyses by disability subgroup, given that Houtenville et al. (2014) docu-mented large employment differences by disability type. Smart (2008) suggests the fol-lowing four categories of disability that are based on symptoms and manifestations, not cause or source: physical, intellectual, cognitive, and psychiatric. We separated out sen-sory disabilities from physical disabilities because those who report sensen-sory disabilities tend to have the highest employment rates (Houtenville et al. 2014). Based on these five categories (plus another category for having multiple disabilities), 41% of the sample have multiple disabilities, 37% have a physical disability only, 11% have a psychiatric disability only, and 7% have a sensory disability only. The remaining disability types (in-tellectual disability only, cognitive disability only, and other disability types) account for less than 3% of the sample. Only 5% of the sample has had their disability since birth and 14% had their disability onset in the past 2 years; the average number of years since disability onset is 16. We focus on just those with recent disability onset for some of our analyses because their employment outcomes may benefit more from workplace ac-commodations than those who have had their disability for many years.
3.2 Employment history and characteristics
Although our analysis sample is limited to people with disabilities with a work history and an interest in employment, there is variation in the current employment status of the sample, with 34% currently working. Whereas only 22% of the sample worked only before the onset of their disability, another 51% worked both before and after the onset of their disability and 23% worked only after the onset of their disability.3As ex-pected, the population of interest places a high value on working. When asked how im-portant it is to them to work, 52% of the sample responded extremely imim-portant; 2% responded not at all important. Most people in the sample perceive themselves as dem-onstrating high executive function: 87% say they are reliable workers, 79% say they per-severe until they complete a job, and only 20% say they have trouble focusing on work.
3.3 Workplace accommodations
Table 2Descriptive statistics of SDE sample
Characteristics Mean Standard deviation
N= 2282
Demographic characteristics
State
Mississippi 23.2 42.2
New Jersey 24.9 43.3
Ohio 51.8 50.0
Gender
Male 50.1 50.0
Female 49.9 50.0
Age (mean) 43.0 10.1
Married 20.7 40.6
Family income
Less than $25,000 63.6 48.1
$25,000 to $49,999 17.4 37.9
$50,000 to $99,999 8.6 28.0
More than $100,000 2.6 16.0
Missing 7.7 26.7
Race
White only 59.4 49.1
Black only 33.3 47.1
Other 7.3 26.0
Hispanic 5.3 22.4
Education
Less than high school 14.6 35.3
High school 41.0 49.2
Some college/associate’s degree 32.8 47.0
Bachelor’s degree or higher 11.7 32.1
Disability type
Physical disability only 37.1 48.3
Sensory disability only 7.3 26.0
Intellectual disability only 0.8 8.8
Cognitive disability only 2.7 16.2
Psychiatric disability only 10.7 30.9
Other disability only 0.7 8.1
Several disabilities 40.7 49.1
Self-rated health
Excellent 7.6 26.5
Very good 18.0 38.5
Good 32.5 46.8
Fair 31.1 46.3
Poor 10.7 31.0
Years since onset of disability 15.7 13.5
Recent (within 2 years) onset of disability 14.3 35.0
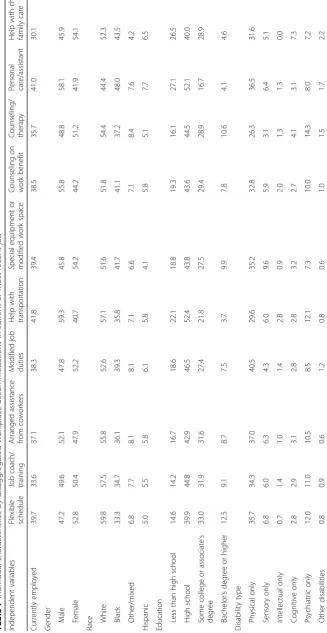
Security Administration’s NBS. Respondents were told to report“yes,” “no,”and“not ap-plicable” for each of the accommodations separately. Because there is no way to know with certainty whether a respondent who did not think he or she needed a particular ac-commodation selected “not applicable” or “no,” we combine these two responses into “no”and remain agnostic about whether they did not need or needed but did not receive the accommodation. The most common accommodations were a flexible schedule (50%), a job coach or training (41%), arranged assistance from co-workers (32%), and modified job duties (28%). The least common accommodations were a personal care attendant or personal assistant (9%) and help with child or family care (5%).
4 Empirical methods
As noted, our analysis involves three main components. First, we examine the employ-ment barriers faced by nonworking people with disabilities to determine whether the
Table 2Descriptive statistics of SDE sample(Continued)
Characteristics Mean Standard deviation
N= 2282
Employment and work-related characteristics
Currently employed 34.4 47.5
Work history
Never worked 0.0 0.0
Worked only before onset 22.4 41.7
Worked only after onset 22.9 42.0
Worked both before and after onset 50.5 50.0
Missing 4.3 20.3
Importance placed on employment
Extremely 51.9 50.0
Very 32.9 47.0
Somewhat 12.8 33.4
Not at all 2.3 14.9
Missing 0.2 4.4
Executive functioning
Is a reliable worker 87.1 33.5
Perseveres until task is done 78.9 40.8
Is easily distracted 19.9 39.9
Accommodation received in current or last job
Flexible schedule 49.8 50.0
Job coach/training 41.0 49.2
Arranged assistance from coworkers 32.2 46.7
Modified job duties 27.9 44.9
Help with transportation 19.3 39.5
Special equipment or modified work space 16.8 37.4
Counseling on work benefit 14.6 35.3
Counseling/therapy 13.6 34.3
Personal care/assistant 9.3 29.1
Help with child/family care 4.9 21.5
employment barriers among those who are not employed could be addressed by work-place accommodations. Next, we conduct a regression analysis to examine the relation-ship between the receipt of workplace accommodations and employment status at the time of the survey. Finally, we explore observable differences in individual characteris-tics among people with disabilities who receive and do not receive workplace accom-modations, as well as the characteristics of those who report specific employment barriers that could be addressed by workplace accommodations.
The first component of the analysis presents the percentage of nonworking people with disabilities who perceived a variety of factors as employment barriers—for the overall sample, by disability subgroup, and for those whose disability onset was within the last 2 years. The survey presented to respondents a list of individual, work-related, and societal barriers that people sometimes list for not working and asked whether each barrier per-tained to him or her. The individual barriers include a physical or mental condition that prevents the respondent from working, lack of skills, no reliable transportation, waiting to complete school or a training program, family or friends do not think that the respondent can work, and the respondent’s responsibility for caring for someone else. The work-related barriers include the inability to find a job, earlier attempts at work that proved discouraging, employers’failure to provide a chance to work, and workplaces that are not accessible to people with their condition. The societal barrier includes the possible loss of benefits (such as workers’compensation, Temporary Assistance to Needy Families, Me-dicaid). We explore whether the commonly perceived barriers to gaining employment are those that could be addressed through workplace accommodations, such as an inaccess-ible workplace or lack of transportation. Given that all survey respondents demonstrated an interest in working by applying for VR services, respondents who selected these as bar-riers have a greater likelihood of working if provided accommodations.
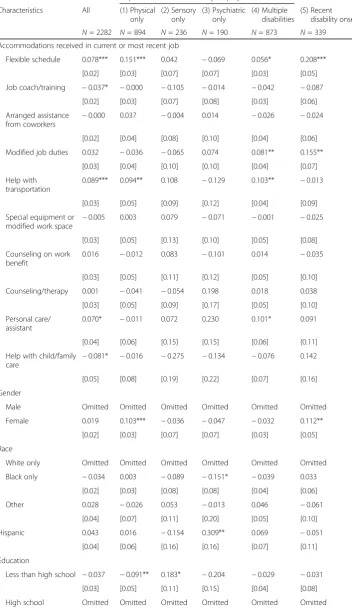
For the second component of the analysis, we explore whether workplace accom-modations is positively correlated with employment and therefore a potential solu-tion to some of the commonly reported employment barriers. To do this, we estimate linear probability models predicting current employment (E) for the entire sample, by disability subgroup, and for those who had recent disability onset. The independent variables are the individual characteristics (Xj) and receipt of work-place accommodations in the person’s current or most recent job (Yk):
Ei¼α0iþ XJ
j¼1
βjiXjiþ XK
k¼1
δkiYki
probability of being employed at the time of the survey. We are particularly interested in the relationship between the receipt of different types of workplace accommodation and employment.
For the third component of the analysis, we compare the individual characteristics of people with disabilities who receive workplace accommodations at their current or most recent job with the characteristics of those who do not receive them. We also compare the individual characteristics of nonworking individuals who report specific employment barriers that can be addressed by workplace accommodations (inaccessible workplace or lack of transportation) to the characteristics of nonworking individuals with disabilities who did not report these barriers. These comparisons will provide insight into the characteristics of workers who are most likely to benefit from expanded access to workplace accommodations given that they did not receive them at their most recent job or that they cited barriers that can be addressed by accommodations. Due to data limitations, we are unable to identify whether those without workplace accommo-dations do not receive them because they do not need them. However, this initial ana-lysis gives a baseline measure of which people with disabilities might be possible candidates to target for the provision of workplace accommodations.
5 Results
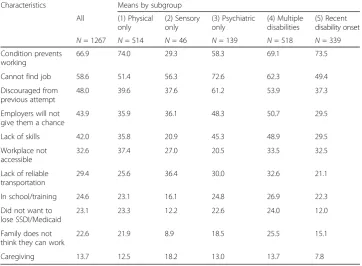
We begin by presenting the rates of reported employment barriers faced by nonworking people with disabilities—overall, by disability subgroup, and for those with recent disabil-ity onset (Table 3). This analysis provides evidence on the extent to which people with dis-abilities reported employment barriers that could be addressed by expanding the availability of workplace accommodations. The most commonly reported employment barrier is that the person’s condition prevents him or her from working, with about two thirds of nonworking people with disabilities reporting their condition as an employment barrier. There is variation by disability subgroup, ranging from 29% of those with a sen-sory disability only to 74% of those with a physical disability only. Other frequently men-tioned barriers are inability to find a job (59%), being discouraged from previous attempts at working (48%), employers will not give them a chance (44%), and lack of skills (42%).
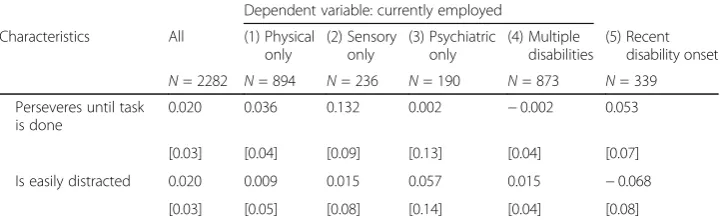
Next, we present the results of a regression analysis of the relationship between current employment and individual characteristics and the receipt of workplace accom-modations at the current or most recent job (Table 4). Many of the coefficients reflect the expected relationship between individual characteristics and being currently employed; individuals who have a bachelor’s degree or higher are more likely to be cur-rently employed than those with a high school degree, and people who are in poor health are less likely to be employed than those who are in good health. These relation-ships generally hold across disability subgroups. The workplace accommodations that are positively correlated with current employment are having a flexible schedule, re-ceiving help with transportation, and having a personal care attendant or personal assistant. The magnitude of these relationships ranged from 7 to 9 percentage points. Having a flexible schedule and help with transportation were statistically significant for both those with a physical disability only and those with several dis-abilities; having a personal care attendant or personal assistant was statistically sig-nificant only for those with multiple disabilities. No statistically sigsig-nificant relationship was seen for those with sensory or psychiatric disabilities only, but this may be due to the smaller sample sizes for these disability subgroups. Those with a disability onset within the past 2 years reported higher employment if they re-ceived a flexible schedule or modified job duties.
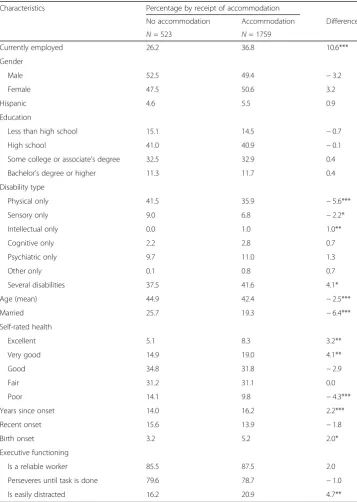
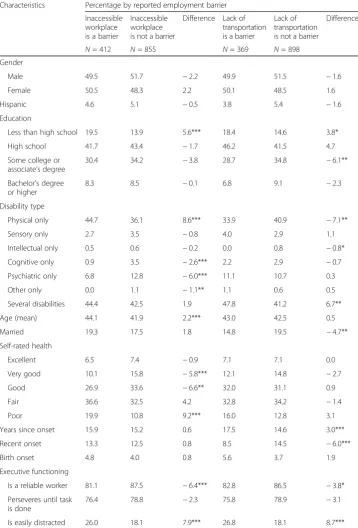
Finally, to examine potential inequities in need or receipt of accommodations, we compare the individual characteristics of those who receive workplace accommodation and those who do not receive workplace accommodations (Table 5) and those who re-port specific employment barriers that can be addressed by workplace accommodations and those who do not report these barriers (Table 6).
Table 3Reported employment barriers for those not currently working, overall, and by disability subgroup
Characteristics Means by subgroup
All (1) Physical only
(2) Sensory only
(3) Psychiatric only
(4) Multiple disabilities
(5) Recent disability onset
N= 1267 N= 514 N= 46 N= 139 N= 518 N= 339
Condition prevents working
66.9 74.0 29.3 58.3 69.1 73.5
Cannot find job 58.6 51.4 56.3 72.6 62.3 49.4
Discouraged from previous attempt
48.0 39.6 37.6 61.2 53.9 37.3
Employers will not give them a chance
43.9 35.9 36.1 48.3 50.7 29.5
Lack of skills 42.0 35.8 20.9 45.3 48.9 29.5
Workplace not accessible
32.6 37.4 27.0 20.5 33.5 32.5
Lack of reliable transportation
29.4 25.6 36.4 30.0 32.6 21.1
In school/training 24.6 23.1 16.1 24.8 26.9 22.3
Did not want to lose SSDI/Medicaid
23.1 23.3 12.2 22.6 24.0 12.0
Family does not think they can work
22.6 21.9 8.9 18.5 25.5 15.1
Caregiving 13.7 12.5 18.2 13.0 13.7 7.8
Table 4Regression results of employment on workplace accommodations, overall, and by disability subgroup
Dependent variable: currently employed
Characteristics All (1) Physical only
(2) Sensory only
(3) Psychiatric only
(4) Multiple disabilities
(5) Recent disability onset
N= 2282 N= 894 N= 236 N= 190 N= 873 N= 339
Accommodations received in current or most recent job
Flexible schedule 0.078*** 0.151*** 0.042 −0.069 0.056* 0.208***
[0.02] [0.03] [0.07] [0.07] [0.03] [0.05]
Job coach/training −0.037* −0.000 −0.105 −0.014 −0.042 −0.087
[0.02] [0.03] [0.07] [0.08] [0.03] [0.06]
Arranged assistance from coworkers
−0.000 0.037 −0.004 0.014 −0.026 −0.024
[0.02] [0.04] [0.08] [0.10] [0.04] [0.06]
Modified job duties 0.032 −0.036 −0.065 0.074 0.081** 0.155**
[0.03] [0.04] [0.10] [0.10] [0.04] [0.07]
Help with transportation
0.089*** 0.094** 0.108 −0.129 0.103** −0.013
[0.03] [0.05] [0.09] [0.12] [0.04] [0.09]
Special equipment or modified work space
−0.005 0.003 0.079 −0.071 −0.001 −0.025
[0.03] [0.05] [0.13] [0.10] [0.05] [0.08]
Counseling on work benefit
0.016 −0.012 0.083 −0.101 0.014 −0.035
[0.03] [0.05] [0.11] [0.12] [0.05] [0.10]
Counseling/therapy 0.001 −0.041 −0.054 0.198 0.018 0.038
[0.03] [0.05] [0.09] [0.17] [0.05] [0.10]
Personal care/ assistant
0.070* −0.011 0.072 0.230 0.101* 0.091
[0.04] [0.06] [0.15] [0.15] [0.06] [0.11]
Help with child/family
care −
0.081* −0.016 −0.275 −0.134 −0.076 0.142
[0.05] [0.08] [0.19] [0.22] [0.07] [0.16]
Gender
Male Omitted Omitted Omitted Omitted Omitted Omitted
Female 0.019 0.103*** −0.036 −0.047 −0.032 0.112**
[0.02] [0.03] [0.07] [0.07] [0.03] [0.05]
Race
White only Omitted Omitted Omitted Omitted Omitted Omitted
Black only −0.034 0.003 −0.089 −0.151* −0.039 0.033
[0.02] [0.03] [0.08] [0.08] [0.04] [0.06]
Other 0.028 −0.026 0.053 −0.013 0.046 −0.061
[0.04] [0.07] [0.11] [0.20] [0.05] [0.10]
Hispanic 0.043 0.016 −0.154 0.309** 0.069 −0.051
[0.04] [0.06] [0.16] [0.16] [0.07] [0.11]
Education
Less than high school −0.037 −0.091** 0.183* −0.204 −0.029 −0.031
[0.03] [0.05] [0.11] [0.15] [0.04] [0.08]
Table 4Regression results of employment on workplace accommodations, overall, and by disability subgroup(Continued)
Dependent variable: currently employed
Characteristics All (1) Physical only
(2) Sensory only
(3) Psychiatric only
(4) Multiple disabilities
(5) Recent disability onset
N= 2282 N= 894 N= 236 N= 190 N= 873 N= 339
Some college or associate’s degree
0.005 −0.030 0.054 0.041 0.005 −0.045
[0.02] [0.04] [0.07] [0.09] [0.04] [0.06]
Bachelor’s degree or higher
0.159*** 0.124** 0.211** 0.148 0.190*** 0.044
[0.03] [0.06] [0.10] [0.09] [0.05] [0.08]
Disability type
Physical only Omitted Omitted
Sensory only 0.295*** 0.390***
[0.04] [0.10]
Intellectual only 0.186*
[0.11]
Cognitive only −0.024 −0.078
[0.06] [0.21]
Psychiatric only 0.015 0.285***
[0.03] [0.10]
Other only 0.055 0.606*
[0.12] [0.32]
Several disabilities 0.005 −0.018
[0.02] [0.07]
Age (mean) 0.000 0.001 −0.002 0.003 −0.001 0.003
[0.00] [0.00] [0.00] [0.00] [0.00] [0.00]
Married 0.084*** 0.126*** −0.180* 0.121 0.064 0.158***
[0.02] [0.04] [0.11] [0.07] [0.04] [0.06]
Self-rated health
Excellent 0.034 0.087 −0.093 0.006 0.022 0.002
[0.04] [0.07] [0.11] [0.11] [0.07] [0.10]
Very good 0.069** 0.123*** 0.039 −0.045 0.065 0.019
[0.03] [0.05] [0.08] [0.08] [0.05] [0.07]
Good Omitted Omitted Omitted Omitted Omitted Omitted
Fair −0.063** −0.043 −0.057 0.154 −0.076** −0.041
[0.02] [0.04] [0.10] [0.15] [0.04] [0.07]
Poor −
0.183*** −
0.143*** −0.281 −0.800** −0.167*** −0.278***
[0.03] [0.05] [0.22] [0.37] [0.05] [0.09]
Years since onset −0.001 −0.002 −0.001 −0.003 0.002 −0.036
[0.00] [0.00] [0.00] [0.00] [0.00] [0.05]
Birth onset 0.056 0.222** −0.150 −0.143 0.067
[0.05] [0.09] [0.37] [0.13] [0.07]
Executive functioning
Is a reliable worker 0.058* 0.012 0.190** 0.260 0.047 0.094
We find that only 26% of those who did not receive accommodations at their current or most recent job are currently employed compared to 37% of those who did receive accommodations. Furthermore, those who did not receive accommodations are more likely to be in poor health and have a physical disability compared to those who did re-ceive accommodations. Finally, 3.2% of those who did not rere-ceive workplace accommo-dations have had their disability since birth compared to 5.2% of those who did receive accommodations. This is also reflected in the fewer number of years since onset for those who did not receive accommodations compared to those who do. We also exam-ine whether individual characteristics vary based on the type of workplace accommoda-tion received (Appendix Table 7). There is some slight variaaccommoda-tion; for example, those who have a flexible schedule are more likely to have a bachelor’s degree or higher than those who receive help with transportation, have a personal care attendant or personal assistant, or receive help with child or family care. These latter groups are not only more likely to have less than a high school degree but also more likely to perceive themselves as being in excellent health.
We also find a number of significant differences in the characteristics of individuals who report specific employment barriers that could be addressed by accommodations—namely, an inaccessible workplace and lack of reliable transportation. A disproportionate share of workers reporting inaccessible workplaces as a barrier do not have a high school degree, have physical disabilities, have poor self-rated health, and report being easily distracted at work. Individuals that cite lack of transportation as a barrier are less likely to have physical disabilities alone but more likely to have multiple disabilities. They are also less likely to be married, have had more years pass since the onset of their disability, and to report being easily distracted at work.
6 Conclusions
The results have shown that the receipt of workplace accommodations plays a significant role in the employment of people with disabilities. At least one third of nonworking people with disabilities report barriers to their employment that could be addressed with accommodations, such as an inaccessible workplace or lack of transportation. Further-more, receiving workplace accommodations such as a flexible work schedule, help with transportation, and a personal care attendant or personal assistant in the current or more recent job is positively correlated with current employment. Finally, our results reveal a
Table 4Regression results of employment on workplace accommodations, overall, and by disability subgroup(Continued)
Dependent variable: currently employed
Characteristics All (1) Physical only
(2) Sensory only
(3) Psychiatric only
(4) Multiple disabilities
(5) Recent disability onset
N= 2282 N= 894 N= 236 N= 190 N= 873 N= 339
Perseveres until task is done
0.020 0.036 0.132 0.002 −0.002 0.053
[0.03] [0.04] [0.09] [0.13] [0.04] [0.07]
Is easily distracted 0.020 0.009 0.015 0.057 0.015 −0.068
[0.03] [0.05] [0.08] [0.14] [0.04] [0.08]
Source: Survey of Disability and Employment. Note: The dependent variable for all regressions is an indicator for being currently employed. Standard errors are in square brackets
number of differences by demographic characteristics in perceived barriers and receipt of workplace accommodations. Those who did not receive workplace accommodations in their current or most recent job are more likely to be in poor health or have a physical disability only relative to those who did receive them. Those who perceive workplace ac-cessibility as an employment barrier are more likely to have lower levels of educational at-tainment, be in poor health, and have physical disabilities than those that do not share
Table 5Individual characteristics by receipt of workplace accommodations in current or last job
Characteristics Percentage by receipt of accommodation
No accommodation Accommodation Difference
N= 523 N= 1759
Currently employed 26.2 36.8 10.6***
Gender
Male 52.5 49.4 −3.2
Female 47.5 50.6 3.2
Hispanic 4.6 5.5 0.9
Education
Less than high school 15.1 14.5 −0.7
High school 41.0 40.9 −0.1
Some college or associate’s degree 32.5 32.9 0.4
Bachelor’s degree or higher 11.3 11.7 0.4
Disability type
Physical only 41.5 35.9 −5.6***
Sensory only 9.0 6.8 −2.2*
Intellectual only 0.0 1.0 1.0**
Cognitive only 2.2 2.8 0.7
Psychiatric only 9.7 11.0 1.3
Other only 0.1 0.8 0.7
Several disabilities 37.5 41.6 4.1*
Age (mean) 44.9 42.4 −2.5***
Married 25.7 19.3 −6.4***
Self-rated health
Excellent 5.1 8.3 3.2**
Very good 14.9 19.0 4.1**
Good 34.8 31.8 −2.9
Fair 31.2 31.1 0.0
Poor 14.1 9.8 −4.3***
Years since onset 14.0 16.2 2.2***
Recent onset 15.6 13.9 −1.8
Birth onset 3.2 5.2 2.0*
Executive functioning
Is a reliable worker 85.5 87.5 2.0
Perseveres until task is done 79.6 78.7 −1.0
Is easily distracted 16.2 20.9 4.7**
Source: Authors’tabulations of the Survey of Disability and Employment
this perception. It is unclear whether these differences reflect underlying differences in need or employer willingness to provide accommodations or both.
The interpretation of our results is subject to some limitations. First, our results are specific to Mississippi, New Jersey, and Ohio. They may not be generalizable to
Table 6Individual characteristics by employment barriers reported for those who are not working
Characteristics Percentage by reported employment barrier
Inaccessible workplace is a barrier
Inaccessible workplace is not a barrier
Difference Lack of transportation is a barrier
Lack of transportation is not a barrier
Difference
N= 412 N= 855 N= 369 N= 898
Gender
Male 49.5 51.7 −2.2 49.9 51.5 −1.6
Female 50.5 48.3 2.2 50.1 48.5 1.6
Hispanic 4.6 5.1 −0.5 3.8 5.4 −1.6
Education
Less than high school 19.5 13.9 5.6*** 18.4 14.6 3.8*
High school 41.7 43.4 −1.7 46.2 41.5 4.7
Some college or associate’s degree
30.4 34.2 −3.8 28.7 34.8 −6.1**
Bachelor’s degree or higher
8.3 8.5 −0.1 6.8 9.1 −2.3
Disability type
Physical only 44.7 36.1 8.6*** 33.9 40.9 −7.1**
Sensory only 2.7 3.5 −0.8 4.0 2.9 1.1
Intellectual only 0.5 0.6 −0.2 0.0 0.8 −0.8*
Cognitive only 0.9 3.5 −2.6*** 2.2 2.9 −0.7
Psychiatric only 6.8 12.8 −6.0*** 11.1 10.7 0.3
Other only 0.0 1.1 −1.1** 1.1 0.6 0.5
Several disabilities 44.4 42.5 1.9 47.8 41.2 6.7**
Age (mean) 44.1 41.9 2.2*** 43.0 42.5 0.5
Married 19.3 17.5 1.8 14.8 19.5 −4.7**
Self-rated health
Excellent 6.5 7.4 −0.9 7.1 7.1 0.0
Very good 10.1 15.8 −5.8*** 12.1 14.8 −2.7
Good 26.9 33.6 −6.6** 32.0 31.1 0.9
Fair 36.6 32.5 4.2 32.8 34.2 −1.4
Poor 19.9 10.8 9.2*** 16.0 12.8 3.1
Years since onset 15.9 15.2 0.6 17.5 14.6 3.0***
Recent onset 13.3 12.5 0.8 8.5 14.5 −6.0***
Birth onset 4.8 4.0 0.8 5.6 3.7 1.9
Executive functioning
Is a reliable worker 81.1 87.5 −6.4*** 82.8 86.5 −3.8*
Perseveres until task is done
76.4 78.8 −2.3 75.8 78.9 −3.1
Is easily distracted 26.0 18.1 7.9*** 26.8 18.1 8.7***
Source: Authors’tabulations of the Survey of Disability and Employment
the population with disabilities in other states. Similarly, the SDE sample is limited to VR applicants, who may differ from the rest of the population of people with disabilities. Given that VR services aim to meet employment goals, VR applicants indicate at least some interest in employment through the act of applying for services. Interest and ability to work may be even higher in our sample because we imposed a restriction that individuals must have a work history to be included in the analyses. Third, because receipt of accommodations and exposure to employ-ment barriers are not experienced at random, our findings should be interpreted as descriptive findings of correlations rather than as causal estimates. Finally, we are able to analyze differences in the characteristics observed only in the SDE survey data; in other words, other unobservable characteristics, such as severity of disabil-ity, work-related skills, and local labor market conditions, could conceivably influence the relationship between the receipt of workplace accommodations and employment, but we did not explore these characteristics.
Despite these limitations, our findings are encouraging because they suggest several important policy implications. Even though existing literature has thoroughly docu-mented differences in employment rates by demographic characteristics and health conditions, the findings in this study point to specific factors that practitioners, policy makers, and employers can address. First, the fact that one third of nonworking people with disabilities perceive that an inaccessible workplace or lack of transportation is a barrier to their employment and that accommodations to address these barriers are positively correlated with employment suggests the need for additional efforts to pro-vide people with disabilities with these types of supports. This includes supporting em-ployers so they better understand how to accommodate workers who have disabilities. Although our findings cannot be generalized nationally to people with disabilities, this sample of individuals who have applied for VR services are highly motivated to work and very likely to benefit from policies and practices that improve access to workplace accommodations.
Second, our findings provide some suggestions for groups of people with disabilities who VR agencies may want to target for providing workplace accommodations, such as workers who report being in poor health or have a physical disability only. These two groups have demonstrated an ability to work but were less likely to have received ac-commodations in their current or most recent job and more likely to report an in-accessible workplace as an employment barrier. This suggests that these two groups may be more likely to work if they were provided appropriate accommodations. How-ever, before targeting these groups, more research is needed to confirm that they do not receive workplace accommodations because they are being overlooked or denied access rather than because they do not need them.
Endnotes 1
See http://jamanetwork.com/journals/jama/pages/instructions-for-authors#Genera-lInformationfor the Journal of the American Medical Association’s standards for suffi-cient response rates.
2
A total of 522 observations, 19% of the original sample, are lost due to missing data. 3
Acknowledgements
The authors thank Kenneth Jackson for the excellent programming support.
The authors would also like to thank the anonymous referee and the editor for the useful remarks. Responsible editor: Juan Jimeno
Funding
This project was funded by the National Institute on Disability, Independent Living, and Rehabilitation Research (US Department of Health and Human Services) through the Rehabilitation and Research Training Center on Individual Characteristics at Kessler Foundation, under cooperative agreement 90RT5017-01-01.
The findings and conclusions are those of the authors and do not represent the policy of HHS or NIDILRR. The authors retain sole responsibility for any errors or omissions.
Availability of data and materials
Additional results and copies of the computer programs used to generate the results presented in the paper are available from Priyanka Anand at [email protected]. Researchers who wish to access the data, which are proprietary, can contact John O’Neill at Kessler Foundation at [email protected].
Competing interest
The IZA Journal of Labor Policy is committed to the IZA Guiding Principles of Research Integrity. The authors declare that they have observed these principles.
Publisher’s Note
Springer Nature remains neutral with regard to jurisdictional claims in published maps and institutional affiliations.
Author details
1Department of Health Administration and Policy, George Mason University, 4400 University Drive, MS1J3, Fairfax, VA
22030, USA.2Mathematica Policy Research, 600 Alexander Park, Princeton, NJ 08540, USA.
Received: 20 October 2016 Accepted: 29 September 2017
References
Allaire SH, Wei L, LaValley MP (2003) Work barriers experienced and job accommodations used by persons with arthritis and other rheumatic diseases. Rehabil Couns Bull 46(3):147–156
Balser DB (2007) Predictors of workplace accommodations for employees with mobility-related disabilities. Adm Soc 39(5):656–683 Burkhauser RV, Butler JS, Kim YW (1995) The importance of employer accommodation on the job duration of workers
with disabilities: a hazard model approach. Labour Econ 2:109–130
Burkhauser RV, Daly MC (1996) Employment and economic well-being following the onset of a disability. In: Mashaw JL et al (eds) Disability and cash benefits. W.E. Upjohn Institute for Employment Research, Kalamazoo, MI, pp 59–101 Campolieti M (2004) The correlates of accommodations for permanently disabled workers. Ind Relat 43(3):546–572 Chow, C.M. 2012.Reasonable job accommodations: an econometric investigation into strategies addressing barriers to
employment for individuals with psychiatric disabilities.Brandeis University doctoral dissertation. Proquest Dissertations Publishing, 2012. 3539932
Clay SL, Alston R (2016) Assistive technology use and veterans: an examination of racial differences between whites and blacks using the HAAT model. J Vocational Rehabil 45(2):159–171
Cook JA, Burke-Miller JK, Grey DD (2015) Reasons for job separation among people with psychiatric disabilities (DRC brief 2015–04). Mathematica Center for Studying Disability Policy, Washington, DC
Hill MJ, Maestas N, Mullen KJ (2016) Employer accommodation and labor supply of disabled workers. Labour Econ 41:291–303 Houtenville A, Sevak P, O’Neill J, Cardoso E (2013) Disability, prevalence and economic outcomes. In: Strauser D (ed)
Career development, employment and disability: from theory to practice. Springer, New York, NY, pp 11–40 Houtenville AJ, Brucker DL, Lauer EA. 2014. Annual Compendium of Disability Statistics. Durham, NH: University of New
Hampshire, Institute on Disability.
Kraus L (2015) 2015 disability statistics annual report. University of New Hampshire, Durham, NH
Kristman, Vicki L., William S. Shaw, Cécile R.L. Boot, George L. Delclos, and Michael J. Sullivan. 2016. Researching complex and multi-level workplace factors affecting disability and prolonged sickness absence.Journal of Occupational Rehabilitation.Online ahead of print. Accessed at http://link.springer.com/article/10.1007/s10926-016-9660-3. (August 1, 2016)
Sevak P, Houtenville AJ, Brucker DL, O’Neill J (2015) Individual characteristics and the disability employment gap. J Disabil Policy Stud 26(2):1–9
Sevak P, Khan S (2017) Psychiatric vs. physical disabilities: a comparison of barriers and facilitators to employment. Psychiatric Rehabil Jl 40(2):163–171